Microdata and TableBuilder: Retirement and Retirement Intentions
Enables detailed analysis of retirees and retirement plans
Retirement and Retirement Intentions microdata in DataLab
Retirement and Retirement Intentions microdata is available in ABS DataLab for the first time, released as a supplementary file for the Longitudinal Labour Force (LLFS) microdata. All existing users of the LLFS microdata will automatically get access to the additional file (use of the file may require an updated project proposal) and new users can apply for access to both files.
A detailed data item list for the Retirement and Retirement Intentions microdata is available in Data downloads.
Retirement and Retirement Intentions in Tablebuilder
The release of the 2020-21 Retirement and Retirement Intentions microdata into Tablebuilder has been delayed until next year due to ongoing delays while the ABS upgrades the infrastructure behind TableBuilder to support the load from the 2021 Census. The previously released and unrevised issues of Barriers and Incentives to Labour Force Participation, Retirement and Retirement Intentions in Tablebuilder for the periods 2010-11, 2016-17, and 2018-19 will remain available during this time.
Introduction
This product provides a range of information about the release of microdata relating to changes in retirement trends over time, factors which influence retirement, and the income arrangements made by retirees and potential retirees for their retirement.
Microdata are the most detailed information available from a survey and are generally the responses to individual questions on the questionnaire or data derived from two or more questions.
Retirement and Retirement Intentions
The Retirement and Retirement Intentions survey is collected monthly as a module of the Multi-Purpose Household Survey (MPHS) with the sample pooled across a financial year. The survey has been run every second year since 2004-05.
The survey is designed to provide a large range of statistics on retirees and retirement plans across the following conceptual groups:
- Geography
- Demographics
- Cultural diversity
- Families and children
- Education and qualifications
- Health and disability
- Unpaid work and care
- Participation and underemployment
- Characteristics of employment
- Characteristics of main job
- Characteristics of last job
- Wanting to work
- Looking for work
- Current income and housing
- Partner's participation and income
- Retirement status
- Income at retirement
- Current living costs in retirement
- Superannuation
- Factors influencing retirement decisions
- Retirement intentions
- Transition to retirement plans
- Expected income at retirement
- Returning to work after retirement
Microdata from the Retirement and Retirement Intentions survey is released in both Tablebuilder and DataLab for the following years:
- TableBuilder: 2010-11, 2016-17 and 2018-19 (as originally published),
- DataLab: 2014-15 to 2020-21 (revised data using current methods and population benchmarks).
TableBuilder is an online tool for creating tables and graphs from underlying microdata. Refer to TableBuilder for more information.
DataLab is the analysis solution for high-end users who want to undertake real time complex analysis of detailed microdata in a secure environment. Refer to DataLab for more information.
Accessing the data
You can use this data in:
- TableBuilder - online tool for creating tables and graphs.
- DataLab - analyse detailed microdata
Compare data services to see what's right for you. Information on how to apply for access can be found in TableBuilder and DataLab.
Further information about these products, and other information to assist users in understanding and accessing microdata in general, is available from the Microdata and TableBuilder Entry Page.
Further information
Further information about the survey and the microdata can be found in the various pages associated with this product, including:
- Detailed lists of data items are available in Data downloads.
Support
For further support in the use of this product, please contact Microdata Access Strategies via microdata.access@abs.gov.au.
Data available on request
Data collected in the survey but not included in DataLab or TableBuilder may be available from the ABS, on request, as statistics in tabulated form.
Subject to confidentiality and sampling variability constraints, special tabulations can be produced incorporating data items, populations and geographic areas selected to meet individual requirements. These are available, on request, on a fee for service basis. For more information, contact the ABS by visiting www.abs.gov.au/about/contact-us or email the the Labour Statistics Branch at labour.statistics@abs.gov.au.
Privacy
The ABS Privacy Policy outlines how the ABS handles any personal information that you provide to us.
Data and file structure
Survey methodology
General information about the Retirement and Retirement Intentions (RaRI) survey, including summary results, are available in Retirement and Retirement Intentions.
Detailed information about the survey including scope and coverage, survey design, data collection methodology, weighting, estimation and benchmarking, estimate reliability and a glossary can be accessed from the Methodology page of the publication.
Data items
The data items included in the RaRI TableBuilder are grouped under broad headings and subheadings as shown in the image below. A complete data items list can be found in Data downloads.
File structure
The underlying format of the RaRI file is structured at a single person level. This person level contains general demographic information such as age, sex, country of birth and status of employment as well details about employment, weekly income and qualifications.
When tabulating data from TableBuilder, person weights are automatically applied to the underlying sample counts to provide the survey's population estimates.
Not applicable categories
Most data items included in the TableBuilder file include a 'Not applicable' category. This category generally represents the number of people who were not asked a particular question or the number of people excluded from the population for a data item when that item was derived (e.g. Hours usually worked in main job is not applicable for unemployed persons or persons not in the labour force).
Table populations
The population relevant to each data item should be kept in mind when extracting and analysing data. The actual population count for each data item is equal to the total cumulative frequency minus the 'Not applicable' category.
Generally, some populations can be 'filtered' using other relevant data items. For example, if the population of interest is 'Employed', any data item with that population (excluding the 'Not applicable' category) could be used.
Zero value cells
Tables generated from sample surveys will sometimes contain cells with zero values because no respondents that satisfied the parameters of a particular cell in a table were in the survey. This is despite there being people in the general population with those characteristics. This is an example of sampling variability which occurs with all sample surveys. Relative Standard Errors cannot be generated for zero cells.
Using TableBuilder
For general information relating to the TableBuilder or instructions on how to use features of the TableBuilder product, please refer to TableBuilder and the TableBuilder, User Guide.
More specific information applicable to Retirement and Retirement Intentions (RaRI) survey TableBuilder, which should enable users to understand, interpret and tabulate the data, is outlined below.
Confidentiality features in TableBuilder
In accordance with the Census and Statistics Act 1905, all the data in TableBuilder are subjected to a confidentiality process before release. This confidentiality process is undertaken to avoid releasing information that may allow the identification of particular individuals, families, households, dwellings or businesses.
Processes used in TableBuilder to confidentialise records include the following:
- perturbation of data; and
- table suppression
Perturbation effects
To minimise the risk of identifying individuals in aggregate statistics, a technique is used to randomly adjust cell values. This technique is called perturbation. Perturbation involves small random adjustments of the statistics and is considered the most satisfactory technique for avoiding the release of identifiable statistics while maximising the range of information that can be released. These adjustments have a negligible impact on the underlying pattern of the statistics.
The introduction of these random adjustments result in tables not adding up. As a result, randomly adjusted individual cells will be consistent across tables, but the totals in any table will not be the sum of the individual cell values. The size of the difference between summed cells and the relevant total will generally be very small.
Please be aware that the effects of perturbing the data may result in components being larger than their totals. This includes determining proportions.
Table suppression
Some tables generated within TableBuilder may contain a substantial proportion of very low counts within cells (excluding cells that have counts of zero). When this occurs, all values within the table are suppressed in order to preserve confidentiality. The following error message below is displayed (in red) at the bottom of the table when table suppression has occurred.
ERROR: The table has been suppressed as it is too sparse
ERROR: table cell values have been suppressed
Counting units and weights
Weighting is the process of adjusting results from a sample survey to infer results for the total population. To do this, a 'weight' is allocated to each record. The weight is the value that indicates how many population units are represented by each sample unit.
To produce estimates for the in-scope population you must use a weight field in your tables. In TableBuilder they can be found under the 'Summation Options' category in the left hand pane under the applicable level. If you do not select a weight field, TableBuilder will apply 'Person weight' by default. This will give you estimates of the number of persons.
If you are estimating the number of persons with certain characteristics (e.g. 'Level of highest non–school qualification') the weight listed under the category heading 'Person level weighting' must be used.
Selecting data items for cross-tabulation
The Person level contains a range of data items detailing the characteristics of respondents including demographic, education, labour force, retirement status, retirement plans, and population variables.
Populations and data items
When adding a data item to a table, it should be noted that not all respondents to the survey may be associated with that data item. For example, the data item “Duration since retirement from the labour force” only applies to people who were retired. The “Not applicable” category is used to indicate people who were not retired.
Similarly, if users want to add multiple data items to a table they should ensure that these data items are applicable to the same population group.
For more information about data items, users should refer to the Data Items List available from Data downloads.
Cross-tabulating data items on the same level
Cross-tabulating data from the person level with other data items from the same level will produce data about people. For example, cross-tabulating the geographic variable 'State or territory of usual residence' by the 'Hours usually worked in all jobs' produces a table showing the number of people in each region by the hours that they usually work each week in all jobs.
Multi-response data items
A number of the survey's data items allow respondents to report more than one response. These are referred to as 'multi–response data items'. An example of such a data item is pictured below. For this data item, respondents can report all sources of personal income at retirement.
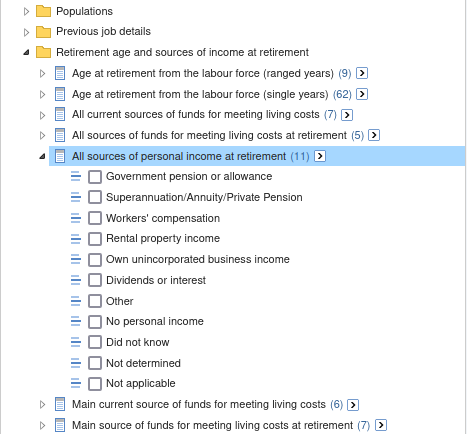
When a multi–response data item is tabulated, a person is counted against each response they have provided (e.g. a person who responds 'Government pension or allowance' and 'Superannuation/Annuity/Private Pension' will be counted once in both of these categories).
As a result, each person in the appropriate population is counted at least once, and some people are counted multiple times. Therefore, the total for a multi–response data item will be less than or equal to the sum of its components.
For more information on definitions and concepts that apply to the data items in this file, please refer to Retirement and Retirement Intentions and Labour Force.
Using DataLab
DataLab allows real time access to detailed microdata files through a portal to a secure ABS environment. Using detailed microdata in DataLab allows users to run advanced statistical analyses using recent analytical software.
For information about the data items available on the detailed microdata files, see the Data Item Lists in Data downloads.
About DataLab
Detailed microdata files in DataLab can be accessed on-site at ABS offices or in a secure virtual environment from your own computer. All unit record data remains in DataLab, and any analysis results or tables are checked by the ABS before being provided to users.
Refer to DataLab for more information, including prerequisites for DataLab access.
Retirement and Retirement Intentions microdata in DataLab
Retirement and Retirement Intentions (RaRI) microdata is now available in ABS DataLab, released as a supplementary file for the Longitudinal Labour Force (LLFS) microdata. All existing users of the LLFS microdata will automatically get access to the additional file (use of the file may require an updated project proposal) and new users can apply for access to both files.
This release of Retirement and Retirement Intentions microdata features financial year data for the years 2014-15, 2016-17, 2018-19 and 2020-21.
Record identifiers
The record identifiers used in the RaRI and LLFS microdata are consistent across both files. This is to facilitate data linkage between the two files and enable further analysis.
The RaRI survey is collected by personal interview from a random person aged 45 years and over in private dwellings from 1/16th of the Labour Force Survey (LFS) sample (selected from the 'outgoing rotation group' - people who are in their final month of selection in the LFS). This means that most records on the LLFS will not have a corresponding RaRI record.
The RaRI survey is collected monthly, with the sample pooled over a financial year. The survey month identifier (ABSMID), which indicates the month of collection, has been included to facilitate data linkage to the LLFS. While this can provide monthly sub-samples, it is recommended that in most cases the microdata should be analysed using the whole financial year sample, using the 'Reference year' (REFYEAR) identifier to mark different points in time.
More details on these records and the formatting of record identifiers can be found in the Data Item List in Data downloads.
Weights
Person level weights (and replicate weights for calculating standard errors) are provided on the RaRI file. These differ from the weights provided on the LLFS file, as the weights are recalibrated for RaRI due to the reduced sample size compared to the LFS. Aggregate estimates from both sets of weights will align closely, as the RaRI survey data is benchmarked to match the corresponding 12-month average of estimates from the LFS, but care should be taken when performing micro analysis.
Weights and replicate weights have been calibrated for the surveys whole financial year sample and should be used in conjunction with the Reference year (REFYEAR) identifier.
RaRI weights are recommended for cross-sectional analysis of RaRI data items, but when linking RaRI and LLFS data for longitudinal analysis, new weights should be calculated based on the population benchmarks provided on the LLFS file. Care should be taken to account for attrition bias by adjusting the weights appropriately (increasing the weights for those more likely to leave the LFS). More information on using benchmarks and weights for longitudinal analysis is provided in Longitudinal Labour Force.
Historical microdata in DataLab
Prior to 2014, microdata relating to retirement and retirement intentions was released in a number of Confidentialised Unit Record Files (CURFs). These files are now also available in ABS DataLab.
For more information about these microdata releases, refer to the following archived publications:
- Information Paper: Multi-Purpose Household Survey (MPHS), Expanded Confidentialised Unit Record File, 2004-05 (cat. no. 4100.0)
- Multi-Purpose Household Survey (MPHS), Expanded Confidentialised Unit Record File, Technical Manual, 2006-07 (cat. no. 4100.0)
- Technical Manual: Multipurpose Household Survey (MPHS), Expanded CURF, Australia, 2008-09 (cat. no. 4100.0)
- Employment Arrangements and Superannuation (SEAS), Australia: Confidentialised Unit Record File, Technical Paper, 2000 (cat. no. 6361.0.55.002)
- Employment Arrangements, Retirement and Superannuation (SEARS), User Guide, Australia, April to July 2007 (cat. no. 6361.0.55.002)
Data downloads
DataLab - 2014-15 to 2020-21
DataLab: Retirement and Retirement Intentions Data Item List, 2014-15 to 2020-21
Table 1. Population counts
TableBuilder - 2010-11 to 2018-19
Previous TableBuilder releases were published in conjunction with microdata from the Barriers and Incentives to Labour Force Participation survey.
TableBuilder: Retirement and Retirement Intentions Data Item List, 2018-19
TableBuilder: Retirement and Retirement Intentions Data Item List, 2016-17
TableBuilder: Retirement and Retirement Intentions Data Item List, 2010-11
Historical microdata - 2000 to 2008-09
Previous releases of microdata were published in conjunction with other topics collected from the Multipurpose household survey.
DataLab: Retirement and Retirement Intentions Data Item List, 2008-09
DataLab: Retirement and Retirement Intentions Data Item List, 2006-07
DataLab: Retirement and Retirement Intentions Data Item List, 2004-05
DataLab: Employment Arrangements, Retirement and Superannuation Data Item List, April to July 2007
DataLab: Employment Arrangements and Superannuation Data Item List, April to June 2000
History of changes
29/08/2023 - First release
This is the first release of Microdata and TableBuilder: Retirement and Retirement Intentions. Data was previously published in conjunction with the Barriers and Incentives to Labour Force Participation survey. Future releases will continue to improve and develop these surveys as separate titles.
Previous catalogue number
This release uses ABS catalogue number 6258.0.55.001.
Data from this release was previously published in Microdata: Barriers and Incentives to Labour Force Participation, Retirement and Retirement Intentions (6238.0.5.001).