The ABS will be closed from 12.00pm, 24 December 2024 and will reopen at 9.00am, 2 January 2025. During this time there will be no statistical releases and our support functions will be unavailable. The ABS wishes you a safe and happy Christmas.

Disability, Ageing and Carers, Australia: Summary of Findings

This is not the latest release View the latest release

This release includes analysis and data cubes focusing on national level data as well as relevant explanatory material

Reference period
2018
Released
24/10/2019

Key statistics

Disability

  • In 2018 there were 4.4 million Australians with disability, 17.7% of the population, down from 18.3% in 2015.
  • The prevalence of disability increased with age - one in nine (11.6%) people aged 0-64 years and one in two (49.6%) people aged 65 years and over had disability.
  • Disability prevalence was similar for males (17.6%) and females (17.8%).
  • 5.7% of all Australians had a profound or severe disability.
  • Almost one-quarter (23.2%) of all people with disability reported a mental or behavioural disorder as their main condition, up from 21.5% in 2015.
     

Of those with disability (living in households): 

  • one-third (33.4%) of those aged 15 years and over had completed year 12 or equivalent, up from 31.4% in 2015
  • one in six (16.1%) aged 15 years and over had a Bachelor degree or above, up from 14.9% in 2015
  • 37.9% of those aged 15-64 years said their main source of personal income was a government pension or allowance, down from 41.9% in 2015
  • 59.7% of people had their need for assistance fully met, down from 62.1% in 2015
  • one in 10 (9.6%) aged 15 years and over had experienced discrimination in the previous 12 months because of their disability, up from 8.6% in 2015
  • labour force participation for those aged 15-64 years has remained stable since 2015 at 53.4%, in contrast to an increase in the participation rate for people without disability (84.1%)
  • 11.4% of those with a profound or severe disability (aged 15-64 years) were working full-time up from 7.9% in 2015.
     

Older people

  • One in every six Australians (15.9% or 3.9 million people) was aged 65 years and over (up from 15.1% in 2015).
  • Most older Australians (persons aged 65 years and over) were living in households (95.3%), with 4.6% living in cared accommodation.
  • Half (49.6%) of all older Australians had disability (similar to 2015).
  • 1.3 million older Australians living at home needed some assistance with everyday activities, and of these, almost two-thirds (65.9%) had their need fully met (down from 69.2% in 2015).
  • Two-thirds (68.1%) of older Australians (who reported income) lived in a low income household (a household earning less than $756 per week).
  • Almost all older Australians had participated in social activities at home (97.4%) or outside their home (94.4%) in the previous three months.
     

Carers

  • There were 2.65 million carers, representing 10.8% of all Australians (down from 11.6% in 2015).
  • Females were more likely to be carers (12.3% of all females) than males (9.3% of all males).
  • There were 235,300 young carers (under the age of 25), down from 274,700 in 2015.
  • 3.5% of all Australians were primary carers.
  • Seven in ten (71.8%) primary carers were women.
  • Over one-third (37.4%) of primary carers had disability, twice the rate of non-carers (15.3%).
  • The most common reason primary carers gave for taking on a caring role was a sense of family responsibility (70.1% of all primary carers).
  • Half (50.2%) of all carers lived in a household in the lowest two equivalised gross income quintiles, twice that of non-carers (25.6%).
Disability

In 2018, 17.7% of all Australians had disability, down from 18.3% in 2015 and 18.5% in 2012. Prevalence was similar for males and females:

  • 17.6% of males, down from 18.0% in 2015 and 18.0% in 2012
  • 17.8% of females, down from 18.6% in 2015 and 19.0% in 2012.
     

The age standardised disability rate was 16.1%, down from 17.0% in 2015 and 17.4% in 2012.

Definitions:

Disability - any limitation, restriction or impairment which restricts everyday activities and has lasted, or is likely to last, for at least six months. For more information see the Methodology.
Age standardisation - removes the effects of age allowing comparisons between two or more populations with different age structures. For more information see the Methodology.

Number of people with disability

The number of people with disability has increased. In 2018, there were 4.4 million people with disability (up from 4.3 million in 2015). Of all people with disability, 1.9 million were aged 65 years and over (up from 1.8 million in 2015):

  • representing almost half (44.5%) of all people with disability (up from 41.9% in 2015 and 40.7% in 2012); and
  • reflecting both an ageing population and increasing life expectancy of Australians.
     

Age and sex

The rate of disability generally increased with age for males and females:

  • 3.7% of 0-4 year olds had disability, increasing to 84.6% of those aged 90 years and over
  • the largest difference between males and females was for children aged 5-14years (12.0% of boys with disability compared with 7.1% of girls).
     

Disability prevalence over time

The pattern of disability prevalence across age was similar between 2015 and 2018, however there were some notable changes among certain age groups:

  • one-quarter (26.9%) of people aged 60-64 years had disability, down from 31.5% in 2015
  • one in ten (9.9%) people aged 35-44 years had disability, down from 12.1%
  • one in five (20.5%) women aged 55-59 years had disability, down from 24.4%.
     

Disability status

Disability status is a measure of the severity of limitations experienced by people with disability. In 2018, of the 4.4 million Australians who had disability, almost 3.9 million people had a limitation with the core activities of communication, mobility or self-care and/or a schooling or employment restriction. As a proportion of the Australian population:

  • 3.2% had a profound limitation
  • 2.6% had a severe limitation
  • 2.4% had a moderate limitation
  • 6.1% had a mild limitation
  • 1.4% had a schooling or employment restriction only.
     

These rates were similar to 2015.

Profound or severe disability by age and sex

Overall, females were more likely to have a profound or severe disability (6.0%) than males (5.5%); however, this was not the case for children. Generally, boys were more likely than girls to have a profound or severe limitation:

  • 3.3% of boys aged 0-4 years, compared with 1.5% of girls
  • 7.5% of boys aged 5-14 years, compared with 3.7% of girls.


This pattern was reversed for older people (older women were more likely than older men to have a profound or severe disability) reflecting, in part, the longer life expectancy of women:

  • almost half (48.6%) of all women aged 85-89 years, compared with 35.6% of men of the same age
  • over two-thirds (66.4%) of women aged 90 years and over, compared with 48.9% of men aged 90 years and over.
     

Definitions:

Profound limitation - greatest need for help, that is, always needs help with at least one core activity
Severe limitation - needs help sometimes or has difficulty with a core activity
Moderate limitation - no need for help but has difficulty
Mild limitation - no need for help and no difficulty, but uses aids or has limitations
Limitation - a person has a limitation if they have difficulty, need assistance from another person, or use an aid or other equipment to perform one or more core activities (communication, mobility and self-care). For more information see the Glossary.

Living arrangements

While most people (95.7%) with disability lived in households, 4.3% lived in cared-accommodation. The likelihood of a person with disability living in cared-accommodation increased with age and disability severity:

  • one in five (19.4%) people with disability aged 80 years and over lived in cared-accommodation, compared with 3.2% of those aged 65-79 years
  • less than 1.0% (13,500) of people aged 0-64 years with disability lived in cared-accommodation
  • more than one in five (21.2%) people with a profound limitation lived in cared-accommodation, compared with 2.7% of those with a severe limitation.

Definitions:

Cared-accommodation - includes hospitals, nursing homes, aged care hostels, cared components of retirement villages, psychiatric institutions, and other 'homes' such as group homes for people with disability where a person must have been a resident, or expected to be a resident, for three months or more. For more information see the Glossary.

Disability prevalence in states and territories

Disability prevalence varied between Australia’s states and territories, due in part to their differing age structures. Most notably:

  • over one-quarter (26.8%) of people in Tasmania had disability, higher than all other states and territories, followed by the Australian Capital Territory and South Australia (both 19.4%).
     

People with disability by state or territory of usual residence - 2018

 All with reported disability
 2015 2018
State or territory of usual residence'000%RSE of Estimate (%)'000%RSE of Estimate (%)
 New South Wales1372.418.12.31346.216.92.0
 Victoria1098.818.52.11098.217.02.2
 Queensland859.018.33.2938.119.12.6
 South Australia382.722.92.4332.519.45.7
 Western Australia362.714.63.1411.516.42.5
 Tasmania131.725.82.8140.126.86.2
 Northern Territory20.711.75.920.711.613.8
 Australian Capital Territory62.016.23.480.019.46.1
Total4290.118.31.14367.217.71.2


There were some states and territories that experienced greater change in disability prevalence between 2015 and 2018:

  • 19.4% of those in South Australia had disability, down from 22.9% in 2015
  • 19.4% of those in the Australian Capital Territory had disability, up from 16.2% in 2015
  • 16.4% of those in Western Australia had disability, up from 14.6% in 2015.
     

Main long-term health conditions of people with disability

Of the 4.4 million Australians with disability in 2018, over three-quarters (76.8%) reported a physical disorder as their main condition (the condition causing them the most problems), similar to 2015 (78.5%).

The most common physical disorder was a musculoskeletal disorder (29.6%, down from 31.4% in 2015), including:

  • arthritis and related disorders (12.7%, no change from 12.7% in 2015)
  • back problems (12.6%, down from 13.8% in 2015).


Of all people with disability, almost one-quarter (23.2%) reported a mental or behavioural disorder as their main condition, up from 21.5% in 2015. The most common mental and behavioural disorders were:

  • psychoses and mood disorders (7.5%, similar to 7.6% in 2015),
  • intellectual and development disorders (6.5%, similar to 6.3% in 2015)
  • neurotic, stress related and somatoform disorders (6.1%) up from 5.2% in 2015.
     

Main long-term health condition by disability status

Those with a profound or severe limitation were more than twice as likely to report a mental or behavioural disorder (34.2%) than those with a moderate or mild limitation (14.5%).

Of those with a profound or severe limitation:

  • 12.4% reported psychoses or mood affective disorders such as Dementia and Alzheimer's
  • 12.1% reported intellectual or development disorders.


Those with a moderate or mild limitation were much more likely to report a physical condition (85.5%) than those with a profound or severe limitation (65.9%).

Of those with a moderate or mild limitation:

  • 16.0% reported arthritis and related disorders
  • 15.3% reported having back problems.

Definitions:

Long-term health condition - a disease or disorder that has lasted, or is likely to last, for six months or more. The SDAC collects information about long-term health conditions and through a series of screening questions, determines whether they restrict a person’s ability to do activities. People whose long-term conditions limit their activities are identified as having disability.
Main condition - for respondents with more than one long-term health condition, their main condition is the one causing the most problems.
Neurotic, stress-related and somatoform disorders - includes phobic anxiety disorders, other anxiety-related disorders, obsessive compulsive disorders, reaction to severe stress and adjustment disorders, dissociative (conversion) disorders, somatoform disorders and other neurotic disorders.

Employment characteristics of people with disability

Need for assistance

Aids and equipment

Social and community participation

Disability discrimination

Older people

Australia’s population is continuing to age. Among the 24.7 million Australians in 2018, one in every six (15.9% or 3.9 million people) was aged 65 years and over, increasing from:

  • 15.1% in 2015
  • 14.3% in 2012
  • 13.3% in 2009 (or 2.9 million people).
     

This represents an estimated 35% increase in the number of older people between 2009 and 2018 (2.9 million to 3.9 million), compared with a 10% increase for those aged 0 to 64 years for this same time period (from 18.9 million to 20.8 million).

A higher proportion of females were aged 65 years and over (16.7%) than males (15.0%), with the difference increasing in older age groups:

  • 12.1% of women and 11.7% of men were aged 65-79 years
  • 4.6% of women and 3.3% of men were aged 80 years and over.
     

​​​​​​​Living arrangements

Most older people (95.3%) were living in households, with 4.6% (181,200 people) living in cared-accommodation. Of all older Australians:

  • men were more likely to be living in households (96.8%) compared with women (94.2%)
  • women living in households were almost twice as likely to live alone (33.7%) than men (18.1%)
  • the likelihood of living in cared-accommodation increased with age from 1.4% of people aged 65 to 79 years (similar to 2015) to 14.3% of people aged 80 years and over (a decrease from 16.1% in 2015)
  • two-thirds (67.2%) of those living in cared-accommodation were women.

Definitions:

Older people - people aged 65 years and over.
Living in households - persons who reside in a private dwelling or self-care retirement village
Cared-accommodation - includes hospitals, nursing homes, aged care hostels and other cared-accommodation. For more information see the Glossary.

Disability in older people

Although the number of older people in Australia has increased, the prevalence of disability in this population has remained stable (49.6% of older people in 2018 compared with 50.7% in 2015). Among older Australians with disability:

  • 35.4% had a profound or severe limitation, similar to 2015 (36.4%)
  • 15.0% had a moderate limitation, similar to 2015 (14.0%)
  • 40.1% had a mild limitation, similar to 2015 (39.5%).
     

Most older people living in cared-accommodation had disability (96.1%). Among older Australians with disability living in cared-accommodation:

  • more than three-quarters (76.9%) were aged 80 years and over
  • almost all (97.9%) had a profound or severe limitation.

Definitions:

Disability - defined as any limitation, restriction or impairment which restricts everyday activities and has lasted, or is likely to last, for at least six months. For more information see the Glossary.

​​​​​​​Need for assistance

In 2018, among all older Australians, 38.0% (1.5 million people) needed assistance with everyday activities, similar to 2015 (38.6%). Older people were most likely to need assistance with:

  • health care (22.5%)
  • property maintenance (20.0%)
  • household chores (16.0%).
     

Overall, older women were more likely to need help with at least one activity (44.3%) compared with men (30.8%). Across all activities, older women reported a greater need for assistance than older men, especially with tasks such as:

  • mobility (17.8% of older women compared with 12.2% of older men)
  • property maintenance (23.9% of older women compared with 15.6% of older men)
  • household chores (21.1% of older women compared with 10.3% of older men).


Service use

Main long-term health conditions of older Australians

Housing and income of older Australians

Social and community participation

Carers

The 2018 SDAC showed that the number of carers has decreased to 2.65 million, down from 2.70 million in 2015.

In 2018:

  • around one in nine (10.8%) Australians provided unpaid care to people with disability and older Australians, down from 11.6% in 2015
  • 3.5% (861,600 people) of all Australians were primary carers - the carer who provided the most assistance to a person with disability (similar to 3.7% or 855,900 people in 2015)
  • around 1 in 11 carers (235,300 people) were under the age of 25, down from 274,700 in 2015.
     

Overall, females were more likely to be carers than males with 12.3% of all females providing care in 2018 (similar to 12.8% in 2015), and 9.3% of all males (down from 10.4% in 2015).

For more information on carers see the relevant Appendix.

Definitions:

Carer - a person who provides any informal assistance (help or supervision) to people with disability or older people (aged 65 years and over). Carers can be split into two groups:
Primary carer - a person aged 15 years and over who provides the most informal assistance to a person with disability for the core activities of mobility, self-care and communication.
Other carer - a person of any age who provides unpaid care with one or more of the core activity tasks but is not the main provider of informal care (i.e. not a primary carer); or a person who only provides assistance with non-core activities.

​​​​​​​All carers - age and sex

The rate of caring generally increased with age:

  • from 1.0% of those aged under 15 years to 19.7% of those aged 55 to 64 years
  • from the age of 65 years, the rate of women providing unpaid care declined (from 20.3% of those aged 65 to 74 years to 12.1% of those 75 years and over)
  • the rate of men providing unpaid care remained fairly consistent from 65 years of age (17.3% of those aged 65 to 74, and 19.0% of those 75 years and over).
     
  1. Living in households
     

​​​​​​​Primary carers

Primary carers are those who provide the most assistance to a person with disability with one or more of the core activities of mobility, self-care or communication. Their lives are often significantly impacted by their caring role. Much of the remaining analysis focuses on primary carers.

  • Among the 2.6 million carers, one-third (32.6%) were identified as primary carers
  • overall, women were 2.5 times more likely than men to be a primary carer (5.0% compared with 2.0%)
  • women represented seven in every ten primary carers (71.8%)
  • the average age of a primary carer was 54 years (51 years for carers overall and 50 years for other carers).
     
  1. Includes only persons living in households
  2. By definition, primary carers are aged 15 years and over
     

​​​​​​​Disability status of primary carers

Primary carers provide care to someone with disability, but can also be living with disability themselves.

  • Over one-third (37.4%) of primary carers had disability, twice the rate of non-carers (15.3%)
  • 44.3% of male primary carers had disability, compared with 35.0% of female primary carers
  • a similar proportion of male and female primary carers reported having a profound or severe limitation (7.2% of males and 6.8% of females)
     

See Glossary for more information on disability limitation/restriction severity levels.

​​​​​​​Primary carers - age and sex

The overall pattern across age for primary carers was similar to that for all carers, with the rate of primary carers increasing to the age of around 64 years:

  • 0.6% of those aged 15-24 years provided primary care compared with 7.1% of those aged 55-64 years
  • 6.7% of those aged 65-74 were primary carers while the rate declined to 5.3% of those aged 75 years and over.
     

Proportionally, there were more female primary carers in all but the youngest and oldest age groups. When considering the number of carers however, there were a greater number of female carers than male carers in all age groups with the exception of those aged 75 years and over, with some age groups having double the number of female carers compared with males. In particular there were:

  • 148,900 female primary carers aged 55-64 years, more than twice the number of male primary carers of the same age group (57,000)
  • 148,300 female primary carers aged 45-54 years, almost three times the number of male primary carers of the same age group (50,100).
     

​​​​​​​Recipients of care

The SDAC collects information about both the carer and recipients of care, allowing for comparison of this relationship, which varies with age.

In 2018, primary carers most commonly provided care to:

  • a spouse or partner (36.6%)
  • their child (27.1%)
  • a parent (26.2%).
     

In 2018, of all primary carers:

  • over half (54.8%) of those providing care to a spouse or partner were aged 65 years and over
  • the majority (88.1%) of those providing care to a child were female, almost half of which were aged between 25 to 44 years (48.5%)
  • almost two-thirds (64.9%) of those providing care to a parent were aged between 45 and 64 years.
     

​​​​​​​Living arrangements

The majority of primary carers (79.1%) resided in the same household as the person for whom they provided the most care. Of primary carers who did not live with their main recipient of care:

  • two-thirds (67.0%) were caring for a parent
  • a large proportion (64.6%) were aged between 45 and 64 years.
     

​​​​​​​Assistance provided

Carers provide help with both core and non-core activities (see Carers Appendix for detail). These activities can range from helping someone to eat or bathe, to helping them with their finances, health care or property maintenance.

​​​​​​​Core activities

In 2018, over half of all primary carers said they assisted or supervised the main person they cared for with the following core activities:

  • mobility tasks (74.0%)
  • self-care (56.5%)
  • communication (54.1%).
     

In terms of the specific mobility activities for which primary carers provided help:

  • two thirds (65.6%) helped the person they care for to move around when they were away from home
  • three in ten (28.7%) helped the person they care for to get in or out of a bed or chair.
     

Among primary carers who assisted with self-care activities:

  • two in five (41.5%) assisted with dressing (a decrease from 44.9% in 2015)
  • around one-third (35.8%) assisted with bathing and showering (similar to 36.8% in 2015)
  • around one in five (18.7%) provided assistance with toileting activities (similar to 18.5% in 2015).
     
  1. Primary carer may have provided more than one type of assistance
     

​​​​​​​Non-core activities

Nearly all primary carers (98.9%) helped the main person they cared for with non-core activities:

  • 85.9% assisted with transport, with three quarters (75.9%) driving the person for whom they cared to places away from home
  • 83.2% provided cognitive and emotional support (an increase from 79.4% in 2015). Most often, this referred to coping with feelings or emotions (75.9%).
     
  1. Primary carer may have provided more than one type of assistance
     

​​​​​​​Reasons for taking on a caring role

In 2018, the three most common reasons primary carers gave for taking on a caring role were:

  • a sense of family responsibility (70.1%) similar to 2015 (66.9%)
  • emotional obligation (46.6%) similar to 2015 (44.2%)
  • ability to provide better care than anybody else (46.4%) similar to 2015 (50.3%).
     

However, there was some variation, by age of care recipient, in terms of other common reasons given for taking on a caring role.

Among those who were primary carers to someone aged 65 years or over, over one-third (35.1%) said that no other friends or family were available to provide care compared with primary carers of recipients under 65 years of age (28.8%).

Among primary carers of those aged under 65 years, one-quarter (24.6%) said alternative care was too costly, compared with 17.2% of primary carers of people over 65 years.

  1. Proportions have been calculated using totals that exclude 'not stated' responses
  2. Respondents may have provided more than one reason for taking on caring role
     

The reasons for taking on a caring role also depended on the relationship a primary carer had to the main recipient of care:

  • three-quarters (78.6%) of those caring for a parent felt it was the responsibility of a family member to provide the care, compared with 71.5% of parents caring for a child and 66.8% of those caring for a spouse or partner
  • one-third (34.3%) of those caring for their child said they had no other choice, compared with 21.8% of those caring for a spouse or partner and 14.4% of those caring for their parent.
     
  1. Proportions have been calculated using totals that exclude 'not stated' responses
  2. Respondents may have provided more than one reason for taking on caring role
     

Employment

In 2018, among carers aged 15-64 years (living in households):

  • seven in ten (70.9%) were in the labour force, similar to 2015 (70.8%)
  • primary carers were less likely to be in the labour force (58.8%) than other carers (76.6%) and non-carers (81.5%)
  • carers were less likely to be employed (66.6%) than non-carers (77.4%)
  • 71.8% of all male carers were employed, compared with 63.2% of all female carers.
     

Of primary carers of working age (15-64 years), 55.5% were employed; however, employment status varied with the hours of care per week that a primary carer was providing:

  • less than one-third (28.6%) of primary carers providing more than 40 hours of care a week to their main recipient were employed
  • in comparison, over half (52.8%) of those caring for the main recipient for less than 20 hours of week were employed.
     

Income of carers

Social and community participation of primary carers

Autism in Australia

In 2018:

  • there were 205,200 Australians with autism, a 25.1% increase from the 164,000 with the condition in 2015.
  • males were 3.5 times more likely than females to have the condition, with prevalence rates of 1.3% and 0.4% respectively.
     

​​​​​​​What is autism?

Autism is a developmental disorder which affects how a person communicates and relates to other people. It is a lifelong condition (Endnote 1). Autism can be characterised by difficulty in social communication; difficulty in social interaction; and restricted or repetitive behaviours and interests (Endnote 2).

Autism may present substantial challenges for those affected, their families and friends. As noted above, the condition is lifelong, although the social, communication and sensory deficits that some experience may be remediated with the use of intervention therapies and structured support. Autism spectrum disorders are diagnosed on the basis of behavioural and developmental criteria (Endnote 3).

This article uses results from the 2018 Survey of Disability, Ageing and Carers (SDAC) to present an updated analysis of the prevalence of autism in Australia, and the impact the condition has on the everyday lives of those affected by the condition.

Throughout the article, ‘autism’ and ‘autism spectrum disorders’ are used to denote conditions including autism spectrum disorder, Asperger’s Syndrome, Pervasive Developmental Disorder – Not Otherwise Specified, Rett Syndrome and Childhood Disintegrative Disorder. Descriptions of these disorders can be found in the Diagnostics and Statistics Manual of Mental Disorders (DSM) IV-TR and the DSM 5.

​​​​​​​Does prevalence change with age?

There is variation in the prevalence of autism across age groups, with a marked drop off commencing in the late teens. Data are not presented in any detail for people aged over 40 years because the identified prevalence rates are too low for reliable estimates to be produced.


There are several possible reasons for the variation in autism prevalence across the lifespan between the 2015 and 2018 SDACs. These reasons are explored in the ‘Understanding autism prevalence’ section of this article.

​​​​​​​Autism and education

School is an important social environment where children learn to interact with their peers, a task people with autism may find difficult. An appropriate school environment can provide opportunities to develop important social and life skills. Many children on the autism spectrum struggle socially, needing additional support throughout their education.

In 2018, 92.3% of young people (101,900) aged 5 to 20 years on the autism spectrum attending school had some form of educational restriction (92.3%), including a small number who were unable to attend school because of their disability. Two in five (40.8%) of the children attended a special class in a mainstream school or a special school.

Of the 106,600 young people (aged 5 to 20 years) with autism who were attending school or another educational institution, 77.7% reported experiencing difficulty at their place of learning. Of those experiencing difficulties, the main problems encountered were fitting in socially (59.8%), learning difficulties (55.3%) and communication difficulties (51.5%).

  1. Living in households
     

Young people (aged 5 to 20 years) with autism may need a high level of support to participate in their education. In 2018, two in five (40.4%) young people with autism needed special tuition and 32.0% needed help from a counsellor or disability support person, while more than one in four (28.5%) did not receive any additional assistance (excluding attending a special school or special classes in a mainstream school).

Almost half the young people with autism aged 5 to 20 years (45.9%) indicated they needed more support or assistance at school then they were receiving.

People with autism are less likely than others to complete an educational qualification beyond school and have needs for support that differ from people with other disabilities. Of those with autism, 8.1% had a bachelor degree or higher, compared with 16.1% of those with a disability and 31.2% of those without disability. All people with disability and those with no disability were also more likely to have an Advanced Diploma, Diploma or Certificate III or IV than people with autism.

  1. Living in households
     

​​​​​​​Autism and work

Participation in the workforce is important for social inclusion and economic independence, but people with autism spectrum disorders may encounter barriers to entering the labour market.

The labour force participation rate was 38.0% among the 94,600 people of working age (15-64 years), living with autism spectrum disorders. This is compared with 53.4% of all working age people with disability and 84.1% of people without disability.

The unemployment rate for people with autism spectrum disorders was 34.1%, more than three times the rate for people with disability (10.3%) and almost eight times the rate of people without disability (4.6%).

​​​​​​​Severity of disability

In 2018, among all people with autism, 68.9% (141,400) reported having a profound or severe core activity limitation, that is, they need help or supervision with at least one of the following three activities: communication, self-care and mobility.

Almost half (44.1%) of all people with autism had a profound or severe communication restriction. This indicates they needed assistance at least some of the time to understand or be understood by others, for example they may communicate more effectively using sign language or other forms of non-verbal communication.

Similarly, one in two (50.9%) of all people with autism had a profound or severe mobility restriction, indicating that they needed help or supervision to move around.

Just over one third (36.0%) of all people with autism had a profound or severe self-care limitation, indicating they need support or supervision with dressing, bathing, eating or toileting.

​​​​​​​What assistance with everyday activities do people with autism need?

People with autism may need assistance with a range of activities, with the highest level of need being in the areas of cognitive and emotional support and mobility.

Additionally, the frequency with which people with autism needed assistance was high, with 125,200 (61.0%) needing assistance with at least one activity on a daily basis. About two in five people (39.2%) needed assistance with cognitive and emotional tasks at least once a day, while three in ten needed assistance with self-care (30.9%) and mobility (33.2%). For a description of what tasks are included in each of these activities, please see the Glossary.

​​​​​​​What assistance with everyday activities do people with autism receive?

People with autism may receive assistance from a range of providers depending on their needs.

Notably, the bulk of care was provided by informal carers (relatives or friends), in the core activity areas of self-care, mobility and communication. The graph below shows the proportion of all people with autism who received assistance with at least one of the core activities by the source of that assistance.

  1. Living in households
     

​​​​​​​Unmet need for assistance

The 2018 SDAC found that of the people with autism who required assistance (170,100) many did not receive some or all of the assistance they needed, with over half (51.7%) indicating they needed more help with at least one activity. The unmet need for assistance was highest for cognitive and emotional support (61,000 people), communication (30,100) and mobility (21,700).

Understanding autism prevalence

This section examines factors which may have influenced the number of people identified as having autism between the 2015 and 2018 SDAC, and the changes in estimated prevalence of autism across age groups.

​​​​​​​Why does autism prevalence change with age?

As noted above, the 2018 SDAC estimated there were 205,200 people with autism, 25.1% more that the number estimated in the 2015 SDAC (164,000).

The 2018 SDAC estimated higher prevalence rates among children and younger people, but much lower rates among older people (see the first graph). This pattern of incidence by age group mirrors that recorded by the 2015 SDAC, indicating that for both surveys there were age-related factors influencing identification of people with these conditions.

Has the way in which autism is diagnosed changed over time?

The criteria used to clinically diagnose autism have been subject to some variation over time and this may have impacted the reported prevalence of autism in Australia. One of the key tools used as the basis for clinically diagnosing autism is the DSM as it describes diagnostic criteria clinicians can use in determining which mental and behavioural disorders people might have.

Changes to the DSM over time that relate to autism have been significant. The first two versions of the DSM (DSM (I) and DSM (II)) indicated that children with behaviours and/or characteristics symptomatic of autism should be classified as having ‘childhood schizophrenia’.

Diagnostic criteria explicitly for autism were added for the DSM (III), released in 1980. These criteria were then amended for the DSM III (Revised), released in 1987 and revised again in the DSM IV, released in 1994.

Changes to the DSM have impacted the amount of detail considered in diagnosing autism and the number of criteria that need to be met for a diagnosis to be made and these changes may have been a factor influencing diagnosis rates, alongside enhanced understanding of the condition among clinicians.

The changes to the DSM that were made in 1994 would have had a significant impact on diagnosis rates, and this correlates with the fact that the majority of identified cases are among those people who were born after this date (i.e. under 25’s).

Refinements to the DSM continue, with DSM 5 released in 2013. Changes to the criteria in DSM 5 have likely influenced reported autism rates (Endnote 4).

Changes in the DSM are likely to have significantly impacted the number of people clinically diagnosed with autism over time, and can provide an insight into the decrease in prevalence by age.

Does the survey contribute to the observed change in prevalence across the life span?

The design of the SDAC may also influence the observed drop in autism prevalence as people age. The first stage of the SDAC interview, in which it is identified whether there is a person with disability living in the household, is asked of the first responsible adult with whom the interviewer makes contact. In instances where a child is living at home with their parents, it is more common for a parent to provide the responses to these questions. However, when people are in their late teens and start moving out of home, they will be more likely to answer these questions for themselves and this may affect their propensity to identify as living with autism, although the exact level of this impact is unknown.

It should be noted there were no changes in the questionnaire between the 2015 and 2018 surveys that would have impacted on the likelihood of a person being identified as having autism.

What else might be impacting on the drop in autism prevalence with age?

There are other factors that may also be impacting on the change in prevalence with age. People may learn coping strategies as they mature and no longer feel they are restricted in any of the areas of limitation considered in the SDAC. Similarly, intervention therapies may effectively remediate the challenges of autism for some, allowing them to function without experiencing limitations in their everyday activities.

It is also possible that people are less likely to identify a child as having autism as they get older because there is some sensitivity around the issue, either for the person or for the other family members.

There is some evidence indicating there is another reason there are far fewer older people with autism than young people. Research in a small number of countries, including Australia (Endnote 5), suggests people with autism have a substantially lower life expectancy than the rest of the population.

While each of these factors described above may have had an impact on the reported prevalence rates, it is not possible to quantify the size of the influence they may have had. It should be noted the growth seen in autism prevalence in the 2018 SDAC is consistent with growth in prevalence observed by other sources.
 

Bibliography

Children with disability

Many Australian children are affected by disability. These disabilities can impact a child's health, communication, mobility or learning which can have profound effects on the child's social engagement and education. For primary carer parents and their families, raising a child with disability can have significant effects on many aspects of family life. This article focuses on children aged under 15 years and living in households.

In 2018,

  • 357,500 or 7.7% of children under 15 were reported as having disability
  • the proportion of children with disability increased from 6.9% (295,900) in 2012.

Definitions:

Disability - any limitation, restriction or impairment which restricts everyday activities and has lasted, or is likely to last, for at least six months. For more information see the Glossary.

​​​​​​​Age and sex

The prevalence of disability increased with age, from 3.7% of children aged 0-4 years to 9.6% of those aged 5-14 years.

Boys were more likely than girls to have disability (9.6% or 230,100 boys compared with 5.7% or 128,700 girls). This was also reflected in the different age groups, with 4.8% of boys (38,100) in the 0-4 year age group reporting disability compared with 2.7% of girls (20,200); while 11.9% of boys (189,300) aged 5-14 years reported disability compared with 7.1% of girls (107,700).

  1. Living in households


Children in inner regional areas were more likely to have disability than children in major cities (10.4% or 80,400 compared with 7.0% or 239,700). However, boys in inner regional areas were twice as likely as girls in inner regional areas to have disability (13.5% or 52,800 boys compared with 6.6% or 25,100 girls).

Severity of disability

Of all children, 4.5% (209,300) had profound or severe disability and 1.6% (72,800) had moderate or mild disability. Boys were twice as likely as girls to have profound or severe limitations (6.0% or 143,800 compared with 3.0% or 67,200).

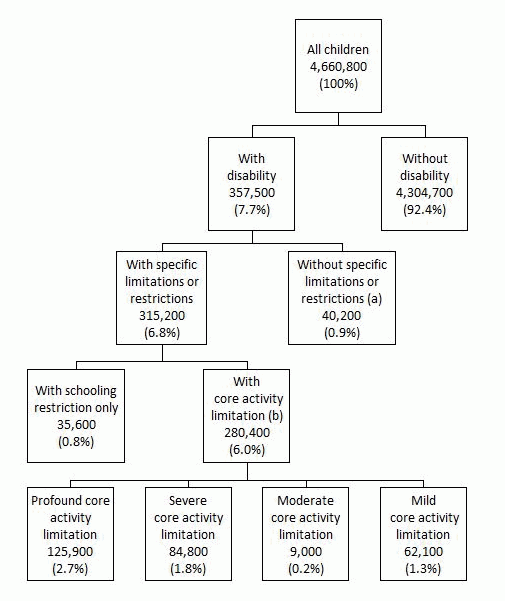
Conceptual framework: children living in households aged 0-14 years. 2018

Children living in households aged 0-14 years. 2018

Definitions:

Profound limitation - greatest need for help, that is, always needs help with at least one core activity
Severe limitation - needs help sometimes or has difficulty with a core activity
Moderate limitation - no need for help but has difficulty
Mild limitation - no need for help and no difficulty, but uses aids or has limitations
Restriction (education) - difficulty participating, needs assistance from another person or uses an aid or equipment in schooling.
Limitation - a person has a limitation if they have difficulty, need assistance from another person, or use an aid or other equipment to perform one or more core activities (communication, mobility and self-care). ) For more information on the terms used, refer to the Glossary and appendices associated with this publication.

Image shows:
All children: 4,660,800 (100%), made up of:

  • All children without disability: 4,304,700 (92.4%)
  • All children with disability: 357,500 (7.7%), comprising Children with disability without specific limitations or restriction: 40,200 (0.9%) and Children with disability with specific limitations or restrictions 315,200 (6.8%).
  • This Children with disability with specific limitations or restrictions group(a) (40,200 (0.9%)) comprises Children with disability with schooling restriction only: 35,600 (0.8%) and Children with disability with core activity limitation(b): 280,400 (6.0%).
  • The Children with disability with core activity limitation(b) group (280,400 (6.0%)) comprises Children with disability with profound core activity limitation: 125,900 (2.7%), and Children with disability with severe core activity limitation: 84,800 (1.8%), and Children with disability with moderate core activity limitation: 9,000 (0.2%), and Children with disability with mild core activity limitation: 62,100 (1.3%).
     

Disability groups

Need for and receipt of assistance

Schooling

Impact of caring on parents

Post release changes

Show all

Data downloads

Disability tables

Older people tables

Carers tables

New South Wales

Released 05/02/2020

Victoria

Released 05/02/2020

Queensland

Released 05/02/2020

South Australia

Released 05/02/2020

Western Australia

Released 05/02/2020

Tasmania

Released 05/02/2020

Australian Capital Territory

Released 05/02/2020

Data item list

Released 04/11/2019

Long term health conditions ICD-10

Autism in Australia

Released 29/11/2019

Children with disability

Released 10/12/2019

Use of information technology

Released 21/07/2020

Disability and the labour force

Released 24/07/2020

Dementia in Australia

Released 31/07/2020

2018 SDAC SA2 modelled estimates

Released 10/09/2020

2018 SDAC LGA modelled estimates

Released 10/09/2020

All data cubes

Survey material

4430.0 - Household questionnaire

Prompt cards for household questionnaire

To view the Cared-accommodation Questionnaire click here

Previous catalogue number

This release previously used catalogue number 4430.0

Back to top of the page