This publication should be considered experimental, as improvements to methods and new data sources continue to become available. The ABS will be seeking input from key stakeholders with the intention of addressing issues and concerns in future updates.
Overview
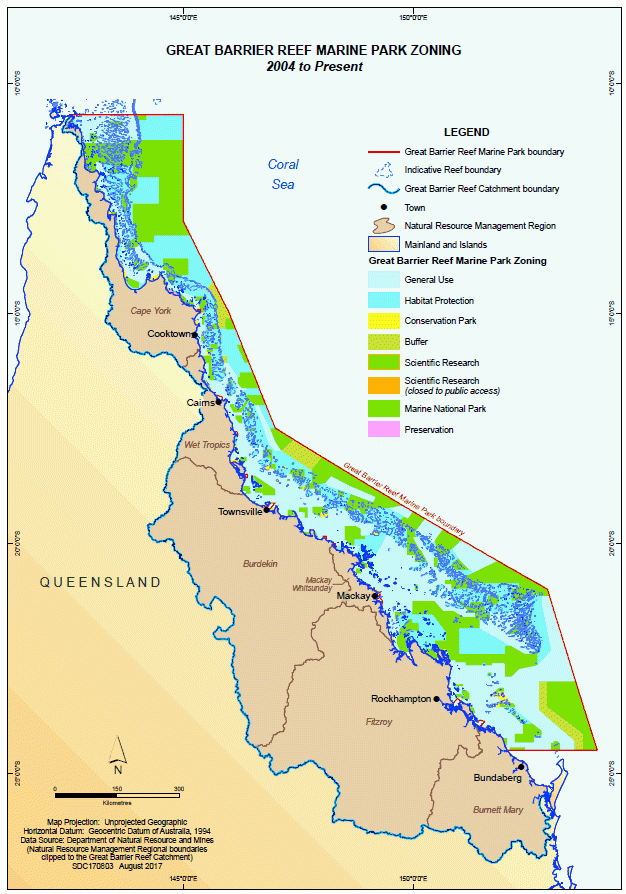
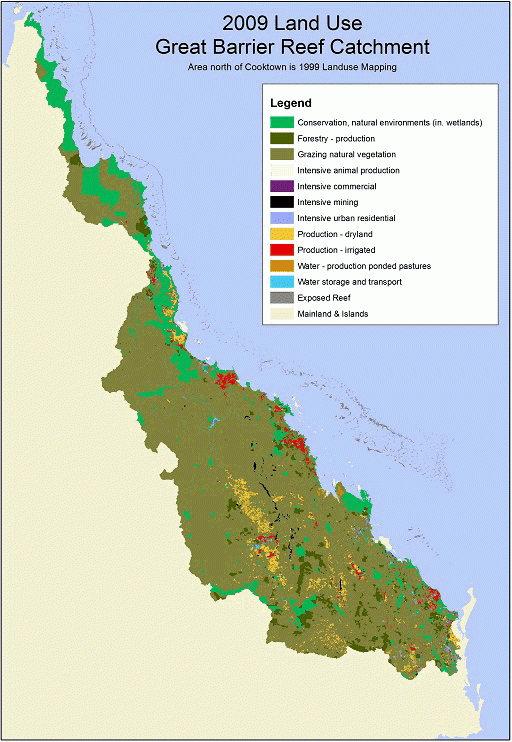
The Great Barrier Reef (GBR) is a globally significant area located in the Coral Sea off the coast of Australia. It extends for more than 2,300 kilometres along the north-eastern coast near the Australian state of Queensland. It is the world’s largest coral reef ecosystem and is listed on the register of World Heritage sites. The terrestrial (Great Barrier Reef Catchment Area) and marine (the Reef) ecosystems provide a number of benefits to humans through the generation and use of ecosystem services. The GBR Region consists of the GBR Marine Park along with the GBR Catchment Area, made up of six Natural Resource Management Regions (NRMRs), including Burdekin, Burnett Mary, Cape York, Fitzroy, Mackay Whitsunday and Wet Tropics.
Table 1. NRMR profiles, GBR region, 2011-2016
| NRMR Catchment Area | 2011 | 2016 | |||||
|---|---|---|---|---|---|---|---|
| Total Population | Population density | Aboriginal and Torres Strait Islander People % | Total Population | Population density | Aboriginal and Torres Strait Islander People % | ||
| sq km | ’000 | Person per sq km | % of total | 000’ | Person per sq km | % of total | |
| Burdekin | 135 251 | 222.1 | 1.6 | 7.1 | 232.6 | 1.7 | 7.9 |
| Burnett Mary | 55 612 | 301.1 | 5.4 | 3.7 | 316.9 | 5.7 | 4.4 |
| Cape York | 101 721 | 13.8 | 0.1 | 54.9 | 15.4 | 0.2 | 55.4 |
| Fitzroy | 157 834 | 227.8 | 1.4 | 4.8 | 235.5 | 1.5 | 5.6 |
| Mackay Whitsunday | 9 264 | 131.5 | 14.2 | 4.1 | 136.7 | 14.8 | 4.8 |
| Wet Tropics | 20 861 | 237.4 | 11.4 | 10.2 | 253.3 | 12.1 | 10.1 |
| Total GBR Region | 480 559 | 1 133.6 | 2.4 | 6.6 | 1 190.4 | 2.5 | 7.2 |
NRMRs are meshblock approximations of the Department of the Environment and Energy's Natural Resource Management regions to align with Australian Statistical Geography Standard.
Source: Terrestrial Extent and Condition section, 2011 Census of Housing and Population and 2016 Census of Housing and Population.
This publication uses the System of Environmental-Economic Accounting: Experimental Ecosystem Accounting (SEEA-EEA) international framework to integrate and track changes for complex biophysical data, economic data and other human activity. As an example, a key finding of this publication is the determination of ecosystem services input and tourism rent using a resource rent methodology. These estimate the value an ecosystem contributes to production after human inputs (such as labour, taxes, capital costs) are accounted for. Ecosystem services inputs were calculated for the Agriculture, Forestry, Fishing and Aquaculture industries and tourism rent was calculated for tourism activity.
Condition summary
A summary of the condition of the GBR Region from 2007-08 to 2014-15 is shown in Table 2.
Table 2. Ecosystem condition summary, GBR region, 2007-08 to 2014-15
| Units | 2007-08 | 2008-09 | 2009-10 | 2010-11 | 2011-12 | 2012-13 | 2013-14 | 2014-15 | ||
|---|---|---|---|---|---|---|---|---|---|---|
| Marine condition (inshore) | ||||||||||
| Coral (a) | Score | 47 | 48 | 47 | 43 | 38 | 39 | 40 | 44 | |
| Seagrass (a) | Score | 35 | 33 | 28 | 21 | 19 | 28 | 34 | 33 | |
| Water Quality (a) | Score | 47 | 44 | 44 | 31 | 37 | 37 | 34 | 43 | |
| Climate | ||||||||||
| Mean annual sea surface temperature (b) | Degrees Celsius | 24.7 | 25.0 | 25.7 | 24.5 | 24.9 | 25.1 | 24.9 | 25.2 | |
| Mean annual sea surface temperature anomaly (b) | Degrees Celsius | -0.27 | 0.30 | 0.53 | -0.38 | -0.16 | 0.12 | -0.11 | 0.24 | |
| Mean annual rainfall | mm | 1 070 | 1 090 | 946 | 1 633 | 1 100 | 903 | 869 | 760 | |
| Pollutant Loads in selected monitored areas (c) | ||||||||||
| Total Suspended Solids | Kilotonnes | 18 788.0 | 12 639.0 | 6 889.8 | 19 647.0 | 5 532.0 | 9 559.0 | 1 243.3 | 2 074.6 | |
| Total Nitrogen | Kilotonnes | 57.6 | 36.9 | 29.3 | 101.0 | 27.5 | 33.7 | 10.1 | 8.9 | |
| Total Phosphorus | Kilotonnes | 16.2 | 9.2 | 9.2 | 32.0 | 7.7 | 9.3 | 1.5 | 2.5 | |
a. Marine condition scores were sourced from the Reef Water Quality Protection Plan, Great Barrier Reef Report Card series (2015 issue).
b. Mean annual sea surface temperature and mean annual sea surface temperature anomaly are reported in calendar years from 2008 to 2015. These measures were sourced from the Bureau of Meteorology, eReefs Marine Water Quality Dashboard, Commonwealth of Australia.
c. Pollutant loads were sourced from the Department of Science, Information Technology and Innovation, Queensland Government.
