Fitzroy NRM region

Released
21/08/2017

The Fitzroy Natural Resource Management (NRM) region is the largest NRM region by area in the Great Barrier Reef (GBR) Region. Fitzroy covers most of what is often known as Central Queensland. The principal city is Rockhampton, with Gladstone and Emerald as other major cities. It covers approximately 15.8 million hectares, and had a population of 227,800 people in 2016. Fitzroy is the largest river catchment within the GBR Region - all water run-off flows into the Fitzroy River and eventually into the GBR lagoon. A marine extension of the Fitzroy NRM region is also defined by the Great Barrier Reef Marine Park Authority, marking the marine area of the Great Barrier Reef most closely associated with the Fitzroy NRM region.

Agriculture and Mining are key industries in the Fitzroy NRM region. Agriculture derives benefits from ecosystem services. Ecosystem accounting provides a framework to measure changes in ecosystem condition, ecosystem services and ecosystem assets in both physical and monetary terms. This feature article presents a summary set of ecosystem accounts for the Fitzroy NRM region, including; a land cover account; a marine condition summary; and provisioning services for the agriculture, fishing and aquaculture industries. It demonstrates some of the ways in which more detailed integrated information can be utilised from these GBR accounts.
Land cover

Land cover affects the provision of ecosystem services over time and is critical to evaluating and monitoring trends in natural resources. Changes in land cover have many potential drivers, including human activities and natural phenomena. Examples of human activities that drive land cover change include urban development, crop and pasture management and industrial activity. Natural drivers of land cover change include flood events, bushfires and seasonal climatic variation.

In 2014-15 ‘Trees’ covered the largest area the Fitzroy with 7.8 million hectares (49%), followed by ‘Grasslands’ and ‘Rainfed lands’, accounting for 6.1 million hectares (39%) and 1.5 million hectares (10%), respectively. Out of the six NRM regions, Fitzroy had the greatest amount of ‘Rainfed Pastures’ with 43% of total ‘Rainfed Pastures’ in the entire GBR Region. Land use data by area and value were not available at an NRM region level but are available at GBR level in Land Account: Queensland, Experimental Estimates, 2011 - 2016 (cat. no. 4609.0.55.003) (Land Account), which featured an article, Accounting for Land Changes in the Great Barrier Reef.

Land cover data also shows evidence of the high levels of rainfall, discussed below, in 2010-11. The area covered by 'Waterbodies' was lower in 2014-15 than in the high rainfall and flood event year of 2010-11. The Wetlands land cover category, which includes both flood plains and wetland areas, recorded a large decrease, however this was mainly due to the 2010-11 period experiencing floods. A similar story applies to the decrease in the land cover of Trees, reflecting changes from a wet, green period in 2011 to the drier 2015 period. The scope of the land cover component of the Land Account only covers the period between 2010-11 to 2014-15.

Table 1. Dynamic land cover account broad definitions, Fitzroy NRM region, 2010-11 and 2014-15

 Opening stock 2010-2011Total Net ChangeClosing stock 2014-2015
Urban Areas & Extraction Sites (a)76 294-76 294
Waterbodies55 944-2 78153 163
Wetlands (b)143 475-28 694114 781
Irrigated Lands40 769-8 58132 188
Rainfed Lands1 651 256-135 6431 515 613
Grasslands5 904 244209 6196 113 863
Woody Shrubs32 8507 35040 200
Trees7 829 700-41 2697 788 431
No Data48 894-48 894

- nil or rounded to zero (including null cells)
a. Urban Areas & Extraction Sites is a static land cover type. These classes show no changes over time.
b. 'Wetlands' includes flood plains and wetlands

Marine condition and river loads

Marine condition in the Fitzroy NRM region extension area of the Great Barrier Reef Marine Park has been generally declining since 2006-07. A key event for Fitzroy during this period was the extremely high rainfall year of 2010-11 which, along with floods and the expanded waterbodies mentioned above, saw water discharge into the GBR lagoon rise to 38,537 GL. This discharge was nearly four times the level of any other individual year in this period, over four times the average for the period, and more than forty times the discharge seen in the driest recent year of 2005-06. The discharge is also, naturally, associated with elevated loads of pollutants flowing into the Reef lagoon.

The near doubling of regional rainfall in 2010-11 caused larger increases in river discharge.

This flooding event impacted marine condition from 2010-11 into subsequent years. The impact can be shown in water quality, coral condition and seagrass (Fig 1). In 2010-11, water quality fell immediately, then in 2011-12 coral and seagrass condition was impacted. Water quality has improved slightly since 2012-13, due to low levels of disturbance and less rainfall. Agricultural activity across the period, as discussed below, does not appear to have been strongly impacted by the extreme rainfall and flooding event, with cattle and crop production remaining fairly similar to proceeding and subsequent years,

Regulatory ecosystem services

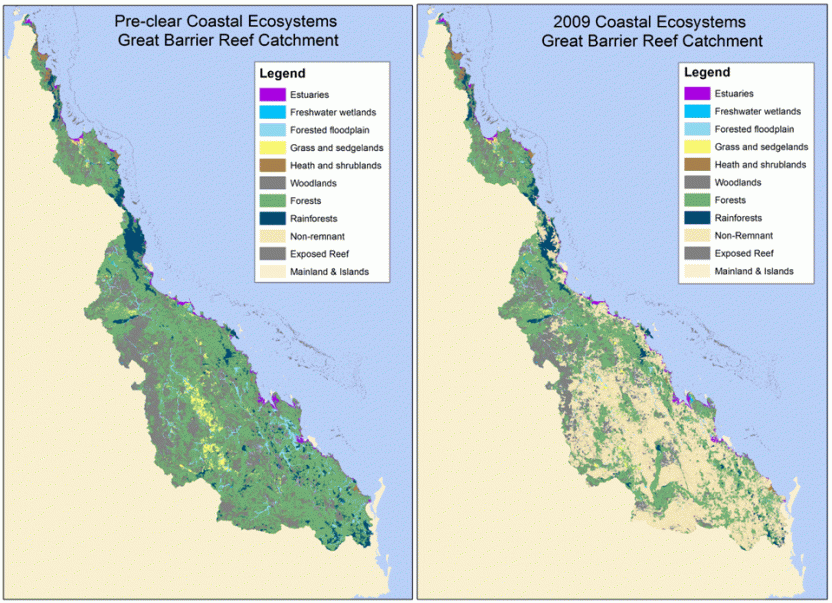
Compared with its pre-European condition, the Fitzroy NRM region landscape has a reduced capacity to provide regulatory services including erosion protection, water quality and purification, water regulation and hazard reduction. Changes in capacity arise from both changes in the extent and types of coastal ecosystems (estuaries, woodlands, etc.) and land use (conservation, urban areas, production grazing, sugar etc.) taking place within each NRM region.

Table 2. Indicator for capacity of landscape to provide regulating services, Fitzroy NRM region, pre-clear score and 2009

 Pre-clear (Pre-European)2009Change
 scorescore%
Erosion protection services3.02.0-33
Water quality/purification2.92.2-24
Water Regulation3.81.9-50
Hazard Reduction3.62.0-44

As per land cover data above, in the Fitzroy region, about 10% of land was covered by rainfed and irrigated agricultural land. However, in addition to this, a large share of other land such as grasslands and tree-covered areas were also subject to grazing, and Figure 4 below shows that much of the Fitzroy basin is classified as non-remnant vegetation, which is associated with reduced regulatory services in comparison to a natural state.

Source: Great Barrier Reef Marine Park Authority

Figure 4 - Coastal ecosystems within GBR region, pre-European score and 2009

Figure 4. Coastal ecosystems within GBR region, pre-European score and 2009
Image of two comparative maps showing the Coastal ecosystems within GBR region, pre-European score and 2009. The first image on the left shows the Pre-clear Coastal Ecosystems, Great Barrier Reef Catchment area and depicts the Estuaries, Freshwater wetlands, Forested floodplain, Grass and sedgelands, Health and shrublands, Woodlands, Forests, Rainforests, Non-remnant, Exposed Reef, Mainland and islands. The second image on the right shows the 2009 Coastal Ecosystems, Great Barrier Reef Catchment and depicts the Estuaries, Freshwater wetlands, Forested floodplain, Grass and sedgelands, Health and shrublands, Woodlands, Forests, Rainforests, Non-remnant, Exposed Reef, Mainland and islands. Source: Great Barrier Reef Marine Park Authority

Agriculture

One of the key industries that derive benefits from ecosystem services in the GBR Region is Agriculture. The Fitzroy NRM region is one of the primary locations within the Great Barrier Reef Catchment Area for agricultural activity so is a key case study for the size and health of the Agriculture industry. Land cover data shows that Fitzroy accounts for 42% of the total amount of pastures for grazing within the GBR Region. This grazing land accounts for 74% of all agricultural land cover in the Fitzroy NRM region.

The Fitzroy ecosystem provides a number of benefits to the population through provision of ecosystem services to agriculture and fishing production. These inputs play a key role in employment and food and materials production, in conjunction with man-made inputs such as labour and capital.

Fitzroy agriculture is predominantly based on livestock. It is the main hub for meat production throughout the entire GBR Region. Cattle meat production in 2014-15 was an estimated $1,285 million, which is 54% of the total value of cattle meat production within the GBR Catchment Area. Other agricultural commodities make up a smaller share of production value in Fitzroy, with the most significant of these being broadacre crops less sugar and cotton, with production of $236 million in 2014-15.

Agriculture can also place pressure on the Reef via its contribution to runoff. As such, economic activities such as grazing, sugarcane growing and horticulture are key components of the Reef Water Quality Protection Plan which aims to reduce pollutant runoff. For example, note that Fitzroy had the highest amounts of total suspended solids (fine sediment) and tebuthiuron runoff in the GBR Region in 2014-15. Tebuthiuron is a toxic herbicide commonly used to control weeds in the grazing industry. The amount of tebuthiuron load runoff in Fitzroy peaked in 2010-11. The Fitzroy region also reported the highest levels of the pesticide atrazine for the majority of the reference period.

The peak rainfall year and flooding event of 2010-11 does not appear to have increased production of meat cattle and broadacre crops in 2010-11, relative to other years during the period. Rather, production appeared to increase more noticeably the following year (2011-12). This suggests that the relationship between agricultural production and runoff impacts on marine condition may be related in timing to peak rainfall events, rather than to production peaks.

Table 3. Production and value of selected agriculture commodities, Fitzroy NRM region, EVAO 5,000, (2007-08 to 2014-15)

 Unit2007-082008-092009-102010-112011-122012-132013-142014-15
Broadacre crops (a)
 Tonnes785 586.5729 023.5579 439.8606 484.5685 757.3684 169.7715 012.9702 306.4
 $m259.2173.7159.8162.7175.1224.9243.9235.9
Sugar
 Tonnes39 576.041 167.097 814.0135 355.0103 952.149 290.4110 693.068 356.2
 $m1.11.34.45.14.62.04.42.8
Horticulture
 Tonnes17 045.143 181.221 552.325 811.413 624.525 807.629 901.235 687.1
 $m40.246.861.843.128.366.662.361.3
Meat cattle (b)
 Tonnes252 850.2216 042.2214 787.3204 967.3234 993.7260 225.9325 376.7314 968.2
 $m811.2724.6676.9671.9769.1809.51 075.91 285.4
Other livestock products (c)
 Tonnes13 290.110 168.018 941.114 763.112 715.927 657.927 400.036 034.9
 $m16.115.333.219.219.029.242.436.3
Total food production
 Tonnes1 108 347.81 039 582.0932 534.5987 381.41 051 043.51 047 151.41 208 383.81 157 352.8
 $m1 127.8961.7936.1902.0996.01 132.11 428.91 621.6
Total agricultural materials production
 Tonnes86 131.3142 254.980 007.9114 504.4122 373.0129 820.2164 723.4127 104.7
 $m45.283.780.1100.4143.694.5115.879.4

EVAO (Estimated Value of Agricultural Operations) - refers to the scope of data collection for the estimates
a. Broadacre crops excludes sugar and cotton
b. Meat cattle includes calves
c. Other livestock products includes, pig meat, sheep meat, poultry meat, poultry eggs & cow milk.
Some of the physical estimates are modelled, refer to the Explanatory Notes for more details
Agricultural materials production quantity excludes cut flowers, nurseries and cultivated turf.
2007-08 estimates exclude poultry eggs.
Some of the physical estimates are modelled, refer to the Explanatory Notes for more details.

Fisheries

Fisheries production in the Fitzroy NRM region marine extension was 1,474 tonnes in 2015-16. Fitzroy exhibits the same post-2004 decline in fisheries catch as the GBR Marine Park as a whole, where catch in 2006-07 was just 59% of the catch in 2003-04. A change in zoning, licence buyouts, and quota implementations in 2003 and 2004 had a direct impact on fishing production and value in the Fitzroy region as it did in the rest of the GBR Marine Park. Other drivers of reduced fishing activity in the GBR Region as a whole since 1999 have included; changes to management arrangements in the Trawl and Reef Line fisheries; implementation of net-free areas; the high value of the Australian dollar reducing export profits; higher fuel prices; cheap imported seafood competing with local product; the higher salaries in Mining industry for mechanically skilled staff; and an ageing workforce with fewer new fishers entering commercial fishing than older fishers retiring.

Table 4. Fishing industry production and licences, Fitzroy NRM region marine extension and GBR region (2000-01 to 2015-16)

NRM RegionUnit2000-20012003-20042006-20072009-20102012-20132015-2016
Fitzroy
 Tonnes3 387.13 541.32 096.32 121.51 938.61 474.3
 Licences517470316317284284
Total GBR Region
 Tonnes15 009.515 461.611 094.311 524.79 837.28 259.2
 Licences1 5191 3921 029984863860

Production is the total harvest wild fish caught
 

However, in addition to this large and observable regulatory step-change, fisheries production in 2015-16 was still substantially lower than in 2009-10 or earlier years. This may reflect either productivity decline or continued regulatory tightening, as the number of licenses with access to the Fitzroy NRM region marine extension also continued to decline, and the tonnage caught per licence also declined.

For more detail on fisheries, please see the Fishing and Aquaculture section of this publication.

Employment

The most significant employers in the Fitzroy NRM region include the Mining, Construction, Retail Trade and Manufacturing industries. The industry with the highest employee earnings in 2011-12 was Mining, which was 17% of all employee payments and accounted for about 8.4% of all jobs. Many of these jobs were held in the short term or concurrently with other jobs.

Data on employment by industry in this chapter is sourced from the experimental Employee Earnings and Jobs dataset discussed in the Information Paper: Construction of Experimental Statistics on Employee Earnings and Jobs from Administrative Data, Australia, 2011-12 (cat. no. 6311.0), published by the ABS in 2015. This dataset was used to produce estimates covering numbers of jobs, earnings totals and multiple job holders. Further data will become available with the October 2017 release of 2016 Census data, which will contain a range of employment statistics, including industry and occupation dimensions.

Table 5. Number of jobs and gross payments to employees, Fitzroy NRM region, 2011-12

 Total gross payments to employees, all jobs, 2011-12,Total number of jobs,Percentage of gross payments to employees in regionPercentage of all jobs in region
Industry$m'000s%%
Agriculture, forestry and fishing70.83.61.12.3
Mining1 092.413.116.98.4
Manufacturing666.712.010.37.7
Electricity, gas, water and waste services210.82.83.31.8
Construction815.515.912.610.2
Wholesale trade262.66.44.14.1
Retail trade343.314.75.39.4
Accommodation and food services158.811.42.57.3
Transport, postal and warehousing482.38.87.55.6
Information media and telecommunications23.60.80.40.5
Financial and Insurance Services93.93.61.52.3
Rental, hiring and real estate services108.73.41.72.2
Professional, scientific and technical services469.19.07.25.8
Administrative and support services264.810.84.16.9
Public administration and safety356.98.35.55.3
Education and training427.412.26.67.8
Health care and social assistance412.712.16.47.8
Arts and recreation services12.51.20.20.8
Other services178.45.32.83.4
Unknown19.20.70.30.4

Although a major land user, the agriculture industry in the Fitzroy NRM region appears not to be one of the most significant industries for employment. In 2011-12, gross agricultural production of at least $1.1 billion led to gross payments to employees in Agriculture, Forestry, and Fisheries of about $71 million. Note that other income accruing to workers (for example, cash in hand) and income accruing to farm owners will not have been reported on Pay-as-you-go tax forms and is therefore outside the scope of these estimates.

A significant part of the agricultural supply chain is the Food Product Manufacturing industry within the Manufacturing industry. In the case of the Fitzroy, with agricultural activity being mostly cattle grazing, this means many workers will be employed within Meat and Meat Product Manufacturing, receiving employment income that is also related to beef production.

From available data we cannot identify, on an industry basis, the precise share of the $667 million in gross payments to Manufacturing employees which was earned by workers in the Meat and Meat Products Manufacturing industry. However, at a minimum, an analysis of occupation-based Personal Income Tax data can identify workers with occupations that are very likely to be employed in this industry. This data shows that $52 million was paid to employees with occupations such as 'Meat Boners and Slicers, and Slaughterers' and to 'Meat, Poultry and Seafood Process Workers'.

Please note that there is a difference between industry-based information about employees and occupation-based information. For more information on employment by industry and by occupation, refer to the Employment Profile section of the publication and to the Explanatory Notes.

Tourism

Tourism to the GBR Region as a whole cannot be fully attributed to the attractions of terrestrial and marine ecosystems because tourists also visit for other reasons. However, ecosystem services are nonetheless an input to tourism in the region and likely to be the reason for a significant share of visits. To the extent that terrestrial ecosystems and the Reef are an input to tourism, degradation of these ecosystems will likely reduce the level of tourism activity. This means that economic activities which degrade land and marine ecosystem condition would be competing directly with tourism for "use" of the same ecosystems.

For more discussion of methods of estimating the input of ecosystems and other tourist attractions to total tourism activity, please see the Tourism section of the publication.

Table 6. Tourism selected indicators, Fitzroy NRM region, 2007-08 to 2015-16

 2007-082009-102011-122013-142015-16
Tourist expenditure ($m) (a)1 033.7927.81 090.5998.71 174.2
Number of visitors (millions)3.33.53.63.23.4
Visitor nights (millions)5.66.76.76.87.4
Nights per visitor (millions)1.71.91.92.12.2

a. Current prices
 

Back to top of the page