Tourism Satellite Account

Latest release

Estimates of tourism’s direct contribution to the economy including GDP, value added, employment and consumption by product and industry

Reference period
2023-24 financial year

Key statistics

In 2023-24,

  • tourism gross domestic product (GDP) was $78.1b in current prices
  • tourism GDP rose 5.5% in chain volume terms
  • international tourism consumption rose by $10.8b in chain volume terms
  • domestic tourism consumption fell by $2.3b in chain volume terms
  • tourism filled jobs rose 5.7% to 691,500.
Key tourism indicators, comparison of 2023-24 with 2022-23(a)
  2022-23
($m)
2023-24
($m)
Change
(%)
Gross Domestic Product (GDP)Current prices71,62178,1109.1
Chain volume measures71,62175,5275.5
Gross Value Added (GVA)Current prices59,47665,88310.8
Chain volume measures59,47663,8017.3
Domestic consumption in purchasers' pricesCurrent prices157,461160,1541.7
Chain volume measures157,461155,112-1.5
International consumption in purchasers' pricesCurrent prices25,95538,32947.7
Chain volume measures25,95536,77541.7
Filled jobs '000 654.5691.55.7

(a) As the reference period for chain volume measures is 2022-23, chain volume measures and current prices are identical in 2022-23.

Tourism gross domestic product

Direct tourism

All references to "tourism" are referring to "direct tourism" unless otherwise specified. A direct tourism impact occurs where there is a direct (physical and economic) relationship between the visitor and producer of a good or service. For more information, refer to the Methodology section.

In 2023-24,

  • tourism GDP rose 9.1% to $78.1b in current price terms. Of this, tourism GVA was $65.9b and tourism net taxes on products $12.2b
  • tourism GDP rose 5.5% in chain volume terms and now accounts for 2.9% of the economy.

Tourism gross value added

In 2023-24, tourism gross value added in current price terms increased $6.4b (up 10.8%) to $65.9b, the highest level in the time series. The largest contributors to the increase were:

  • Education and training, up $1.5b (up 52.1%) to $4.2b
  • Ownership of dwellings, up $1.2b (up 17.4%) to $8.2b
  • Air, water and other passenger transport, up $0.7b (up 9.2%) to $8.2b.

(a) Ownership of dwellings in the tourism sector encompasses both the use of vacation homes by their owners and the rental of these properties to tourists. In addition, it includes the leasing of residences to short-term international students and working holidaymakers.

Tourism consumption

In 2023-24,

  • in current prices, domestic consumption increased 1.7% to $160.2b, the highest level in the time series
  • in chain volume terms, domestic consumption decreased 1.5%
  • in current prices, international consumption increased 47.7% to $38.3b, the highest level in the time series
  • in chain volume terms, international consumption increased 41.7%. 

Tourism employment

In 2023-24,

  • tourism accounted for 4.4% of the filled jobs in the whole economy
  • the largest increases in filled jobs occurred in Education and training (up 13,700 jobs), Cafes, restaurants and takeaway food services (up 6,500 jobs) and Sports and recreation services (up 2,900 jobs)
  • increases were recorded in both full-time filled jobs (up 4.6% to 345,600 jobs) and part-time filled jobs (up 6.8% to 345,900 jobs)
  • filled jobs worked by males increased more than those filled by females with increases of 7.0% to 317,700 jobs and 4.5% to 373,700 jobs respectively.

Flow of tourism consumption through the economy

The contribution of tourism to the Australian economy has been measured using the demand generated by visitors and the supply of tourism products by domestic producers.

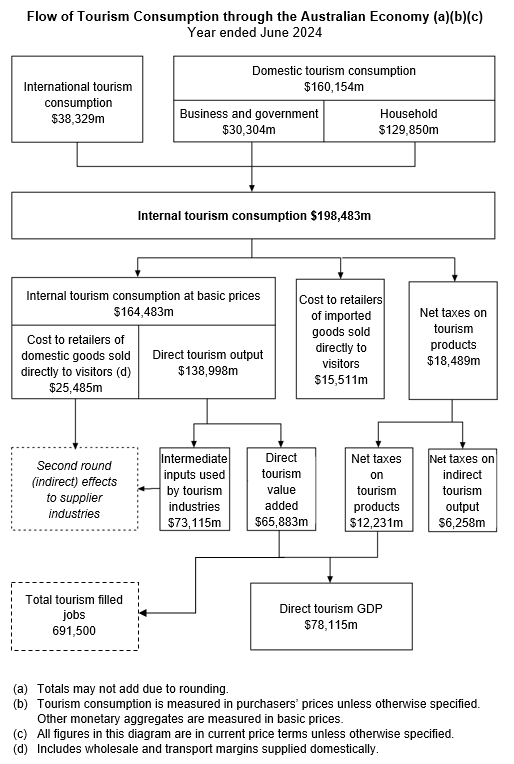
The diagram below provides a graphical depiction of the flow of tourism consumption through the Australian economy in 2023-24. What the diagram highlights is that, unlike traditional ANZSIC industries in the Australian National Accounts, tourism is not measured by the output of a single industry, but rather from the demand side i.e. the activities of visitors. It is the products that visitors consume that define what the tourism economy produces. The diagram shows how the value of internal tourism consumption (as measured by the sum of international and domestic tourism consumption in purchasers' prices, that is, the price the visitor pays) is disaggregated to either form part of tourism GVA/tourism GDP, is excluded as it forms part of the "second round" indirect effects of tourism, or is output that was not domestically produced.

The image is a graphical depiction of the flow of tourism consumption through the Australian economy.

A flow chart representing the flow of tourism consumption through the Australian economy, year ending June 2024. Note, totals may not add due to rounding; tourism consumption is measured in purchasers’ prices unless otherwise specified. Other monetary aggregates are measured in basic prices; all figures in this diagram are in current price terms unless otherwise specified. Domestic tourist consumption to the value of $160,154 million is comprised of business and government, to the value of $30,304 million, and household, to the value of $129,850 million. International tourism consumption, to the value of $38,329 million, combines with domestic tourist consumption to create internal tourism consumption, to the value of $198,483 million. Internal tourism consumption splits into three values; internal tourism consumption at basic prices, to the value of $164,483 million; cost to retailers of imported goods sold directly to visitors, to the value of $15,511 million, and net taxes on tourism products to the value of $18,489 million. Internal tourism consumption at basic prices is comprised of cost to retailers of domestic goods sold directly to visitors, including wholesale and transport margins supplied domestically, to the value of $25,485 million; and direct tourism output, to the value of $138,998 million. Direct tourism output flows into two values; intermediate inputs used by tourism industries, to the value of $73,115 million; and direct tourism value added, to the value of $65,883 million. Cost to retailers of domestic goods sold directly to visitors and intermediate inputs used by tourism industries connect to second round (indirect) effects to supplier industries. Net taxes on tourism products flows into two values; net taxes on tourism products, to the value of $12,231 million; and net taxes on indirect tourism output to the value of $6,258 million. Direct tourism value added and net taxes on tourism products combine to create direct tourism GDP, to the value of $78,115 million. Direct tourism value added is used to estimate total tourism employment, to the value of 691,500 filled jobs.

Changes in this issue

Method changes

This iteration of the TSA includes a methodological update that implements new and improved data sources, enhances the accounts' alignment with international standards and improves the accounts' ability to capture changes in economic structures. The historical estimates for all tourism industries and products have been revised. 

Data cube changes

Changes have been made to the data available for download.

  • The previous data cube has been split into seven separate data cubes.
  • Detailed product and industry data are only available back to 2016-17.
  • Income components of direct tourism gross value added is no longer published.

For more information, refer to the History of Changes section in the Methodology.

Tourism industry classification changes

The Rail transport industry has been relabelled as Rail passenger transport to better reflect the tourism aspect of this industry. Similarly, Other road transport is now Other road passenger transport and Air, water and other transport is now Air, water and other passenger transport.

Tourism product classification changes

Taxi fares has been relabelled as Taxi fares (including ride share) to better reflect what is captured under this product. Similarly, Motor vehicle hire and lease has been relabelled as Motor vehicle (including caravans) hire and lease.

Data downloads

Tourism Satellite Account data cubes

Data are in current prices unless specified

Data files

Inquiries

For further information about these and related statistics, please contact the Customer Assistance Service via the ABS website Contact Us page. The ABS Privacy Policy outlines how the ABS will handle any personal information that you provide to us. 

Previous catalogue number

This release previously used catalogue number 5249.0.

Back to top of the page