Personal safety survey: User guide
This publication presents reference information for understanding data released from the 2021-22 Personal Safety Survey (PSS).
The purpose of this guide
This User Guide contains details about the 2021-22 Personal Safety Survey (PSS), which collected information from a sample of households over the period March 2021 to May 2022. Its purpose is to help data users correctly understand and interpret the data and assess its ability to meet their needs. It includes information about the purposes of the survey, the concepts and contents contained within, and the methods and procedures used to collect the data and produce the estimates. The guide also describes any differences between the 2021-22 survey and earlier PSS surveys (including the 1996 Women’s Safety Survey) and the comparability of data over time.
History of the collection
The PSS was previously conducted by the Australian Bureau of Statistics (ABS) in 2016, 2012 and 2005. The survey is adapted from the design of the Women's Safety Survey (WSS) which was conducted in 1996.
The survey collected information from men and women aged 18 years and over about the nature and extent of violence experienced since the age of 15. It also collected detailed information about men's and women's experience of:
- violence, emotional abuse, and economic abuse by a cohabiting partner
- sexual harassment in the last 12 months
- stalking
- abuse and witnessing parental violence during childhood
- general feelings of safety.
The 2021-22 PSS meets the need for updated information on the nature and extent of violence experienced by men and women in Australia, and other related information regarding people’s safety at home and in the community that has not been collected since 2016.
The requirement for data on the prevalence of violence and sexual assault is discussed in The National Plan to Reduce Violence against Women and their Children 2010-2022 (updated now to The National Plan to End Violence against Women and Children 2022-2032, and in the following ABS Information Papers:
- Defining the Data Challenge for Family, Domestic and Sexual Violence, 2013
- Directory of Family, Domestic, and Sexual Violence Statistics, 2018
- Bridging the data gaps for family, domestic and sexual violence, 2013
- Foundation for a National Data Collection and Reporting Framework for family, domestic, and sexual violence, 2014
Measuring violence
In developing the concepts and definitions used in the survey, the ABS was assisted by a Survey Advisory Group, which included members with legal and crime research backgrounds. Where appropriate, the definitions of physical and sexual violence used were based on actions which would be considered as offences under State and Territory criminal law.
The ABS publishes data relating to crime from different sources, including both administrative and survey data. Different collection methodologies can produce different statistics. For example, statistics derived from police administrative systems differ from those obtained through household surveys, because not all incidents are reported to the police. Also, responses in surveys may be affected by the ways in which questions are asked.
Acknowledgements
The ABS acknowledges the lives and experiences of people affected by violence and abuse who are represented in data produced from this survey, and would like to thank respondents for their participation in the survey. Their participation has contributed valuable information that will help to inform public debate about violence and shape further development of policies and programs aimed at reducing the prevalence of violence.
The ABS would also like to acknowledge the support and input of the Department of Social Services (DSS), which provided funding for the 2021-22 Personal Safety Survey under the National Plan to Reduce Violence Against Women and their Children 2010-22 (updated now to the National Plan to End Violence against Women and Children 2022-32), as well as the Survey Advisory Group, who provided the ABS with advice on the priority information to be collected and on some aspects of survey methodology. Members of this group included representatives from state and territory and Commonwealth Government departments, crime research agencies, service providers and relevant academics.
Sampling
Scope
The scope of the 2021-22 Personal Safety Survey was persons aged 18 years and over residing in private dwellings across Australia (excluding very remote areas). Interviews were conducted with one randomly selected person aged 18 years or over who was a usual resident of the selected household.
Private dwellings are:
- houses
- flats
- home units
- any other structures used as private places of residence at the time of the survey.
Usual residents are people who usually live in a particular dwelling and regard it as their own or main home. People usually residing in non-private dwellings, such as hotels, motels, hostels, hospitals, nursing homes, or short-stay caravan parks were not in scope.
Both urban and rural areas in all States and Territories were included in the survey, except for very remote areas of Australia. The following groups were also excluded from the scope of the survey:
- visitors at a dwelling whose usual place of residence is Australia (as they would have their chance of selection at their usual residence)
- overseas visitors intending to stay in Australia for less than 12-months
- non-Australian diplomats, non-Australian diplomatic staff, and non-Australian members of their household
- members of non-Australian defence forces stationed in Australia and their dependants
- people who usually reside in non-private dwellings
- households where all residents are aged less than 18 years.
It should be noted that the survey was developed in 2019, before the release of the Standard for Sex, Gender, Variations of Sex Characteristics and Sexual Orientation (2020). As described in the next section of this chapter (Sample design and selection), the sample was designed to support estimates for female and male sex.
Sample design and selection
The sample size, distribution, and method of selection for the 2021-22 PSS were based on several factors:
- key estimates required to be produced from the survey
- level of disaggregation and accuracy at which these key survey estimates were required
- costs and operational constraints of conducting the survey.
The aim of the survey was to produce certain key estimates of interest with an acceptable level of quality. This included sexual, physical and partner violence, and partner emotional abuse estimates.
The sample was designed to meet these requirements as closely as possible whilst taking into consideration the overall costs and operational constraints of conducting the survey.
The PSS was originally scheduled for enumeration in 2020. However, the COVID-19 pandemic and associated responses resulted in multiple postponements to data collection activities.
These disruptions were experienced across the ABS statistical program and led to a number of adjustments to the household survey schedule and collection approach. Resulting adjustments included postponing surveys, reducing content, introducing digital collection channels, and reducing sample sizes to balance priorities across the survey program.
For the PSS, the decision was taken to reduce and redesign the approached sample to maximise the ability to report against key information requirements. While the reduced sample maintains the quality of headline indicators, it has had some impact on the range of data able to be produced.
The adjusted sample was designed to produce each of the key estimates and be disaggregated for:
- females – at the national and state/territory level
- males – at the national level.
The sample for females was allocated roughly equally in each state and territory to provide sufficiently reliable state and territory and national level estimates for women. The sample for males was allocated to states and territories roughly in proportion to their respective population size, in order to provide sufficiently reliable national level estimates for males.
In order to target the differential numbers of male and female sample, dwellings were allocated as either male (where an interview with a male aged 18 years and over was required) or female (where an interview with a female aged 18 years and over was required). One in-scope person of the pre-allocated sex was then randomly selected from each dwelling. Where the household did not contain an in-scope resident of the pre-allocated sex, an in-scope resident of the opposite sex was randomly selected, referred to as a sex-selection 'flipped' household (for further information refer to the Survey Development and Data Collection chapter of this publication). Due to relative differences in the number of male to female dwellings selected in the sample, approximately half of the final male sample came from sex-selection 'flipped' households.
Lastly, response rates to the survey were impacted by a number of operational factors, designed to help ensure the safety of respondents, the safety of interviewers and also to help ensure data integrity. These included:
- the partially voluntary nature of the survey
- the sensitive nature of the survey content
- the requirement for interviews to be conducted in a private interview setting
- no proxy interviews were allowed for the voluntary/sensitive component of the survey (therefore people requiring proxy interviews are not included in the final data).
Due to these factors, the original sample design also catered for lower response rates, expecting to attain around a 70% response rate. COVID-19 pandemic restrictions, lockdowns, and adherence to public health guidelines led to lower response rate expectations.
When entering the field in 2021, it was initially planned that a total sample of 38,837 households would be selected and approached for interview. Due to COVID-19 restrictions and lockdowns, only 22,790 households were able to be approached. Details on the final response rates achieved are available in the next section of this chapter (Response Rates).
Response Rates
The 2021-22 PSS had a total sample of 38,837 households. Of these, 6,886 households were pre-allocated as part of the male sample and 31,951 households were pre-allocated as part of the female sample. These sex-based samples were subject to change depending upon whether there was someone of the pre-allocated sex in the household (for more details on the requirement for pre-allocated sex, refer to the Sample design and selection section in this chapter.
After removing sample loss of 17.5% (households where residents were out of scope of the survey or where dwellings proved to be vacant, under construction or derelict), and an additional 23.8% that were classified as other loss (either prior to or after approach), this resulted in a final selection of 22,790 eligible dwellings.
A final response rate of 52.2% was achieved for the 2021-22 PSS, with 11,905 persons completing the survey questionnaire nationally. The response comprised 2,073 fully responding males and 9,832 fully responding females.
A fully responding household is one in which all parts of the interview were completed for the selected respondent. Households where all compulsory parts of the interview were completed (but the voluntary component was not started or completed) were classified as adequate complete, however they were not included as part of the final data file. For more details on what was included in the compulsory part of the survey, refer to Survey Content in the Survey Questionnaire and Content section of the Survey Development and Collection chapter of this publication.
| Personal Safety Survey, 2021-22, Response rates | ||||||
|---|---|---|---|---|---|---|
| Number of households | Proportion of households | ||||
| Selected households | 38837 | 100.0 | ||||
| Sample loss(a) | 6807 | 17.5 | ||||
| Other loss(b) | 9240 | 23.8 | ||||
| Selected households after sample and other loss | 22790 | 58.7 | ||||
| Approached households | 22790 | 100.0 | ||||
| Selected households after sample and other loss | ||||||
| Fully responding households | 11905 | 52.2 | ||||
| Non-fully responding households | 10885 | 47.8 | ||||
| Adequate Complete(c) | 2310 | 10.1 | ||||
| Part Response(d) | 906 | 4.0 | ||||
| Non Response(e) | 6075 | 26.7 | ||||
| Refusal(f) | 1594 | 7.0 | ||||
- Sample loss = (Out on Scope + Vacant Dwelling + Vacant Holiday Home + Dwelling Converted to Non-Dwelling + Derelict Dwelling + Dwelling Demolished + Dwelling Under Construction + Dwelling Listed in Error + URs Away all Enumeration Period + URs Too Young + No UR Adults identified as male or female + Female Selection with Male interviewer + Male Sample Deselection)
- Other loss = (Other Non Response + Part Language + Part Other Non Response + Contact without Data + Secured Building Non contact + Household not approached + Respondent known to Interviewer + Machine problem + Other (Incomplete))
- Adequate Complete = Persons who opted out at or after the designated opt-out point and Proxy interviews
- Part Response = Part Non-Contact
- Non Response = (Full Non-Contact + Full Language Problems + Other Non Response +Nat Disaster Non Response)
- Refusal = (Full Refusal + Part Refusal)
| Personal Safety Survey, 2021-22, Approached sample, Final sample and Response rates | ||||||||||
|---|---|---|---|---|---|---|---|---|---|---|
|
| NSW | Vic | Qld | SA | WA | Tas | NT | ACT | Aust. |
| Households approached (after sample and other loss) | 3610 | 3891 | 3210 | 2597 | 2785 | 2420 | 1612 | 2665 | 22790 | |
| Households in fully responding (FR) sample | 1744 | 1786 | 1748 | 1576 | 1649 | 1736 | 639 | 1027 | 11905 | |
| Response rate (%) | 48.3 | 45.9 | 54.5 | 60.7 | 59.2 | 71.7 | 39.6 | 38.5 | 52.2 | |
| Males in FR sample | 246 | 200 | 356 | 284 | 441 | 305 | 82 | 159 | 2073 | |
| Pre-allocated male | 119 | 107 | 177 | 50 | 294 | 91 | 28 | 119 | 985 | |
| 'Flipped' male(a) | 127 | 93 | 179 | 234 | 147 | 214 | 54 | 40 | 1088 | |
| Females in FR sample | 1498 | 1586 | 1392 | 1292 | 1208 | 1431 | 557 | 868 | 9832 | |
| Pre-allocated female | 1472 | 1546 | 1354 | 1273 | 1152 | 1401 | 547 | 800 | 9545 | |
| 'Flipped' female(a) | 26 | 40 | 38 | 19 | 56 | 30 | 10 | 68 | 287 | |
- ‘Flipped’ sample comes from households which were originally allocated the opposite sex for selection. As such, these households comprise persons aged 18 years and over of the one sex. For more details, see the Sample design and selection section of this chapter.
The computer-assisted self-interview (CASI) gave the respondent the option to complete the voluntary section of the survey directly and privately on the interviewer’s laptop. For respondents who were not comfortable with completing a CASI, the option for the interview to continue as a computer-assisted personal interview (CAPI), where the interviewer asks the respondent the questions aloud and records their answers, was available. For more details, see the Survey Development and Data Collection chapter of this publication.
In total, 2,458 respondents (21%) chose to continue the survey as a CASI, 5,436 respondents (46%) chose to proceed with the CAPI, and 4,011 respondents (34%) completed the survey with a computer-assisted telephone interview (CATI). The following table presents the characteristics of respondents by the interview mode utilised.
| Personal Safety Survey, 2021-22, CASI, CAPI & CATI uptake rates (a), By selected characteristics | |||||||
|---|---|---|---|---|---|---|---|
| CASI | CAPI | CATI | |||||
| No. | % | No. | % | No. | % | Total | |
| Male | 458 | 22.1 | 1361 | 65.7 | 254 | 12.3 | 2073 |
| Female | 2000 | 20.3 | 4075 | 41.4 | 3757 | 38.2 | 9832 |
| 18-44 | 1336 | 28.2 | 1698 | 35.8 | 1705 | 36.0 | 4739 |
| 45-64 | 780 | 19.8 | 1803 | 45.7 | 1366 | 34.6 | 3949 |
| 65-99 | 342 | 10.6 | 1935 | 60.1 | 940 | 29.2 | 3217 |
| NSW | 129 | 7.4 | 629 | 36.1 | 986 | 56.5 | 1744 |
| VIC | 67 | 3.8 | 600 | 33.6 | 1119 | 62.7 | 1786 |
| QLD | 552 | 31.6 | 931 | 53.3 | 265 | 15.2 | 1748 |
| SA | 455 | 28.9 | 919 | 58.3 | 202 | 12.8 | 1576 |
| WA | 513 | 31.1 | 906 | 54.9 | 230 | 13.9 | 1649 |
| TAS | 485 | 27.9 | 1009 | 58.1 | 242 | 13.9 | 1736 |
| NT | 162 | 25.4 | 218 | 34.1 | 259 | 40.5 | 639 |
| ACT | 95 | 9.3 | 224 | 21.8 | 708 | 68.9 | 1027 |
| Australian born | 1740 | 20.6 | 3904 | 46.3 | 2790 | 33.1 | 8434 |
| Born Overseas | 718 | 20.7 | 1532 | 44.1 | 1221 | 35.2 | 3471 |
| Main English-speaking countries(b) | 309 | 21.6 | 690 | 48.3 | 430 | 30.1 | 1429 |
| Other countries | 409 | 20.0 | 842 | 41.2 | 791 | 38.7 | 2042 |
| Total response | 2458 | 20.6 | 5436 | 45.7 | 4011 | 33.7 | 11905 |
- Not all modes were available throughout the survey collection period for all areas/populations. Therefore, these uptake rates are reflective of collection outcomes and not necessarily reflective of mode of choice.
- Includes Canada, Republic of Ireland, New Zealand, South Africa, United Kingdom and United States of America.
Due to the procedures used for collecting data for the PSS, particularly regarding the requirement for a private interview with the respondent, there are some groups which are under-represented in the survey. The table presented below identifies the characteristics of fully responding (11,905) and adequate complete (2,310) respondents.
| Personal Safety Survey, 2021-22, Response status, By selected characteristics | ||||||||
|---|---|---|---|---|---|---|---|---|
| Fully Responding | Adequate Complete | Total | Fully Responding | Adequate complete | Total | |||
| (%) | (%) | (%) | (%) | (%) | (%) | |||
| Disability Status | ||||||||
| Has disability | 35.2 | 43.8 | 36.6 | 80.6 | 19.4 | 100.0 | ||
| Profound | 1.5 | 7.2 | 2.4 | 51.6 | 48.4 | 100.0 | ||
| Severe | 2.8 | 4.9 | 3.2 | 74.9 | 25.1 | 100.0 | ||
| Moderate | 6.0 | 6.5 | 6.0 | 82.6 | 17.4 | 100.0 | ||
| Mild | 10.4 | 13.7 | 10.9 | 79.7 | 20.3 | 100.0 | ||
| Schooling/employment restriction only | 4.1 | 3.5 | 4.0 | 86.0 | 14.0 | 100.0 | ||
| No limitation or specific restriction | 10.3 | 8.1 | 10.0 | 86.9 | 13.1 | 100.0 | ||
| Does not have a disability | 64.8 | 56.2 | 63.4 | 85.6 | 14.4 | 100.0 | ||
| Proficiency in Spoken English | ||||||||
| Did not speak English first as a child or does not mainly speak English at home | 18.3 | 35.4 | 21.0 | 72.7 | 27.3 | 100.0 | ||
| Very well | 11.6 | 12.5 | 11.7 | 82.7 | 17.3 | 100.0 | ||
| Well | 5.8 | 10.8 | 6.7 | 73.6 | 26.4 | 100.0 | ||
| Not well | 0.8 | 9.6 | 2.3 | 30.9 | 69.1 | 100.0 | ||
| Not at all | 0.0 | 2.5 | 0.4 | 1.7 | 98.3 | 100.0 | ||
| First spoke English as a child and mainly speaks English at home | 81.7 | 64.5 | 79.0 | 86.7 | 13.3 | 100.0 | ||
| Culturally and Linguistically Diverse | ||||||||
| Australian Born | 70.8 | 57.2 | 68.6 | 86.4 | 13.6 | 100.0 | ||
| Born Overseas | 29.1 | 42.7 | 31.4 | 77.9 | 22.1 | 100.0 | ||
| Main English-speaking country(a) | 12.0 | 8.7 | 11.5 | 87.7 | 12.3 | 100.0 | ||
| Other countries | 17.1 | 34.1 | 19.9 | 72.2 | 27.8 | 100.0 | ||
| Total(b) | 100.0 | 100.0 | 100.0 | 83.8 | 16.2 | 100.0 | ||
- Includes Canada, Republic of Ireland, New Zealand, South Africa, United Kingdom and United States of America
- Includes country of birth inadequately described
Weighting, Benchmarking and Estimation
Weighting
Weighting is the process of adjusting results from a sample survey to infer results for the total in-scope population. To do this, a 'weight' is allocated to each sample unit corresponding to the level at which population statistics are produced. For the 2021-22 Personal Safety Survey (PSS), this is at a person level. The weight can be considered an indication of how many population units are represented by the sample unit.
Selection weights
The first step in calculating weights for each person was to assign an initial weight. The initial person weight was derived from the initial household weight (inverse of the probability of the household being selected in the survey) multiplied by the total number of in-scope males or females in the household (depending on the allocated sex for the household). For example, if the probability of a household being selected in the survey was 1 in 600, and the household contained 3 in-scope females, then the respondent (i.e. selected person) within the household would have an initial weight of 1,800 (i.e. 600 x 3). That is, the respondent in the sample represents 1,800 other persons in the population. Initial person weights took into account an increase in male-only household representation which was a result of households that were subject to sex selection flipping from their pre-allocated sex.
Benchmarking
Using information based on observations by interviewers at the dwelling, as well as additional information collected from non-fully responding respondents as part of the compulsory component of the survey, analysis was undertaken to ascertain whether there were any particular categories of persons that were over- or under- represented in the sample. This over- or under-representation in the sample can be corrected using a non-response adjustment and/or through calibrating the weights to population benchmarks. The calibration of weights to population benchmarks was used in the 2021-22 PSS.
Benchmarks are independent estimates of the size of the population of interest. Weights are calibrated against independent population benchmarks to ensure that the survey estimates conform to the independently estimated distribution of the population, with respect to the benchmark categories, rather than to the distribution within the responding sample itself.
The 2021-22 PSS survey estimates were benchmarked to the Australian estimated resident population aged 18 years and over who were living in private dwellings (excluding very remote areas of Australia), simultaneously using the following benchmark categories:
Number of persons by:
- State or Territory by Age groups by Sex
- State or Territory by Capital city/Balance of state
- State or Territory by Social marital status (Married (incl. registered or de facto) and Not married) by Sex.
Note for male estimates: State and territories have not been benchmarked to their state/territory male populations, and therefore contribute to national estimates only. Also, as outlined in the Sample Design and Selection section of the Sampling chapter, the adjusted sample was not designed to produce estimates for states/territories for males, and therefore detailed estimates are likely to have associated high standard errors (for more details on standard errors, see Data Quality and Technical Notes chapter of this publication).
Two benchmark categories (1 and 2) were benchmarked to the estimated resident population living in private dwellings in Australia (excluding very remote areas) as at September 2021 based on the 2021 Census of Population and Housing. The in-scope estimated resident population was estimated to be 19,443,424 as at September 2021. The benchmarks, and hence the estimates from the survey, do not (and are not intended to) match estimates of the total Australian estimated resident population (which include persons living in very remote areas of Australia and persons in non-private dwellings, such as hotels) obtained from other sources.
The third benchmark category was based on survey estimated benchmarks. Benchmarks are considered to be survey estimated if they are obtained from a sample survey and as such, have a non-negligible level of sample error associated with them. The monthly Labour Force Survey (as per March 2021 to June 2022) provided the survey estimated benchmarks for labour force status, social marital status, and broad country of birth categories. The survey estimated benchmarks were aligned to the in-scope resident population aged 18 years or over, who were living in private dwellings in each state and territory (excluding very remote areas of Australia), as at September 2021. They were also made to represent the same population as the demographic benchmarks with respect to state/territory (although note difference identified previously for males), section of state, age group and sex. The sample error associated with the survey estimated benchmarks was incorporated into the standard error estimation.
The 'state' population benchmark for benchmark 1, for females, consisted of all six states and the two territories. Males were not benchmarked to the state/territory component of this benchmark.
For benchmark 1, 'Age group' for females was benchmarked against 5-year age groups, between the 18-20 years and 76 years and over groups. ‘Age group’ for males was benchmarked against 10-year age groups, between 18-25 years and 76 years and over groups.
Estimation
Estimation is a technique used to produce information about a population of interest, based on a sample of units (i.e. persons) from that population. Each record in the 2021-22 PSS has a person weight. Information for sampled persons is multiplied by the weights to produce estimates for the whole population (or the population of interest).
The application of weights ensures that estimates will conform to an independently estimated distribution of the population by certain categories including state, age, and sex, rather than to the distributions within the sample itself.
Replicate weights have also been calculated - 60 person replicate weights. The purpose of these replicate weights is to enable calculation of the relative standard error (RSE) for each estimate produced from the survey. Further information on replicate weights is provided in the Data Quality and Technical Notes chapter of this publication.
Users should take into consideration the quality of the estimates when interpreting data from the PSS. For further information about how to calculate RSE's and conduct significance testing, refer to the Data Quality and Technical Notes chapter of this publication. For other related information on other factors to consider when interpreting results, refer to the individual topic chapters in this publication.
Perturbation of estimates
To minimise the risk of identifying individuals in aggregate statistics, a technique called perturbation is used to randomly adjust cell values. Perturbation involves a small random adjustment of the statistics and is considered the most satisfactory technique for avoiding the release of information that could identify individual survey respondents while maximising the range of information that can be released. These adjustments have a negligible impact on the underlying pattern of the statistics.
After perturbation, a given published cell value will be consistent across all tables. However, adding up cell values to derive a total will not necessarily give the same result as the published totals. As such, proportions may add to more or less than 100%. Users are advised to use the published totals rather than deriving totals based on the component cells.
Cells with relatively small values may be proportionally more affected by perturbation than large values. Users are advised against conducting analyses and drawing conclusions based on small values.
All data presented in the publications produced for the 2021-22 Personal Safety Survey have had perturbation applied to 2016 and 2021-22 estimates.
Survey Development and Data Collection
Introduction
To inform data priorities the ABS convened a PSS Survey Advisory Group (SAG). Members of this group included representatives from state and territory and Commonwealth Government departments, crime research agencies, service providers and relevant academics. During these meetings decisions were made regarding user requirements, special survey procedures and new priority content.
Field testing
The questionnaire and new content were field tested via cognitive testing and a dress rehearsal. These tests were conducted to ensure:
- data was obtained in an efficient and effective way
- respondent concern about the sensitivity or privacy aspects of the information were addressed
- there was effective respondent/interviewer interaction and minimise respondent burden to acceptable levels
- sufficient information was provided in the question or as part of additional information attached to the question for the respondent to understand and answer the questions appropriately
- operational aspects of the survey were satisfactory, e.g. arrangement of topics, sequencing of questions, adequacy and relevance of response categories and trigram coders, etc.
Targeted interviews with people who were known to have experienced violence were conducted at crisis support centres in Victoria. This phase involved a series of questions being asked to probe the respondent for question meaning, comprehension, areas of sensitivity and gather information on potential areas of content development. The main purpose was to ensure that the content of the survey was effectively tested on people who have experienced violence as well as obtaining feedback about their reactions to the survey's content.
As is common practice for ABS surveys, the questionnaire and field procedures were also tested using experienced ABS interviewers. These interviewers undertook specialised survey training (see Interviewer training). The procedures and methods planned for the final survey were also tested (see Survey procedures). This dress rehearsal was conducted in New South Wales, Queensland, Tasmania and Western Australia during September 2019.
The broad aims of the dress rehearsal were to:
- test new and modified survey content to ascertain respondent reactions and identify any sensitivities associated with the survey content
- test operational aspects of the survey instrument
- assess the suitability of modified field procedures and the comprehensiveness of overall survey procedures and documentation.
Telephone interviewing (Computer-Assisted Telephone Interview or CATI) was developed as a contingency during initial nationwide COVID-19 lockdowns. Following extended lockdowns during the enumeration period in several states/territories, this contingency was initially conducted via two small trials with survey participants. The trials took place in the second half of 2021 across New South Wales, Victoria and Queensland. The main aims of the trials were to:
- confirm suitability of conducting the survey over the phone
- test respondent ability to access and use prompt cards online during the survey
- test procedures around maintaining the privacy and safety of the respondent.
Feedback from interviewers involved in the first trial was used to update interviewer instructions and procedures prior to the second trial. As a result of generally positive responses to the trials, CATI was approved as a collection mode for broader use throughout enumeration in early 2022.
Survey Questionnaire and Content
A Computer Assisted Interview (CAI) instrument was used for the 2021-22 PSS. It contained:
- a household form (which could be completed via Computer-Assisted Personal Interview – CAPI; Computer-Assisted Telephone Interview – CATI; or Computer-Assisted Web Interview – CAWI)
- a personal questionnaire (which could be completed via Computer-Assisted Personal Interview – CAPI; Computer-Assisted Telephone Interview – CATI; or, for part of the content, Computer-Assisted Self-Interview – CASI).
The household form collected from a responsible adult within the household, basic demographic data, such as sex, age, country of birth and details of the relationship between individuals in the household. The instrument then randomly selected an in-scope person of the pre-allocated sex to be interviewed. If there was no in-scope person of the pre-allocated sex in the household, an in-scope person of the opposite sex was selected. If there was no adult identified as the opposite sex either, the household was not in scope. For more details refer to the Sample design and selection section of the Sampling chapter of this publication.
The survey questionnaire was designed and thoroughly tested according to standard ABS procedures. Factors taken into consideration included:
- the length and wording of questions
- the suitability of response categories
- the sensitivity of the topics and issues to be covered
- the ability of people to recall events which occurred in the past
- minimising and simplifying instructions
- the logical sequence of the instrument
- the length of interviews.
Consideration was also given to the structuring of the instrument, so that more sensitive topics were progressively introduced. Information was recorded by interviewers (during a CAPI/CATI) or respondents (during a CASI/CAWI) in several different ways, such as:
- Predetermined response categories – This approach was used for recording answers where a limited range of responses were expected, or where the focus of interest was on a particular group of responses. Response categories were listed in the survey instrument and were expected to cover all possible responses.
- Running prompt (CAPI/CATI only) – In these questions, predetermined response categories were read out to the respondent one at a time until the respondent indicated agreement to one or more of the categories (as appropriate to the topic) or until all predetermined categories were exhausted.
- Prompt cards (CAPI/CATI only) – Where appropriate, printed (or online for CATI) lists covering the range of possible answers to the question were shown to the respondent who was asked to select the most relevant response(s). Prompt cards were also used to provide extra information that may have assisted the respondent with answering the question. By listing a set of possible responses (either in the form of a prompt card or running prompt question) the prompt cards served to clarify the question or to present various alternatives, to help assist the respondent to select an appropriate response.
- Responses for coding – This method was used for content such as identifying family groups in a household, country of birth, and current study and education qualification questions. Responses were recorded by the interviewer and either automatically coded by the instrument or subsequently coded by office staff. For further detail regarding this coding, see the Data Processing and Coding chapter of this publication.
A copy of the 2021-22 PSS Questionnaire and prompt cards are available under Downloads.
Survey Content
The survey content was split into compulsory content and voluntary content. The compulsory content covered the topics of:
- Household characteristics and Family composition
- Housing
- General demographics (respondent and current partner)
- Visa status
- Ancestry (respondent and current partner)
- Language (respondent and current partner)
- Sexual orientation
- Current and Non-school Education (respondent and current partner)
- Employment (respondent and current partner)
- Australian Defence Force service
- Income (respondent, current partner and household)
- Disability
- Health
- Financial stress
- Social connectedness
- General feelings of safety
The voluntary content covered the topics of:
- Sexual harassment (in the last 12 months)
- Violence (since the age of 15)
- Characteristics of the most recent incident of violence (in the last 10 years)
- Physical and sexual abuse (before the age of 15)
- Witnessing violence between parent and partner (before the age of 15)
- Current/previous partner violence (since the age of 15)
- Current/previous partner emotional abuse (since the age of 15)
- Current/previous partner economic abuse (since the age of 15)
- Stalking (since the age of 15)
Interviewer panel
Information was collected by specially trained ABS interviewers who agreed to work on the survey.
Prior to 2021-22 PSS, a female interviewing panel was used. This was based on expert advice and supported by the SAG indicating that, on balance, men and women are more likely to feel comfortable revealing sensitive information about their possible experiences of violence to a woman, and therefore would also encourage participation. In 2012 and 2016, male interviewers were available only if requested by the respondent (which did not occur).
To assist with the regular review of procedures, in 2016 feedback was collected after the interview from around a quarter of the respondents on whether they preferred a male or female interviewer to conduct the survey. This feedback confirmed that female respondents had a strong preference for female interviewers, particularly when they had sensitive experiences of violence and abuse to report. Whereas the large majority of male respondents did not identify a preference either way. Therefore in 2021-22, female interviewers conducted surveys with both male and female respondents, and, for the first time, male interviewers were introduced to the survey interviewer panel to conduct surveys with male respondents. In addition, the use of the Computer-Assisted Self-Interview (CASI) provided an alternative for those people who felt uncomfortable reporting their experiences directly to an interviewer (for more details on the CASI, see Interviews in Survey procedures section of this chapter).
To cater for instances where a respondent did not speak English, a small number of interviewers with foreign language skills were trained to conduct PSS interviews and were mainly used for interviews in areas not significantly far from their local area. In these cases the full survey, including the voluntary component, could be conducted, and were therefore not classified as proxy interviews (see Proxy Interviews in Survey procedures section of this chapter).
Interviewer Training
Specialised PSS Interviewer training was provided to ensure all interviewers used a standardised approach.
The training program included sessions to familiarise the interviewers with:
- the concepts addressed in the survey (definitions)
- the specialised survey procedures developed for the survey including sensitive approach methods to maximise response, and private interview requirements
- multiple survey modes used to collect information
- administrative aspects of the survey.
In addition, Sensitivity and Awareness Training sessions were led by external psychologists and aimed to increase interviewers' awareness of the experience of violence, particularly family, domestic and sexual violence, and their own response to the topic. It also provided techniques to assist interviewers to look after themselves and to react professionally and appropriately to the topics addressed in the survey.
Training of the ABS interviewers was conducted in a variety of formats:
- Prior to the COVID-19 pandemic restrictions interviewers attended a two day face-to-face comprehensive training workshop.
- During the COVID-19 pandemic restrictions, interviewers were trained via online video conference, video presentations and one-on-one virtual practice sessions. They were also extensively trained in conducting Computer Assisted Telephone Interviews and were given instruction manuals to assist. This training emphasised the importance of only conducting a CATI when the respondent was in a private setting, as per face-to-face (CAPI) procedures.
- After COVID-19 pandemic restrictions had eased, interviewers in states which experienced long-term lockdown restrictions were given a one-day online refresher training course.
A support network was put in place to provide support, stress management and coping strategies for interviewers while they were working on the survey. The main components of the network were access to a counsellor hotline, a contact person in the office, and the provision of voluntary emotional debriefing sessions. Interviewers were strongly encouraged to use this network.
Survey procedures
While standard ABS survey procedures were generally followed, there were also specific field procedures applied reflecting the sensitive nature and content of the survey. The aims of these procedures were to maximise response rates and to ensure the safety of both respondents and interviewers. They were also designed to help ensure confidentiality of responses and the integrity of data.
Registration and Household Form
For the 2021-22 PSS, an official letter and registration process (for registering contact details) were used to inform chosen households that had been selected to participate in the survey. As part of maintaining confidentiality and the safety of the respondent, information regarding the sensitive content of the survey was kept to a minimum in this material.
As such, prior to enumeration, all selected households were sent pre-approach material by mail that consisted of the following:
- Registration letter and leaflet, sent to the dwelling prior to the commencement of the enumeration round they had been chosen for.
- Reminder letter(s), sent prior to interviewers commencing in the field.
The registration and reminder letters contained the log-on credentials to register and complete an online Household Form via a Computer-Assisted Web Interview (CAWI) (see Household Details section below). The CAWI was also used to gather respondent contact details and information on the best time to call to arrange an interview. This information was used to help interviewers plan their workloads and save unnecessary trips to selected dwellings. There was a respondent help line to assist households with registration or to help with any other queries related to the survey. If not already completed, the Household Form could also be completed via CATI when the help line was called.
The pre-approach mail-out was not possible for a small number of households for which the ABS did not have an adequate postal address. For households where there was an insufficient postal address but there was a physical address, interviewers left a copy of the Non-deliverable Letter informing respondents of their selection in a survey and requesting they contact the office to provide contact details and best time to call information to arrange an interview.
If households registered contact details for the survey online, the interviewer called the respondent to arrange a suitable time to conduct the interview. If household contact details weren’t registered, the interviewer approached the house in person.
Household Approach (incl. Screening questions)
Due to the sample requirements (for more details see Sampling chapter of this publication), each dwelling had an initially predetermined sex allocated. So that interviewers could tailor their approach, a series of screening questions were asked of the person answering the door, to determine the number of usual residents aged 18 years and over, and then how many were male and how many were female. From this information the interviewer was able to determine:
- whether the person they were talking to would be selected for interview (i.e. there was only one person of the pre-allocated sex in the household and the person at the door was that sex, or there was no-one of the pre-allocated sex but there was one person of the opposite sex (referred to as sex-selection ‘flipped’ household))
- if further details of the usual residents would need to be collected to determine who would be selected for interview.
Interviewers were provided with specific training aimed at assisting them in gaining cooperation for the survey to ensure the highest response rates possible. With the first part of the 2021-22 PSS being compulsory, interviewers were also able to advise of people’s obligation to participate in the survey.
Household Details
General characteristics of the household were obtained from any responsible adult (ARA) member of the household, either over the phone (if the ARA had registered and provided their contact details, the ARA called the help line and agreed to complete the household form at that time, or via the completion of the CAWI household form) or upon the first face-to-face contact with the household after the screening questions had been asked. This information included the number and basic demographic characteristics of usual residents of the dwelling (e.g. age and sex), and the relationships between those people (e.g. spouse, son/daughter, not related) (for more details see Survey Questionnaire and Content section of this chapter).
From the information provided by the ARA regarding household composition, those persons in scope of the survey were determined, and, on a random basis, one person aged 18 years and over of either the predetermined or ‘flipped’ sex was selected for inclusion in the survey.
If the dwelling contained no usual residents aged 18 years or over, or a male interviewer found the household only contained female residents upon face-to-face contact, no further information was collected from that household.
Interviews
Personal interviews were conducted with one randomly selected person aged 18 years or over who was a usual resident of the selected household. Interviews were conducted from March 2021 to May 2022. Contact time for fully responding interviews was, on average, around 35 minutes.
The 2021-22 PSS was conducted under the authority of the Census and Statistics Act 1905. This ensures that the ABS has the authority to ask questions and that the confidentiality provisions of the Act will be applied, as in all ABS surveys. However, because of the potential sensitivities of parts of this survey, the compliance provisions of the Act were not fully applied and the survey was conducted on a part voluntary basis.
Respondents were first advised of the general nature of the survey. During the interview, less sensitive questions were asked first, such as questions about their education, employment details and general feelings of safety. This allowed people to become comfortable with the interview format, to build a certain level of rapport with the interviewer and to also familiarise them with the survey content. At the end of this set of questions (referred to as the compulsory content), respondents were informed of the sensitive nature of the upcoming questions and their permission to continue with the interview was sought (referred to as the Opt-out point). From this point the interview was voluntary, and respondents could choose not to proceed at any stage.
At this point of the survey, for face-to-face interviews (CAPIs), the respondent was provided the option for the interview to continue as a CASI, that is, the respondent could complete the interview themselves using the interviewers’ laptop. The CASI mode was introduced for the PSS in 2016 as part of a review of collection procedures for the sensitive content, and as a method to improve response rates. The CASI reduced respondent and interviewer burden as questions and responses did not have to be articulated, thereby protecting the respondent’s privacy in circumstances where they did not feel comfortable discussing the topics. If the respondent identified they were not comfortable with using a computer or wanted the interviewer to continue, the interviewer could offer to continue conducting the interview (as a CAPI).
It was a specific requirement that all surveys conducted as a CAPI for the sensitive topics were to be conducted alone (including no children) in a private setting. Interviewers were advised that it was preferable to obtain a private setting (whether in the home or at an alternative location) from the beginning of the interview to avoid disruption. This applied to CATIs as well, with interviewers being advised to request the respondent set themselves up in a private location for the phone call. If the sensitive topics could not be conducted in a private setting for either a CAPI or a CATI, the interviewers were advised to arrange to reschedule the remainder of the interview. If the respondent chose to complete the voluntary component as a CASI, interviewers were advised that they should ensure that other people could not see the screen, respondent reactions or hear any queries the respondent may ask them about the questions. If they could, then the interviewer was to follow the same procedures as a CAPI.
Approximately 2,310 respondents chose not to proceed with the 2021-22 PSS beyond the Opt-out point (classified for PSS 2021-22 as an adequate complete interview). Prior to PSS 2016, most of these respondents may have refused either at the door or before commencing their personal interview as a result of those cycles being fully voluntary.
For more details on the characteristics of CASI, CAPI and CATI respondents, see the Response Rates section of the Sampling chapter of this publication.
Support offered
The questions asked during the interview (or even just raising the topics that were to be asked about) may have caused emotional distress for some respondents. The ABS provided an information card containing contact details of support services. This card was offered to all people during the sensitive, voluntary component of the interview (i.e. from the Opt-out point onwards).
Proxy Interviews
For the 2021-22 PSS, the option of proxy interviews was available if required. Proxy interviews, for selected questions in the compulsory part of the survey, were offered to respondents who were unable to participate in interviews due to any of the following reasons:
- language barriers that required interpretation by a household member
- significant illness/injury/disability which prevented them from being able to answer for themselves at any time
- an ABS translator could not be organised.
For proxy interviews, a household member of the respondent’s choosing was able to answer the compulsory questions in the survey on the respondent’s behalf. These questions included demographic information such as household information, ancestry, visa status, language, education, employment, income, disability, social connectedness and general feelings of safety.
For proxy interviews, the sensitive voluntary component of the survey was not mentioned and questions on these topics were not asked. This was to ensure the safety of those participating (where the respondent may have been living in the same household as a perpetrator) and the reliability of the data provided (where the respondent may not have felt comfortable revealing sensitive information through an interpreter/other family member, who may not have been aware of the respondent's past or current experiences).
The use of proxy interviews for the compulsory part of the survey had the primary purpose of providing information on the possible under-representation in the survey of particular types of respondents, such as those from a non-English speaking background or with a profound or severe communication disability.
There were approximately 440 interviews conducted using a proxy for the full compulsory component and were classified as an adequate complete interview. For more information about response status by selected characteristics, refer to the Response Rates section of the Sampling chapter of this publication.
Data Processing and Coding
Introduction
Data processing procedures and checks are primarily designed to check data provided and to correct, where possible, any inconsistencies in the data.
Input coding
Input coding is the process by which certain data items were categorised during the interview. In the 2021-22 PSS, computer-assisted input coding was performed on the following data items:
- country of birth of all household members
- country of birth of respondent’s mother and father
- first language spoken as a child and main language spoken at home for the respondent
- highest level of non-school qualification and, if applicable, level of current study for the respondent
- relationships within the household
- visa type
- perpetrator type (for Violence and Stalking topics).
Interviewers were able to code from a list of the most common response categories (e.g. the ten most common languages spoken at home) or from a more comprehensive list contained within a 'trigram coder' (which allowed the interviewer to enter the first three letters of a response, then select the appropriate response from a pick list of options). Trigram coders are used to aid the interviewer with the collection of data for which there are detailed lists of output – primarily those associated with Standard Classifications – to eliminate the need for significant office coding. The trigram coders are complemented by manual coding of text fields in the event interviewers could not find an appropriate response amongst the commonly used options or via the trigram coder.
The following coders were utilised in the processing of the survey:
- Country of birth of respondent, their mother and father, and their current partner who they live with (where applicable) – Countries were classified according to the Standard Australian Classification of Countries (SACC), 2016.
- First language spoken as a child and main language spoken at home for the respondent – Languages were classified according to the Australian Standard Classification of Language (ASCL), 2016.
- Educational qualification – Level and field of highest non-school educational qualification and level and field of current study of respondent (where applicable) were coded to the Australian Standard Classification of Education (ASCED), 2001.
- Area data – Capital city, balance of state/territory, and remoteness areas are classified according to the Australian Statistical Geography Standard (ASGS): Volume 1 - Main Structure and Greater Capital City Areas, July 2016, Australian Statistical Geography Standard (ASGS): Volume 4 - Significant Urban Areas, Urban Centres and Localities, Section of State, July 2016, and Australian Statistical Geography Standard (ASGS): Volume 5 - Remoteness Structure, July 2016.
For more details on the ABS Standard Classifications used in the PSS, refer to the Classifications and Standards chapter of this publication.
Further information about the response categories available for each of the data items that use the ABS Standard Classifications can be found in the data item list available under Downloads.
Coding of free-form text responses
A small number of questions in the 2021-22 PSS contained an ‘Other’ response category as part of a pick list, which if selected then sequenced to a free-form text field for the recording of further details. These fields include:
- other payment period (income)
- other term used to describe sexual orientation (sexual orientation)
- other known perpetrator types (sexual harassment)
- other location behaviour happened (sexual harassment)
- other method by which sexual harassment perpetrated (sexual harassment)
- other relationship to known perpetrator(s) of abuse before the age of 15 (sexual and physical abuse)
- other reason for temporarily separating from current/previous partner
- other reason separated the last time from previous partner
- other places stayed during separations from current/previous partner
- other place stayed on first night after separation from current/previous partner
- other places stayed when relationship finally ended with previous partner
- other reaction experienced as a result of unwanted contact or attention (stalking).
For the coding of these categories, office staff assessed whether or not it was possible to re-code the stated response into an existing response category from the original question. Where this was possible, responses were manually re-coded. Otherwise, they were left in the ‘other’ category.
Edit checks
During office processing of the data, checks were performed on records to ensure that specific values lay within valid ranges, and relationships between items were within limits deemed acceptable for the purposes of the survey. These checks were also designed to detect errors which may have occurred during response entry and processing, and to identify cases which, although not necessarily errors, were sufficiently unusual or unexpected to warrant examination.
Data available from the survey are essentially ‘as reported’ by respondents. In some cases, it was possible to correct any identified errors or inconsistencies in the originally recorded data through reference to other data available in the same record, including interviewer comments. In other cases this was not always possible, and some minor errors and inconsistencies may remain on the data file. Wherever possible, known inconsistencies and irregularities are identified in the interpretation section of the relevant topic chapters in this publication.
Validation checks
The output data file was extensively validated through an item-by-item examination of input and output frequencies, checking populations through derivations, checking the internal consistency of items within and between different levels of the data file, and confrontation with results from previous Personal Safety Surveys. Despite these checks, it is still possible that some small errors remain on the data file.
Output datasets
Information from the survey is stored electronically in the form of data items. In some cases, items were formed directly from individual survey questions, while in others, items were derived from answers to multiple questions.
Only data from respondents who completed both the compulsory and voluntary content are retained on the final weighted file.
The output datasets from the 2021-22 PSS are hierarchical in nature and contain six different levels. A hierarchical file is an efficient means of storing and retrieving information which describes one to many, or many to many, relationships.
The structure of the 2021-22 PSS output datasets are as follows:
The top levels include:
- Household level – contains compositional and geographic information about the household, and household income.
- Person level (linked to household level) – contains socio-demographic information about the respondent and (if applicable) their current partner (who they are living with) including income, education, labour force and language information, as well as information about the respondent’s general feelings of safety, self-assessed health status, visa status, defence force service, housing, disability status, sexual orientation, social connectedness, and experiences of: sexual harassment, sexual or physical abuse before the age of 15, witnessing violence before the age of 15, economic abuse by a partner, and stalking. The person level also contains a significant number of aggregated data items produced from data contained on the levels outlined below. These aggregated data items provide only summary experience data (predominantly used to produce prevalence rates), with detailed information remaining on the lower topic-focused levels. For more details on these topics, refer to the relevant topic chapters contained within this publication.
Beneath the person level, there are four further levels (linked to the person level):
- Violence prevalence level – contains information about a respondent's experience of violence since the age of 15. The time frame of the most recent incident experienced by broad groupings of perpetrator type is available on this level for each of the 8 violence types collected, as well as for aggregated violence types. In addition, a detailed perpetrator type data item is available for use with the violence type data. For more details on this level, refer to the Violence - Prevalence chapter in this publication.
- Violence most recent incident level – contains detailed characteristics about a respondent's most recent incident (in the last 10 years) of up to 7 types of violence: physical/sexual assault by a male/female perpetrator, physical threat by a male/female perpetrator, and sexual threat by a male perpetrator (female respondents only). For more details on this level, refer to the Violence - Most Recent Incident chapter in this publication.
- Partner violence level – contains detailed information about a respondent's experience of violence by a current partner and/or most recently violent previous partner since the age of 15. For more details on this level, refer to the Partner Violence chapter in this publication.
- Partner emotional abuse level – contains information about a respondent's experience of emotional abuse by a current and/or most recent emotionally abusive previous partner since the age of 15. For more details on this level, refer to the Partner Emotional Abuse chapter in this publication.
A comprehensive list of data items available on each level described above is available under Downloads.
Household and Demographic Characteristics
Household Demographics
The 2021-22 PSS collected basic demographic information about each usual resident in the household via a household form.
The data produced (either from direct collection or derived) from the household form for each person includes:
- age
- sex
- registered marital status
- social marital status
- country of birth
- year of arrival (if born overseas)
- family composition.
For household demographic data, the data items and related categories are contained within the Household level tab (under Household characteristics) in the data item list available under Downloads. These are restricted to general household information such as household composition, number of persons living in the household, and number of persons living in the household by varying age groups.
For the person who was selected as the respondent (and, where applicable, their current partner), available data items and related output categories for this topic are contained within the SPS Level – Demographics tab (under General Demographics of Respondent/General Demographics of Partner) in the data item list available under Downloads. See Person Demographics in this chapter for a definition of current partner.
Methodology
The household form was completed by a usual resident of the household aged 18 years or over (referred to as an ‘ARA’ – any responsible adult). Therefore, all details are as known and reported by the ARA. An adult usual resident of the household was then randomly selected for a personal survey interview. The selected respondent may have been the ARA who completed the household form or another adult usual resident of the household. Approximately one-quarter of the selected survey respondents were not the ARA.
Age
Age was collected via the reporting of date of birth or the person’s age at last birthday.
Sex
Sex information was collected using the question ‘what is your/name’s sex’. The response categories available were ‘male’, ‘female’ and ‘another term’. Where ‘another term’ was selected, the ARA was asked to provide more detail.
The 2021-22 PSS was developed in 2019 prior to the release of the Standard for Sex, Gender, Variations of Sex Characteristics and Sexual Orientation Variables (2020). As such, some responses to the sex question may reflect gender rather than sex (or sex at birth) as determined by the ARA.
Registered marital status
Registered marital status was derived from several questions and was reported for persons aged 15 years and over in the household. Responses from these questions determined which of the following categories was applicable:
- never married
- widowed
- divorced
- separated
- married (in a registered marriage).
Social marital status
Social marital status was derived from several questions and was reported for persons aged 15 years and over in the household. Responses were classified as:
- Married – if living with another person in a couple relationship, which was reported as either a registered marriage or a de facto marriage. Includes persons living with a person of the same sex in a couple relationship.
- Not married – if not living with another person in a couple relationship. Includes persons living alone, with other family members, or in shared accommodation. Includes persons in a registered or de facto marriage whose partners were not usually resident in the household.
Country of birth
Country of birth (COB) was recorded using a picklist of 10 countries, or a country trigram coder (for more details on trigram coders see Data Processing and Coding chapter of this publication).
Each person was classified to the 2016 Standard Australian Classification of Countries (SACC). The SACC provides guidelines for consistent collection, aggregation, and dissemination of statistics by country. Standard output for this classification is discussed in the Classifications and Standards chapter of this publication.
Year of arrival in Australia
Year of arrival in Australia was recorded for each person in the household who was reported as having a country of birth other than Australia. The year specified was the year they first arrived in Australia to live for a period of one year or more. Individual year of arrival was recorded and can be grouped as required for output for the respondent (and their current partner, where applicable).
Persons not intending to live in Australia for one year or more were not in scope of the survey and not considered part of the household. Therefore, when identified, they were excluded from the data so as to not be included in household characteristic variables.
Family composition
To produce family composition information, the following information was collected:
- The relationship of each person in the household to the first person listed on the household form (referred to as the household reference person – HRP). If the person was not a parent, partner, child, or sibling to the HRP, information was collected on whether they were more closely related to someone else in the household and who this person was.
- To determine dependency of older children (aged 15-24 years), information was collected on whether 15-19 year-olds were attending secondary school. If not, they and persons aged 20-24 were asked if they were studying full-time for a certificate, diploma, degree or any other educational qualification.
Family composition enables the differentiation of families based on the presence or absence of couple relationships, parent-child relationships, child dependency relationships, or other familial relationships. Family composition is allocated based on whether the types of relationships described below are present or not, in the following order of precedence:
- Couple relationship – a registered or de facto marriage.
- Parent-child relationship – a relationship between two persons usually resident in the same household. The child is attached to the parent through a natural, adoptive, step, foster or child dependency relationship (see below for more information).
- Child dependency relationship – all children under the age of 15 years (whether related or unrelated to the family reference person) and those natural, adopted, step or foster children who were full-time students aged 15-24 years were identified as dependent. Those children aged 15-24 years who were not full-time students, and children aged 25 years and over, were identified as non-dependent.
- Other family relationships – all people related by blood or by marriage who were not covered by the above-described relationships.
In addition to detailed family composition data, family composition (in less detailed format) broken down by same-sex couple information is also produced.
Household composition
Households were allocated a household composition based on the following:
- The number of families present in a household and whether unrelated household members were present in a family household.
- In a non-family household, whether the number of household members was greater than one (lone person or group household).
For details on how families were determined, see Family composition above.
Person Demographics
In addition to the demographics data collected for all persons in the household outlined above, additional demographics were collected and/or produced for the selected respondent, including:
- family role
- sexual orientation
- whether respondent has a current partner
- whether respondent is in a same-sex relationship with current partner
- whether respondent has had a previous partner.
The data items and related output categories for this topic are contained within the SPS Level – Demographics tab (under General Demographics of Respondent) in the data item list, available under Downloads.
Definition of partner
The term ‘partner’ in the PSS is used to describe a person the respondent currently lives with, or lived with at some point, in a married or de facto relationship.
For the purposes of the PSS, current and previous partner have been defined as follows:
- Current partner – the person the respondent currently lives with in a married or de facto relationship
- Previous partner – a person the respondent lived with at some point in a married or de facto relationship, and from whom the respondent is now separated
Note: While respondents may consider a partner to be current, for the purposes of the survey, if their current partner was someone they have lived with but no longer lived with at the time of interview, they are defined as a previous partner. Current partner demographic information is only collected for the current partner the respondent was living with at the time of the survey.
Methodology
Family role
The family role of the respondent was produced using information from the relationship questions on the household form (see Family composition in Household Demographics section of this chapter) answered by the ARA. The categories identify whether the respondent was a parent, child or other relative within the family.
Sexual orientation
Sexual orientation was collected as part of the personal questionnaire.
Sexual orientation is an umbrella concept that encapsulates:
- sexual identity (how a person thinks of their sexuality and the terms they identify with)
- attraction (romantic or sexual interest in another person)
- behaviour (sexual behaviour).
Responses to a sexual orientation question are a subjective view of oneself and can change over the course of a person's lifetime and in different contexts. An individual could respond differently to questions on either sexual identity, attraction or behaviour.
Whether respondent has a current partner
Information about whether the respondent had a current partner was primarily collected via the household form, as determined by the ARA. For the definition of current partner for this survey, see Definition of partner above.
Whether respondent is in same-sex relationship with current partner
Information about whether the respondent was in a same-sex relationship with their current partner was produced using sex and relationship information collected from the household form as reported by the ARA. For the definition of current partner for this survey, see Definition of partner above.
Whether respondent has had a previous partner
Whether the respondent had ever had a previous partner was identified by two methods:
- the respondent reporting they had experienced violence by a previous partner
- through a specific question at the beginning of the emotional abuse topic which asked (respondents who hadn’t previously reported a previous partner) if they had ever lived with a previous partner.
For the definition of previous partner for this survey, see Definition of partner above.
Housing
The ABS housing standards provide standard methods for compiling statistics about the tenure, occupancy, and physical characteristics of Australian dwellings. The data items and related output categories for this topic are contained within the Household level tab in the data item list available under Downloads.
Tenure type
Tenure type describes the legal basis by which a person occupied a dwelling and includes the following categories:
- owner without a mortgage
- owner with a mortgage
- life tenure scheme
- participant of shared equity scheme
- renter
- rent-free
- other.
Landlord type
Landlord type classifies renting households, income units, and persons into the different types of contractual relationship one or more members of the counting unit has with the most immediate landlord external to the counting unit, to which rent is paid, or with whom the tenure contract or arrangement is made. It provides a more detailed break-down of the tenure categories 'renter', 'boarder' as well as 'rent-free'. The landlord type output categories include:
- real estate agent
- state or territory housing authority
- person not in the same household – parent/other relative
- person not in the same household – other person
- owner/manager of caravan park
- employer – government (incl. Defence Housing Authority)
- employer – other employer
- housing co-operative/community/church group
- other.
Number of bedrooms
Number of bedrooms refers to the number of rooms within a dwelling that are defined as bedrooms on the dwelling plans. This includes bedrooms which have been created or removed because of alterations and additions to the dwelling (such as built-in verandas, extensions, sunrooms, etc.) which the occupants of a dwelling consider to be bedrooms. Other rooms on the plans such as lounge, family or dining rooms which are used as bedrooms are excluded. A studio apartment or bedsitter is considered to have no bedrooms, as there is no separate room in which to sleep, and is classified as 0 bedrooms.
This item was collected and output as continuous and categorical items.
Housing Suitability
This variable is a measure of housing utilisation based on a comparison of the number of bedrooms in a dwelling with a series of household demographics, such as the number of usual residents, their relationship to each other, age, and sex. The criteria are based on the Canadian National Occupancy Standard. This variable can be used to identify if a dwelling is either under- or over- utilised by comparing the number of bedrooms required with the actual number of bedrooms in the dwelling. The output categories include:
- at least 4 more bedrooms needed
- 3 more bedrooms needed
- 2 more bedrooms needed
- 1 more bedroom needed
- none required / none spare
- 1 bedroom spare
- 2 bedrooms spare
- 3 bedrooms spare
- 4 bedrooms spare
- 5 or more bedrooms spare.
Household geography and Socio-economic indexes for areas (SEIFA)
Data from the 2021-22 PSS can be output for specific geographies from the Australian Statistical Geography Standard (ASGS), July 2016. In addition, the Index of Relative Socio-economic Disadvantage and the Index of Relative Socio-economic Advantage/Disadvantage is available.
There are limits to the extent to which survey data can be compiled for detailed geographies, particularly those with smaller populations. The ability of the survey to provide reliable estimates is dependent upon factors such as the number of persons sampled within a particular area and the level of disaggregation required (that is, the number of variables cross-classified/level of detail required for each variable).
In addition, it should be remembered that the male sample was designed to produce reliable national estimates, whereas the female sample was designed to both produce reliable national and state/territory estimates. Therefore, the ability to use more detailed geography will be limited by the sample design as well as the achieved sample.
The data items and related output categories for this topic are contained within the Household level tab in the data item list available under Downloads.
State or territory of usual residence
States and territories are the largest units in the geographical classification. State/territory units are political entities with fixed boundaries. This survey recognised the following units:
- New South Wales (NSW)
- Victoria (VIC)
- Queensland (QLD)
- South Australia (SA)
- Western Australia (WA)
- Tasmania (TAS)
- Northern Territory (NT)
- Australian Capital Territory (ACT)
Greater Capital City Statistical Areas
Greater Capital City Statistical Areas (GCCSA) are designed to represent the functional area of each of the eight state and territory capital cities, which includes populations who regularly socialise, shop or work within the city, but may live either in the city or in the small towns and rural areas surrounding the city. Within each state and territory, the area not included in the GCCSA is represented by a ‘balance of state’ region.
With the exception of the ACT, households in each state and territory are classified into one of two categories, depending on the household's location:
- capital city
- balance of state.
All households in the ACT are classified as 'capital city' as the whole of the ACT is included in the GCCSA.
Remoteness Areas
The Remoteness Areas (RAs) divide Australia into broad geographic regions that share common characteristics of remoteness for statistical purposes. The Remoteness Structure divides each state and territory into several regions based on their relative access to services. There are five classes of RA in the Remoteness Structure: Major Cities of Australia, Inner Regional Australia, Outer Regional Australia, Remote Australia, and Very Remote Australia. RAs are based on the Accessibility and Remoteness Index of Australia (ARIA+) produced by the Hugo Centre for Population and Migration Studies at the University of Adelaide.
For the PSS, only the first four remoteness areas are available. Persons residing in very remote areas were not in scope of the survey.
Section of State
Section of State (SOS) groups Urban Centres and Localities into classes of urban areas based on population size, and the remainder is considered to be rural. The population sizes are based on the 2016 Census of Population and Housing.
SOS provides the broadest definition of ‘urban’ and ‘rural’ Australia and enables statistical comparisons of differently sized urban centres and the balancing 'rural areas'. It separates each state or territory into up to 4 classes of urban or rural:
- major urban – represents a combination of all Urban Centres with a population of 100,000 or more
- other urban – represents a combination of all Urban Centres with a population between 1,000 and 99,999
- bounded locality – represents a combination of all Localities (can include some large localities with a population greater than 1000)
- rural balance – represents the remainder of state/territory.
The SOS categories of 'major urban' and 'other urban' are regarded as 'urban'.
The SOS categories of 'bounded locality' and 'rural balance' are regarded as 'rural'.
Socio-Economic Indexes for Areas (SEIFA)
Socio-Economic Indexes for Areas (SEIFA) is a product developed by the ABS that ranks areas in Australia according to relative socio-economic advantage and disadvantage. It is a suite of four indexes that have been created from social and economic information collected through the Census. Each index ranks geographic areas across Australia in terms of their relative socio-economic advantage and disadvantage. The ABS broadly defines relative socio-economic advantage and disadvantage in terms of people's access to material and social resources, and their ability to participate in society.
The PSS includes two of the available indexes. These are the:
- Index of Relative Socio-Economic Disadvantage – This index ranks areas on a continuum from most disadvantaged to least disadvantaged. A low score on this index indicates a high proportion of relatively disadvantaged people in an area. However, it cannot be concluded that an area with a very high score has a large proportion of relatively advantaged people, as there are no variables in the index to indicate this. It can be concluded that such an area has a relatively low proportion of disadvantaged people.
- Index of Relative Socio-Economic Advantage/Disadvantage – This index ranks areas on a continuum from most disadvantaged to most advantaged. An area with a high score on this index has a relatively high proportion of advantaged people and a relatively low proportion of disadvantaged people.
The SEIFA indexes used for PSS are calculated at the national level, with the indexes output as both a score and in deciles. The PSS provides the indexes using SA1 (Statistical Area Level 1) as a base area.
For more details on SEIFA refer to 2033.0.55.001 - Census of Population and Housing: Socio-Economic Indexes for Areas (SEIFA), Australia, 2016.
Ancestry and language
Population
Information about ancestry and language was obtained from men and women aged 18 years and over in the 2021-22 PSS.
In addition, where a respondent had a current partner who they were living with at the time of the survey, broad information about the first language spoken as a child and main language spoken at home was collected about the current partner as well.
Definition
Ancestry is based on the country of birth (COB) of the respondent and the respondent’s father and mother. For details on the collection of COB of the respondent, see Household and Demographic Characteristics chapter of this publication.
For COB output purposes, main English-speaking overseas countries (MESC) include Canada, the Republic of Ireland, New Zealand, South Africa, the United Kingdom and the United States of America.
Methodology
Country of Birth of Parents
Information about country of birth (COB) was collected for the respondent’s mother and father. This was not asked about their current partner.
The top ten countries of birth, as determined via the 2016 Census of Population and Housing, were available to select from initially. Otherwise, if the response was not one of these, a trigram coder was available to select a response. See Data Processing and Coding chapter for more details on use of trigram coders.
If the respondent did not know the country of birth of their parents due to adoption or other reasons, they could identify country of birth as unknown.
The responses for the country of birth of parents data items were coded to the Standard Australian Classification of Countries (SACC), 2016 (with updates through to 2019 included). The SACC provides guidelines for the consistent collection, aggregation, and dissemination of statistics by country. Standard output for this classification is discussed in the Classifications and Standards chapter of this publication.
First and Main Language spoken
Information about the respondent’s first language spoken as a child and main language spoken at home was collected.
The top ten languages, as determined via the 2016 Census of Population and Housing, were available to select from initially. Otherwise, if the response was not one of these, a trigram coder was available to select a response. See Data Processing and Coding chapter for more details on use of trigram coders.
The responses were coded to the Australian Standard Classification of Languages (ASCL), 2016. The abbreviated classification used in most standard outputs is shown in the Classifications and Standards chapter of this publication.
Where the respondent had a current partner living with them, they were also asked to provide first and main language spoken on behalf of their partner. The only response categories available were ‘English’ and ‘other language’. Current partners were not approached to provide their own details. If the respondent did not know or did not wish to provide this information on behalf of their current partner, a ’Don’t know’ category was available to select.
Proficiency in Spoken English
Respondents who reported they mainly spoke a language other than English at home, or who first spoke a language other than English as a child, were asked how well they spoke English. These self-assessed responses were recorded against the following categories:
- very well
- well
- not well
- not at all.
Respondents whose main language was sign language or Auslan, and respondents who identified as mute, were not asked this question and have been assigned to the response category of ‘Not stated’.
Proficiency in spoken English was not asked for the respondent’s current partner.
Data items
The data items and related output categories for this topic are contained within the SPS Level – Demographics tab in the data item list available under Downloads.
Data uses
Data for this topic has been collected to examine the relationship between the ancestry/language spoken of respondents and their experiences of violence. Current partner data for this topic can be used to further understand the characteristics of violent and non-violent current partners.
Data items from this topic should not be used on their own to produce general population estimates of ancestry and language spoken. The Census is a more appropriate source of this data.
Interpretation
Points to be considered when using and interpreting data from this topic include the following:
- Respondents who are unable to speak English, and for whom an ABS translator was not available, are offered a proxy interview where another member of the household could answer the compulsory questions on the respondent’s behalf. As such, there may be an under representation of people with limited English language skills in the survey. For more details, refer to Proxy Interviews in the Survey Procedures section of the Survey Development and Data Collection chapter of this publication.
- Proficiency in spoken English is a self-assessed measure based on the respondent’s own perception of how well they speak English.
- The collection of ancestry information in the PSS is defined in terms of country of birth, which does not necessarily reflect the respondent’s self-identified cultural, ethnic, or linguistic background. Similarly, for respondents with adoptive parents, the country of birth of step-parents or guardians may not necessarily reflect the self-declared ancestry of the respondent.
Comparability with previous surveys
The table below outlines the comparisons of classifications between the 1996 Women’s Safety Survey and each of the PSS cycles.
| 1996 Women’s Safety Survey | 2005 Personal Safety Survey | 2012 Personal Safety Survey | 2016 and 2021-22 Personal Safety Survey |
|---|---|---|---|---|
COB of respondent | Broad COB data considered comparable with 2005, 2012, 2016 and 2021-22. | Broad COB data considered comparable with 1996, 2012, 2016 and 2021-22. | Broad COB data considered comparable with 1996, 2005, 2016 and 2021-22. | Broad COB data considered comparable with 1996, 2005 and 2012 |
Used COB classification Australian Standard Classification of Countries for Social Statistics (ASCCSS), 1990 | Used COB classification Australian Standard Classification of Countries for Social Statistics (ASCCSS), 1990
| Used COB classification Australian Standard Classification of Countries (SACC), Second Edition.
| Used Standard Australian Classification of Countries (SACC), 2016 (note that 2021-22 applied changes made to Standard through to 2019).
| |
COB of parents | Broad COB data considered comparable with 2016 and 2021-22. | Not collected
| Not collected
| Broad COB data considered comparable with 1996. |
Used COB classification Australian Standard Classification of Countries for Social Statistics (ASCCSS), 1990 | Used Standard Australian Classification of Countries (SACC), 2016 (note that 2021-22 applied changes made to Standard through to 2019). | |||
Language | Not collected
| Broad language data considered comparable with 2012, 2016, and 2021-22. | Broad language data considered comparable with 2005, 2016, and 2021-22. | Broad language data considered comparable with 2005 and 2012. |
Used Australian Standard Classification of Language (ASCL), 2005-06.
| Used Australian Standard Classification of Language (ASCL), 2005-06.
| Used Australian Standard Classification of Languages (ASCL), 2016.
|
Current partner data is very limited in 2021-22 due to the reduced scope of the language categories collected. Any data comparisons across time undertaken on characteristics of partners who do or do not use violence should take this into account.
Visa status
Population
In the 2021-22 PSS, information about visa status was obtained from men and women aged 18 years and over, who were born overseas and had arrived in Australia in the 10 years prior to the survey.
People who had arrived in the 12 months prior to the survey and were not intending to stay for more than 12 months were out of scope for the PSS.
Definition
This topic refers to the current visa type and residency status of the respondent and whether the respondent was the main applicant for their visa.
A visa is permission or authority granted to foreign nationals by the Australian Government to travel to, enter and/or remain in Australia for a defined period of time or indefinitely.
Main applicant for current visa
The 'main applicant' is the person whose skills or proposed activities in Australia are assessed as part of their visa application. The visa is granted to the main applicant, and any secondary applicant(s) (i.e. spouse or dependents). The respondent for this survey may not have been the main applicant for the visa.
Current residency status
Current residency status refers to whether the Australian Government has granted permission or authority to the person to live in Australia permanently or temporarily. For those granted temporary status, they are allowed to either stay for a specified period, stay until a specific event happens, or stay while they have a specified status.
Current visa type
Current visa type refers to the type of visa applied for e.g. student, skilled, humanitarian, or family. This provides information on the visa criteria which the main applicant needs to have met.
Methodology
Respondents were first asked whether they were an Australian or New Zealand citizen. If they were, no further questions were asked for this topic.
Non-Australian/New Zealand citizens were asked to identify if they were the main applicant for the visa followed by the 3-digit subclass number code or name of the visa. The name/code was able to be selected from a trigram coder. For respondents who knew the code/name of their visa, no further questions were asked. If they were unable to find the name/code in the trigram or did not know it, they could select ‘not listed’/’Visa number or name not known’. See Data Processing and Coding chapter for more details on use of trigram coders.
Where a respondent did not know the specific name of the visa they held or the visa type was not listed, additional questions were asked to assist with determining the type of visa. These questions included:
- the residency status of the current visa
- the type of current visa
- whether a points test was met by the main applicant
- whether the main applicant was sponsored.
As soon as sufficient information had been collected to determine the type of visa, no further questions were asked.
Data items
The data items and related output categories for this topic are contained within the SPS Level – Demographics tab in the data item list available under Downloads.
Data uses
Data for this topic was collected to examine recent migrants’ experiences of violence.
Data items from this topic should not be used on their own to produce general population estimates of visa holders. For more detailed information on visa holders and their characteristics see Permanent migrants in Australia, and Temporary visa holders in Australia.
Interpretation
Points to be considered when using and interpreting data from this topic include the following:
- The population focus for this topic is on persons who arrived in Australia in the 10 years prior to the survey. It excludes persons who arrived in the 12 months prior to the survey and were not planning to stay for more than 12 months.
- As the survey was conducted throughout 2021 and 2022, the start of the 10-year period prior to the survey may be either 2011 or 2012.
- Of persons in the approached sample who were not born in Australia and arrived in the 10 years prior to the survey, 77.8% were fully responding.
Comparability with previous surveys
Visa status information was not collected prior to 2021-22.
Education
Population
Information about educational background and current study status was obtained from men and women aged 18 years and over in the 2021-22 PSS. For persons who were undertaking current study (students), information was collected about the level and main field of current study, and the type of educational institution studied at.
In addition, where a respondent had a current partner who they were living with, information about the current partner’s educational background was also collected.
Definitions
Level of highest educational attainment refers to a person’s overall highest level of educational attainment, whether it be a school or non-school qualification, regardless of the particular field of study or the type of institution in which the study was undertaken.
Highest year of school completed refers to the highest level of primary or secondary schooling completed. For school years up to and including Year 11, the term 'completed' means to attend for the full school year such that progression to the following year of school is enabled. For Year 12, 'completed' requires only attendance for the full year. Further details of the definitions used are available on request.
The definition of having ‘completed’ a non-school qualification refers to successfully passing all the required assessments or examination.
Non-school qualifications are awarded for educational attainments other than those of pre-primary, primary or secondary education. However, non-school qualifications may be attained concurrently with school qualifications. Non-school qualifications do not include courses that provide a Statement of Attainment or Non-award courses.
Methodology
Respondents were asked to provide information regarding their highest year of school completed, their highest non-school qualification, and their current study status.
Respondents with a current partner who they were living with were also asked if their partner had completed a trade certificate, diploma, degree, or any other educational qualification (apart from school-level). If so, they were then asked only for the level of the highest qualification completed using the broad categories outlined in the Non-school educational attainment section below. Current partners were not approached to provide their own details.
Highest year of school completed
Respondents were asked to provide the highest year of (primary or secondary) school they had completed, based on the following:
- year 12 or equivalent
- year 11
- year 10
- year 9
- year 8 or below
- never attended school.
Non-school educational attainment
Respondents were asked if they had completed a trade certificate, diploma, degree, or any other educational qualification (apart from school-level). Those who had were asked to provide details of the level of the highest qualification they had completed, and the main field of study for this qualification.
The level and main field of highest non-school qualification was determined according to the Australian Standard Classification of Education (ASCED), 2001.
The level of highest non-school qualification is available in broad (collapsed) categories as listed below:
- Postgraduate degree
- Graduate diploma/graduate certificate
- Bachelor degree
- Advanced diploma/diploma
- Certificate III/IV
- Certificate I/II
- Certificate not further defined
- Level not determined.
The main field of highest non-school qualification completed was collected via an open text field which was later coded using the ASCED 2001. It is output as 12 broad fields of education, as listed below:
- Natural and physical sciences
- Information technology
- Engineering and related technologies
- Architecture and building
- Agriculture, environmental and related studies
- Health
- Education
- Management and commerce
- Society and culture
- Creative arts
- Food, hospitality, and personal services
- Mixed field programmes
- Field not determined.
For output, respondents (and their current partner, where applicable) were also categorised to an overall level of highest educational attainment, based on the following broad categories in descending order:
- Postgraduate degree
- Graduate diploma/graduate certificate
- Bachelor degree
- Advanced diploma/diploma
- Certificates III/IV
- Year 12 or equivalent
- Year 11
- Year 10
- Certificates I/II
- Year 9 and below
- Certificate not further defined
- Level not determined (non-school only).
Current study status
This data item describes whether the respondent is currently studying full-time, studying part-time, or not currently studying.
Information about level of current study and main field of current study were collected on the same basis as the educational attainment data items described above.
Type of educational institution
This data item describes the type of educational institution attended by people who were full-time or part-time students. It is applicable to all people who indicated they were currently attending an educational institution. Output categories include:
- secondary school/technical college
- university/other higher education
- TAFE/institute of technology
- other organisation.
Engagement in education or employment
This data item indicates whether a person was engaged in work and/or study. The term 'engagement' is used when assessing a person's level of participation in employment and education.
Fully engaged includes persons who were engaged in either full-time work or study or who combine any hours of work with any hours of study. Partially engaged includes persons who are either employed part-time or studying part-time. Output categories include:
- full-time study and full-time employment
- primarily engaged through full-time study
- primarily engaged through full-time employment
- part-time study and part-time employment
- part-time study only
- part-time employment only
- no study or employment.
Data items
The data items and related output categories for this topic are contained within the SPS Level – Education tab in the data item list available under Downloads.
Data uses
Data for this topic has been collected to examine the relationship between educational characteristics and experiences of violence. Current partner data for this topic can be used to further understand the characteristics of current partners that do and do not use violence.
Data items from this topic should not be used on their own to produce general population estimates of educational qualifications and attendance. The Census and the Survey of Education and Work are more appropriate sources of this data.
Interpretation
Points to be considered when using and interpreting data from this topic include the following:
- Details about the education of the current partner were collected via the respondent. Therefore, the information is based on the knowledge the respondent had of their partner’s educational background. If the respondent did not know or declined to provide details about their current partner’s education, a ‘not known’ response category was available and is included in the current partner output items.
- Responses are based on the current educational and employment characteristics of the respondent at the time of interview and may not be reflective of their characteristics at the time they experienced violence. It is recommended that these data items are used only when examining recent experiences of violence (i.e. in the previous 12 or 24 months), as characteristics are more likely to have changed over longer timeframes.
Comparability with previous surveys
Education data items in the 2021-22 PSS are comparable with the 2005, 2012, and 2016 PSS cycles. The following should be considered when undertaking any comparisons with the 1996 WSS or with current partner education data items from previous PSS cycles:
- A change in the classification used to code qualification information occurred between the 1996 WSS and the 2005 PSS. The WSS was coded to the Australian Bureau of Statistics Classification of Qualifications (ABSCQ), while the PSS used the Australian Standard Classification of Education (ASCED) 2001. As such, it is necessary to utilise the correspondence tables for ABSCQ and ASCED to conduct any comparisons.
- In 2021-22, for their current partner’s highest level of non-school qualification, respondents were asked to select from a list of provided categories based on the ASCED (with some examples provided to assist with this), whereas in previous cycles respondents were asked to provide details about the highest level and main field of non-school qualification which were then coded using the ASCED.
The data items ‘main field of highest educational attainment’, ‘current study status’, ‘level of current study’, ‘main field of current study’, ‘type of educational institution’, and ‘engagement in education or employment’ are new in 2021-22, and therefore comparative data from previous cycles are not available.
Employment and Australian Defence Force
Population
Information about employment and Australian Defence Force service was obtained from men and women aged 18 years and over in the 2021-22 PSS. In addition, where a respondent had a current partner who they were living with, information about their employment was also collected.
Definitions
- Employed persons were those aged 18 years and over who reported that, in the week preceding the survey, they had worked in a job, business or farm, or had a job but were absent during that week.
- Unemployed persons were those aged 18 years and over who were not employed in the reference week, but actively looked for work during the previous four weeks and were available to start or waiting to start work within the following four weeks.
The following persons were also classified as unemployed:
- Persons who usually work less than 1 hour per week.
- Persons who only have unpaid volunteer or trainee work arrangements.
Persons not in the labour force were those aged 18 years and over who were neither employed nor unemployed, as defined above.
For most employment related data items, data relates to the respondent's main job. For respondents who had more than one job at the time of the survey, the main job was defined as the paid job in which they usually worked the most hours.
Methodology
Employment information for the respondent was collected using the short-form version of the questions used in the monthly ABS Labour Force Survey.
For respondents with a current partner, a single question was used, which asked the respondent to identify which of the specified categories best described their partner’s employment status. The categories provided were similar to those outlined in the Labour force status section below.
Labour force status
Information about the full-time/part-time labour force status of the respondent was collected. The output data item includes the following categories:
- employed full-time (if usually work 35 hours or more a week in all jobs)
- employed part-time (if usually worked one hour to less than 35 hours a week in all jobs)
- unemployed looking for full-time work only (actively seeking full-time work in last 4 weeks)
- unemployed looking for part-time work only (actively seeking part-time work in last 4 weeks)
- unemployed, looking for full-time or part-time work (actively seeking full-time or part-time work in last 4 weeks)
- not in the labour force.
Status in employment in main job
This data item is new in 2021-22 and defines a person’s employment status for the main job held in the week prior to the survey. Classification categories include:
- employee
- owner manager of incorporated enterprise with employees
- owner manager of incorporated enterprise without employees
- owner manager of unincorporated enterprise with employees
- contributing family worker.
Hours worked
Refers to reported hours usually worked (in all jobs) per week by the respondent. Hours in single units are recorded and are available for output. Standard groupings of hours are:
- 1 to 9
- 10 to 19
- 20 to 29
- 30 to 34
- 35 to 39
- 40 to 44
- 45 to 49
- 50 to 59
- 60 to 69
- 70 and over.
Duration of job search
Duration of job search refers to the period of time from when a person began looking for work (or ceased employment) to the date of the survey. For persons who began looking for work while still employed, the item refers to the period from the time the person last worked until the date of interview.
The data is output as both a continuous variable item, measured in completed weeks, and a categorical variable item, grouped into the following time periods:
- under 4 weeks
- 4 weeks and under 13 weeks
- 13 weeks and under 26 weeks
- 26 weeks and under 52 weeks
- 52 weeks and under 104 weeks
- 104 weeks and over.
Information about the number of weeks since last worked was also collected separately for respondents classified as unemployed and is output as both a continuous variable item and a categorical variable item, using the same time period groupings as those above for duration of job search.
Occupation in main job/Industry of main job
Respondents who were employed were asked to provide details about their occupation and industry of their main job. Open text responses were then coded to ABS standard classifications.
Industry of employment is coded to the Australian and New Zealand Standard Industrial Classification (ANZSIC), 2006 (Revision 2.0). Division-level categories include:
- Agriculture, Forestry and Fishing
- Mining
- Manufacturing
- Electricity, Gas, Water and Waste Services
- Construction
- Wholesale Trade
- Retail Trade
- Accommodation and Food Services
- Transport, Postal and Warehousing
- Information Media and Telecommunications
- Financial and Insurance Services
- Rental, Hiring and Real Estate Services
- Professional, Scientific and Technical Services
- Administrative and Support Services
- Public Administration and Safety
- Education and Training
- Health Care and Social Assistance
- Arts and Recreation Services
- Other Services.
Occupation is coded using the Australian and New Zealand Standard Classification of Occupations (ANZSCO), 2013, Version 1.3. Major group categories include:
- Managers
- Professionals
- Technicians and Trades Workers
- Community and Personal Service Workers
- Clerical and Administrative Workers
- Sales Workers
- Machinery Operators and Drivers
- Labourers.
For both items, where insufficient information was provided in a text response for assigning a code, an 'inadequately described' code was allocated during processing, while 'not further defined' categories are used when there was insufficient information to code the response to a detailed category in the classifications.
Australian Defence Force
For the first time, the 2021-22 PSS asked respondents whether they had ever served in the Australian Defence Force, including both regular and reserves service in the Australian Army, Royal Australian Navy, and Royal Australian Air Force.
Data items
The data items and related output categories for this topic are contained within the SPS Level – Employment tab in the data item list available under Downloads.
Data uses
Data for this topic has been collected to examine the relationship between labour force status and experiences of violence. Current partner data for this topic can be used to further understand the characteristics of current partners that do and do not use violence.
Data items from this topic should not be used on their own to produce population estimates of labour force participation. The monthly ABS Labour Force Survey is a more appropriate source for this data.
Interpretation
Points to be considered when using and interpreting data from this topic include the following:
- Responses are based on the current labour force status of the respondent at the time of interview and may not be reflective of their labour force status at the time they experienced violence. It is recommended that these data items are used only when examining recent experiences of violence (i.e. in the previous 12 or 24 months), as characteristics are more likely to have changed over longer timeframes.
- Labour force status information for the respondent was collected using a short-form version of the questions used in the monthly ABS Labour Force Survey. A single question was asked to determine the current partner’s employment status.
- Labour force status of current partner was collected via the respondent. If the respondent did not know or declined to provide information about their current partner’s employment details, a ‘Don’t know’ response category was available and is included in the current partner output item.
Comparability with previous surveys
Labour force status data in the 2021-22 PSS is comparable with the 1996 Women's Safety Survey and the 2005, 2012, and 2016 PSS cycles. However, the following should be considered:
- Prior to 2012, people who worked less than 1 hour were classified as employed, whereas from 2012 onwards they are classified as unemployed or not in the labour force.
- Prior to 2016, for the data items 'duration of unemployment' and 'time since last worked,' the PSS asked the respondent when they last worked for 2 weeks or more, whereas from 2016 onwards the PSS asked when the respondent last worked, regardless of duration.
- Occupation in main job and industry of main job are new data items in 2021-22, therefore comparative data from previous cycles in not available.
- In 2021-22, current partner employment data was collected via a single question, whereas previous cycles used the short-form labour force question set. Therefore, the current partner’s labour force status was selected by the respondent from a set of response categories, rather than the status being derived based on a series of questions.
Income
Population
Information regarding income was obtained from men and women aged 18 years and over in the 2021-22 PSS.
Definition
The income topic collected information about the sources and amounts of income for the respondent, their current partner (where applicable), and any other persons aged 15 years and over who were usual residents of the household. Income information for all members of the household was collected from the respondent, however the respondent had the option of choosing not to provide income information for themselves and/or other household members.
In the PSS, income data refers to gross income received at the time of survey i.e. the total amount earned from all income sources before taxes and other deductions.
Personal (respondent) income
This refers to the total gross personal weekly income that the respondent received from all income sources.
Current partner income
This refers to the total gross personal weekly income that the respondent’s current partner received from all income sources.
Couple income
Total weekly couple income was calculated by summing the respondent’s and their current partner’s weekly income amounts.
As it is not possible to derive couple income without both contributing amounts, where either the respondent or their current partner’s income was not provided, the couple income was set to 'not known/not stated.'
Household income
Household income was calculated by summing income amounts provided for:
- the respondent
- the respondent’s current partner (where applicable)
- any other persons aged 15 years and over who were usual residents of the household.
As it is not possible to derive household income without all contributing amounts, where income information was not provided for one or more household members, the household income was set to ‘not known/not stated’
For lone person households, household income was identical to the personal income of the respondent.
Equivalised household income
Equivalence scales are used to adjust the actual incomes of households so that the relative well-being of households of differing sizes and compositions are able to be compared. For example, it would be expected that a two-person household would usually need more income than a lone person household, if the two households are to enjoy the same standard of living.
Equivalised income was calculated by deriving an equivalence factor according to the chosen equivalence scale, and then dividing income by the factor. The equivalence factor, derived using the 'modified OECD' equivalence scale, is determined by allocating the following points to each person in a household:
- the first adult in the household is given a weight of 1 point
- each additional person aged 15 years or older is allocated 0.5 points
- each child aged 0-14 years is allocated 0.3 points.
Equivalised household income was derived by dividing the total household income by a factor equal to the sum of the equivalence points allocated to the household members. The equivalised income of a lone person household is the same as its actual income. The equivalised income of a household comprising more than one person lies between the total value and the per capita value of its actual income.
When actual household income is negative, such as when a loss is reported for an individual's unincorporated business or other investment income, and this loss is greater than the positive income from other sources, then equivalised household income is set to 0.
Income deciles
Income deciles are groupings that result from ranking all persons/households in the population from lowest to highest income, and then dividing the population into 10 equal groups, each comprising 10% of the total population. The lowest decile contains the bottom 10% of income earners, the second decile contains the next 10%, and so on, with the highest decile containing the top 10% of income earners.
In the 2021-22 PSS, income deciles were calculated on the weighted population and are output for:
- personal/current partner gross weekly income
- couple gross weekly income
- household gross weekly income
- equivalised household gross weekly income.
For current partner income, the decile groupings calculated using respondent income (personal gross weekly income) were applied.
Income which is not known or not stated is excluded from the calculation of deciles. In addition, persons who are not in a couple relationship (i.e. not living with a partner) are excluded from the calculation of the couple income deciles.
Income decile ranges
The dollar amounts contained in each decile are shown in the following table:
| Decile | Personal/Current partner income | Couple income | Household income |
|---|---|---|---|
| 1 | Less than 238 | Less than 760 | Less than 576 |
| 2 | 239-423 | 761-1054 | 577-900 |
| 3 | 424-522 | 1055-1530 | 901-1228 |
| 4 | 523-717 | 1531-1937 | 1229-1640 |
| 5 | 718-959 | 1938-2436 | 1641-2062 |
| 6 | 960-1218 | 2437-2840 | 2063-2589 |
| 7 | 1219-1534 | 2841-3270 | 2590-3083 |
| 8 | 1535-1918 | 3271-3931 | 3084-3817 |
| 9 | 1919-2600 | 3932-4795 | 3818-4833 |
| 10 | 2601 or more | 4796 or more | 4834 or more |
Methodology
Sources and amount of personal income
Respondents were first asked to identify all their sources of income from the following broad response categories:
- wages and salaries (including from own incorporated business)
- any government pension, benefit or allowance
- superannuation, an annuity or private pension
- profit or loss from own unincorporated business or share in a partnership
- profit or loss from rental investment property
- any other regular sources (such as interest, dividends, scholarships, silent partnerships, child support, workers’ compensation).
If respondents received a government pension, benefit, or allowance, they were provided with two lists from which to select the type(s) they received. These lists have not been produced for output.
The first list contained the following payment types for which only one type (or none) could be selected:
- Australian Age Pension
- Service Pension from the Department of Veterans' Affairs. Excluding Defence Force superannuation benefits
- Disability Support Pension from Centrelink
- JobSeeker Payment
- Paid Parental Leave
- Carer Payment
- Partner Allowance
- Widow Allowance from Centrelink
- Sickness Allowance
- Special benefit.
Respondents were able to select more than one type (or none) from the second list containing:
- Family Tax Benefit as a regular payment from Centrelink
- Parenting Payment
- Youth Allowance
- Carer Allowance
- War Widow's or Widower's Pension from the Department of Veterans' Affairs, including Income Support Supplement
- Disability Pension from the Department of Veterans' Affairs
- Austudy/ABSTUDY
- Overseas government pension
- any other government payment.
For each individual broad source of income (noting that government pension is split into two broad groups), respondents were asked to provide the amount of income received (in single dollars) as well as the period the reported income covered.
Where a respondent indicated that they earned income from any of the following two sources, they were asked to specify whether the income was a profit or loss:
- unincorporated business income
- rental income.
This resulted in both positive and negative income amounts being represented in the data. Negative income occurs if losses from these two sources are greater than any income, benefits or allowances received from other sources. The option of choosing “neither” profit or loss was available for respondents who earned zero income from the income source.
Personal income questions could be skipped if respondents were unable or unwilling to provide details of sources of income or specific income amounts. However, to reduce the amount of missing income information, the following occurred:
- For respondents unable or unwilling to provide details of the source(s) of income they received, they were asked whether they could provide the combined total income from all sources (in single dollars or, if not, select from a list of ranged income amounts).
- For respondents who identified the source(s) of income they received but were unable or unwilling to provide single dollar income details for an individual source of income, they were asked whether they could select from a list of ranged income amounts.
For respondents who selected a ranged income category a specific amount was allocated for the relevant source’s continuous income item (or total income item where no source was identified). This amount was determined by calculating the median of the range using data from respondents who provided a specific amount within that range. If no-one provided a specific income amount within the range then the middle of the range was used.
Respondents who continued not to disclose their personal income information were coded to the ‘personal income not known/not stated’ category.
Where a respondent indicated that they received income from multiple sources and it was not possible to calculate the main source of income from the income amounts provided (e.g. one or more income amounts was not known or specified as a range), they were also asked to identify their main source of personal income.
Sources and amount of current partner income
Respondents who had a current partner living with them were asked to provide details of their partner’s income. Interviewers were instructed that they and the respondent were not to obtain the current partner’s income information directly from the current partner. The information provided by the respondent was taken as the answer.
The respondent was first asked to provide all of their current partner’s sources of income. These broad sources were the same as those collected for the respondent’s personal income.
The total combined pre-tax income amount received from all sources was then collected in single dollar values (positive or negative), as well as the period the reported amount covered.
Partner income questions could be skipped if respondents were unable or unwilling to provide details of sources of income or the total income amount. However, to reduce the amount of missing income information, the following occurred:
- For respondents who were unable or unwilling to provide details of their partner’s source(s) of income, they were asked whether they could provide the combined total income from all sources (in single dollars or, if not, select from a list of ranged income amounts).
- For respondents who identified the source(s) of income their partner received but were unable or unwilling to provide the combined total income from all sources, they were asked whether they could select from a list of ranged income amounts.
For respondents who selected a ranged income category for their partner’s income, a specific amount was allocated to the total income item. This amount was determined by calculating the median of the range using data from respondents who provided a specific amount for their partners income within that range. If no-one provided a specific income amount within the range then the middle of the range was used.
Respondents who continued not to disclose their partner’s income information were coded to the ‘partner income not known/not stated’ category.
Sources and amounts of household income
To produce data for sources of and total household income, respondents were also asked to provide combined income information for all of the other non-selected persons aged 15 years and over who were usual residents of the household.
The respondent was first asked to provide all of the sources of income for these remaining household members. These broad sources were the same as those collected for the respondent’s personal income.
They were then asked to provide the total combined pre-tax income (positive or negative) for these remaining household members, as well as the period the reported amount covered.
Household income questions could be skipped if respondents were unable or unwilling to provide details about the sources of income or the total income amount for other members of the household aged 15 years and over. However, to reduce the amount of missing income information, the following occurred:
- For respondents who were unable or unwilling to provide details about household members’ source(s) of income, they were asked whether they could provide the combined total income of all household members from all sources (in single dollars or, if not, select from a list of ranged income amounts).
- For respondents who identified the source(s) of income but were unable or unwilling to provide the combined total income of all household members from all sources (in single dollars), they were asked whether they could select from a list of ranged income amounts.
For respondents who selected a ranged income category for household members, a specific amount was allocated to the total income item. This amount was determined by calculating the median of the range using data from respondents who did provide a specific amount within that range for other household members. If no-one provided a specific income amount within the range then the middle of the range was used.
Respondents who continued not to disclose the total income of other members of their household were coded to the ‘household income not known/not stated’ category.
If it was not possible to determine the main source of household income using information collected from the personal income, partner income and household income topics, the respondent was asked identify the main source of income for the entire household, considering their own income and the income of all other household members.
Data items
The data items and related output categories for personal (respondent) and current partner income are contained within the SPS Level – Income tab, and for household income within the Household level tab, in the data item list available under Downloads.
Data uses
Data for this topic was collected to examine the relationship between income and experiences of violence.
Data items from this topic should not be used on their own to produce general population estimates of income. The Census and the Survey of Income and Housing are more appropriate sources of this data.
Interpretation
Points to be considered when using and interpreting data from this topic include the following:
- Details about the income of other household members, including a current partner, are collected via the respondent. Therefore, the information was based on the knowledge the respondent had of other household members’ income.
- Responses were based on the current income of the respondent at the time of interview, and may not be reflective of their income at the time they experienced violence. It is recommended that these data items are used only when examining recent experiences of violence (i.e. in the previous 12 or 24 months), as characteristics are more likely to have changed over longer timeframes.
- Measures of income do not necessarily provide the whole story about people’s capacity to maintain living standards and meet household needs. As such, it may be useful to analyse income data in combination with the financial stress data items, which asked whether the household was able to raise emergency money in a time of crisis, and whether the household experienced any selected cash flow problems in the previous 12 months.
- In cases where income information was not provided for the respondent, current partner, or other persons aged 15 years and over who were usual residents of the household, responses were coded as ‘not known/not stated’.
Comparability with previous surveys
Income data items are comparable across all PSS cycles, but not with the 1996 Women’s Safety Survey (WSS).
However, the following should be taken into consideration when comparing across cycles:
- In 2021-22, measures were taken (such as giving respondents the option of selecting an income range if they were unable or unwilling to provide an income amount in single dollar values) to reduce the number of ‘not stated’ responses. The 2021-22 survey also collected individual amounts for each source of income separately, as part of producing the total income values for personal income. Neither of these measures were undertaken in previous cycles.
- There have been minor changes to the data item category labels for sources of income in the 2021-22 PSS, summarised in the table below. However, these do not affect comparability between 2021-22 and previous PSS cycles due to the concepts and collection category labels being the same.
Output data item labels | |
|---|---|
2021-22 | Previous PSS cycles |
Employee income | Wages or salary |
Unincorporated business income | Profit or loss from own unincorporated business or share in a partnership |
Government pensions and allowances | Any Government pension, benefit or allowance |
Rental income | Profit or loss from rental investment property |
Superannuation pensions and annuities | Superannuation, an annuity or private pension |
Other income | Other regular source |
No sources of income | No source of income |
Financial stress
Population
Information regarding financial stress was obtained from men and women aged 18 years and over in the 2021-22 PSS.
Definition
The financial stress topic includes measures which could be used to identify households that were constrained in their activities because of a shortage of money or access to sufficient financial resources. The data items are used to examine the ability of households to maintain adequate cash flow to meet financial commitments and to raise emergency money.
Methodology
There were two questions asked in this topic.
The first question asked respondents whether they or other members of the household could raise $2,000 within a week for something important.
The definition of ‘something important’ was left open to the respondent’s interpretation, with the objective being to determine whether people thought their household had access to, or the ability to acquire, these resources within a week. An example might be to pay for emergency medical care or unexpected bills, while the money could be obtained from any source, such as drawing on savings, getting a loan from family or friends or a financial institution.
The second question in this topic asked respondents if they or other members of the household had any of the following happen as a result of being short on money in the last 12 months:
- could not pay electricity, gas or telephone bills on time
- could not pay mortgage or rent payments on time
- could not pay for car registration or insurance on time
- could not make minimum payment on credit card
- pawned or sold something because they needed cash
- went without meals
- were unable to heat or cool their home
- sought financial assistance from friends or family
- sought assistance from welfare or community organisations.
Data items
The data items and related output categories for this topic are contained within the Household level tab in the data item list available under Downloads.
Data uses
Data for this topic has been collected to examine the relationship between financial stress and experiences of violence.
Data items from this topic should not be used on their own to produce population estimates of financial stress.
Interpretation
Points to be considered when using and interpreting data for this topic include the following:
- Responses were based on the current financial situation of the household at the time of interview, and may not be reflective of the household’s financial situation at the time violence was experienced. It is recommended that these data items are used only when examining recent experiences of violence (i.e. in the previous 12- or 24- months), as household characteristics are more likely to have changed over longer timeframes.
- Where there was more than one person aged 15 years and over in the household, the financial stress questions related to the situation of the household as a whole (i.e. the questions referred to all members of the household). Responses therefore may not reflect the individual circumstances of the respondent.
- Details about household financial stress were collected via the respondent. Therefore, the information was based on the knowledge the respondent had of the financial situation of other members of the household.
Comparability with previous surveys
Financial stress data from the 2021-22 PSS is comparable with all previous PSS cycles.
There was a minor wording change introduced in 2016 to one cash flow category. ‘Unable to heat your home’ was changed to ‘Unable to heat or cool your home.’
Social connectedness
Population
Information regarding social connectedness was obtained from men and women aged 18 years and over in the 2021-22 PSS.
Definition
In the context of the PSS, social connectedness is a measure of how people come together and interact with others.
The questions used in this topic seek to identify recent types of social interaction the respondent had with friends, and the ability of the respondent to ask people outside of their household for small favours or support in a time of crisis. ‘A time of crisis’ refers to difficult life events that are distressing for most people, for example:
- sudden sickness
- death of a partner/spouse
- loss of a job
- breakdown of marriage/relationship
- fire or flood.
Methodology
The social connectedness topic comprised four questions.
The first asked about participation in three types of social activities in the three months prior to the interview.
The second asked about the respondent’s ability to ask for help in their day-to-day lives from other people who don’t live with them.
The third and fourth questions relate to the respondent’s ability to ask someone who does not live with them for support in a time of crisis, and the sources they could ask support from.
Data items
The data items and related output categories for this topic are contained within the SPS Level – Social connectedness tab in the data item list available under Downloads.
Data uses
Data for this topic has been collected to examine the relationship between social connectedness and experiences of violence.
Data items from this topic should not be used on their own to produce population estimates of social connectedness.
Interpretation
Points to be considered when using and interpreting data for this topic include the following:
- Participation in face-to-face social activities only refers to social activities with friends. It does not include social activities with family members. It is designed to measure participation in face-to-face social activities with persons outside of the respondent’s family network. Social contact via the internet was not limited to specific relationship types, and therefore could include contact with family members.
- Sources of support for day-to-day activities or in a time of crisis refer to support from people who did not live with the respondent. Sources of support from within the household are excluded.
Comparability with previous surveys
The social connectedness topic was first introduced in the 2012 PSS and is comparable across all subsequent PSS survey cycles.
Health and life satisfaction
Population
Information regarding health and life satisfaction was obtained from men and women aged 18 years and over in the 2021-22 PSS.
Methodology
For self-assessed health status, respondents were asked whether in general they felt their health was: excellent, very good, good, fair, or poor.
They were then asked how satisfied they were with life as a whole, on a scale of 0 (not at all satisfied) to 10 (completely satisfied).
Data items
The data items and related output categories for this topic are contained within the SPS Level – Health & Disability tab in the data item list available under Downloads.
Data uses
Data for this topic was collected to examine the relationship between life satisfaction and experiences of violence.
Data items from this topic should not be used on their own to produce population estimates of self-assessed health and life satisfaction.
Interpretation
Points to be considered when using and interpreting data for this topic include the following:
- Responses are based on the respondent’s subjective assessment of their health status and life satisfaction at the time of interview, and may not be reflective of their health status and life satisfaction at the time violence was experienced. It is recommended that these data items are used only when examining recent experiences of violence (i.e. in the previous 12- or 24- months), as personal characteristics are more likely to have changed over longer timeframes.
- Perceptions of one’s health and life satisfaction may be influenced by a number of factors, some of which may be unrelated to health or overall life satisfaction, or may reflect momentary or short-term feelings or circumstances, rather than general feelings or circumstances.
Comparability with previous surveys
The self-assessed health status topic was first introduced in the 2012 PSS and is comparable across all subsequent PSS survey cycles.
The life satisfaction topic is comparable between the 2016 and 2021-22 PSS cycles, but not with the 2012 PSS due to a change in methodology from 2016 onwards to better align with the question used in the OECD Better Life Index.
Disability
Population
Information was obtained from men and women aged 18 years and over in the 2021-22 PSS.
Definition
In the context of health experience, the International Classification of Functioning, Disability and Health (ICF) defines disability as an umbrella term for impairments, activity limitations and participation restrictions. It denotes the negative aspects of the interaction between an individual (with a health condition) and that individual's contextual factors (environment and personal factors).
In the PSS, a person has a disability if they report they have a limitation, restriction or impairment, which has lasted, or is likely to last, for at least six months and restricts everyday activities.
Disability is classified by whether or not a person has a specific limitation or restriction. The specific limitation or restriction is further classified by whether it is a limitation in core activities, or a schooling/employment restriction only.
There are four levels of core activity limitation (profound, severe, moderate, mild). These are based on whether a person needs help, has difficulty, or uses aids or equipment with any core activities (self-care, mobility, or communication). A person's overall level of core activity limitation is determined by their highest level of limitation in any of these activities.
The ‘schooling/employment restriction only’ category includes people with disability who do not have a core limitation but have difficulties with education and/or employment.
Methodology
The PSS uses a standard set of sixteen questions designed to identify whether a person has a disability or long-term health condition, the type(s) of disability that they have, and the level of severity in terms of core activity restrictions and limitations.
Respondents were asked about whether they had any conditions that have lasted, or were expected to last, six months or more, including:
- shortness of breath
- chronic or recurring pain
- a nervous or emotional condition
- memory problems or periods of confusion
- social or behavioural difficulties
- long-term effects as a result of a head injury, stroke, or other brain damage
- receiving treatment or medication for any other long-term condition
- any other long-term condition (such as arthritis, asthma, heart disease etc).
More than one condition may have been reported.
Respondents who reported a condition were then asked if the condition(s) they had reported restricted them in their everyday activities, and if so, which ones.
All respondents were then asked if they had any of the following conditions which had lasted, or were likely to last, for six months or more:
- sight problems not corrected by glasses or contact lenses
- hearing problems
- speech problems
- blackouts, seizures or loss of consciousness
- difficulty learning or understanding things
- limited use of arms or fingers
- difficulty gripping things
- limited use of legs or feet
- any condition that restricts physical activity or physical work (e.g. back problems, migraines)
- any disfigurement or deformity
- any mental illness for which help or supervision is required.
More than one condition may have been reported.
Respondents who selected a condition(s) in the first question and reported a restriction in everyday activities and/or selected a condition in the second question were then asked about the levels of help or supervision that they required with any of the following tasks:
- self-care (e.g. bathing/showering, dressing/undressing, eating/feeding, going to the toilet, bladder/bowel control)
- mobility (e.g. moving around away from home, moving around at home, getting in or out of a bed or chair)
- communication in own language (e.g. understanding/being understood by strangers, friends or family, including use of sign language/lip reading).
Respondents who reported requiring help or supervision for these tasks were asked whether they always needed help with any of these tasks.
Respondents who did not require help or supervision were asked if they ever had any difficulty with the tasks.
Respondents who did not have any difficulty were then asked if they used any aids to assist with those tasks and then whether they could do any of the following additional mobility tasks:
- easily walk 200 metres
- walk up and down stairs without a handrail
- easily bend to pick up an object from the floor
- use public transport without difficulty, help or supervision.
Respondents with a disability were then asked whether they had any difficulties with the following education-related activities:
- not attending school/further study due to condition
- need time off school/study
- attend special classes/school
- other related difficulties
- no difficulty with education.
Respondents were also asked whether they had any difficulties with the following employment-related activities:
- type of job they could do
- number of hours that can be worked
- finding suitable work
- needing time off work
- permanently unable to work
- other related difficulties
- no difficulty with employment.
Classification of disability type
Based on their responses, respondents with a disability were classified to one or more of the following categories of disability type:
- sensory and speech
- learning and understanding
- physical restriction
- psychosocial
- head injury, stroke, or acquired brain injury
- other.
Classification of disability severity
Based on their responses, respondents with a disability were classified to one of the following categories of disability severity:
- Profound core activity limitation – Those who answered yes to always needing help with self-care, mobility and communication tasks.
- Severe core activity limitation – Those who don't always need help with self-care, mobility, and communication tasks, but may require help at times.
- Moderate core activity limitation – Those who had difficulty with self-care, mobility, and communication tasks but did not require help.
- Mild core activity limitation – Those who only required aids to undertake self-care, mobility, and communication tasks, or who were unable to do any of the additional mobility tasks (e.g. easily walk 200 metres, walk up and down stairs without a handrail etc.).
- Schooling/employment restriction only – Those who did not have any difficulty with the core activities or additional mobility tasks but identified as having difficulty with school/study or work. The school/study component of this category is restricted to persons aged 18 to 20 years only.
- No limitation or specific restriction – Those who indicated that they had no difficulties with the core activities, additional mobility tasks, and school/study or work.
Those who had not reported any conditions in the first or second question OR had not reported any everyday restrictions caused by conditions in the first question were identified as having ‘no disability’.
Data items
The data items and related output categories for this topic are contained within the SPS Level – Health & Disability tab in the data item list available under Downloads.
Data uses
Data for this topic has been collected to examine the relationship between disability and experiences of violence. It can be used to understand the prevalence rate of different types of violence for people with and without disability, and measure changes in prevalence rates over time.
Data items from this topic should not be used on their own to produce population estimates of disability status. The Survey of Disability, Ageing, and Carers is a more appropriate data source for those purposes. Further information on ABS disability statistics can be found in Understanding disability statistics in the Census and the Survey of Disability, Ageing and Carers.
Interpretation
Points to be considered when using and interpreting data for this topic include the following:
- Disability status is determined based on the respondent’s limitations, restrictions or impairments at the time of the survey. It does not necessarily indicate whether they had a disability at the time of any violence. It is recommended that disability status is used only when examining recent experiences of violence (i.e. in the previous 12 or 24 months), as characteristics are fluid and more likely to have changed over longer timeframes.
- Conditions are 'as reported' by respondents and do not necessarily represent conditions as medically diagnosed. However, as the definition includes conditions which had lasted, or were expected to last, for six months or more, there is a reasonable likelihood that medical diagnoses would have been made in most cases. The degree to which conditions have been medically diagnosed is likely to vary across condition types.
- 'Restricted in everyday activities' means less able, or unable, to engage in the everyday activities that a healthy individual of the same age could. Respondents can perceive themselves to be restricted in everyday activities by causes other than the specific conditions listed.
- Aids needed for any condition lasting less than six months (i.e. broken leg) were not included. Examples of aids are hearing aids, wheelchairs for long-term use, special cutlery and changes to floors/steps/paths.
- Only current difficulties with education and/or employment were collected. Any difficulties a respondent may have previously experienced were excluded. Therefore, it is recommended that only recent experiences (i.e. in the previous 12- or 24- months) are considered in conjunction with this data.
- If a person was selected to participate in the survey but cannot communicate independently with the interviewer due to a disability, a proxy interview was conducted with the person’s guardian or carer. However, sensitive questions about experiences of violence were not asked during proxy interviews. As such, a small number of persons with a severe communication disability that prevented them from responding to survey questions themselves were excluded from the sensitive component of the survey. Whilst there is a small under representation of persons with profound or severe disability who cannot communicate independently, this does not impact on the overall representativeness of persons with disability in the PSS sample. For further information about the representation of persons with disability in the PSS sample, refer to the Response Rates section of the Sampling chapter of this publication.
- Persons residing in non-private dwellings are excluded from the PSS coverage. This includes persons with disability living in health care establishments or other institutional settings. The exclusion of persons with disability living in institutional settings from the coverage of the PSS does not impact on the overall representativeness of persons with disability in the PSS sample, as persons with disability living in care-accommodation comprise less than 5% of all persons with disability (SDAC, 2018).
- Of persons in the approached sample, who reported a severe/profound disability, 64.8% were fully responding. Approximately 35.2% of respondents with severe/profound disability did not complete the full interview due to proxy interview or opting out. For more details regarding proxy interviews refer to Proxy Interviews in the Survey procedures section of the Survey Development and Data Collection chapter of this publication.
Comparability with previous surveys
The Disability topic was added to the PSS in 2012, and data is considered generally comparable across all PSS cycles from 2012 onwards.
However, some changes to collection categories and output labelling should be considered when comparing across cycles. For 2021-22:
- The PSS collected information about psychosocial disability. This replaced the narrower in scope psychological disability type category used in the 2012 and 2016 PSS. Psychosocial disability includes the new categories of ‘Memory problems or periods of confusion’ and ‘Social or behavioural difficulties’ in the first list of conditions asked about. Due to the broader population who may now be included in the psychosocial disability type category compared with the previous psychological disability type category, care should be taken when making comparisons between these disability types across survey cycles.
- Additional changes were made to the disability type output category labelling. A comparison of the category labelling between the 2021-22 and earlier PSS cycles is presented below.
2021-22 PSS | 2012 and 2016 PSS |
|---|---|
| Sensory and speech | Sight, hearing, and speech |
| Learning and understanding | Intellectual |
| Physical | Physical |
| Psychosocial | Psychological |
| Head injury, stroke or acquired brain injury | Head injury, stroke or brain damage |
| Other | Type not specified |
| No disability | Has no disability or long-term health condition |
In 2021-22, there were a number of changes made in the collection of employment and education restrictions. These include:
- Education restriction and employment restriction questions were expanded (including the collection of restriction types), compared to previous cycles which asked respondents whether they had any difficulties with education and employment (yes/no response categories).
- The question population changed to ‘All persons’ in 2021-22 for both education restriction and employment restriction. In 2012 and 2016 the question population was persons aged 18 to 64 years.
- The disability status output category for ‘schooling/employment restriction only’ was restricted to persons aged 18 to 20 years for schooling restrictions in 2021-22. In 2012 and 2016 the output category included persons aged 18 to 64 years.
- The response option ‘other related difficulties’ was added to the employment restriction question. While previous surveys did not collect what types of restrictions people experienced (just whether they experienced any) they did list the specific restrictions as a prompt for respondents. The addition of an ‘other related difficulties’ category in 2021-22 may have led to an increase in the number of people reporting an education and employment restriction under disability status, as well as the specific employment restriction items.
General feelings of safety
Population
Information regarding general feelings of safety was obtained from men and women aged 18 years and over in the 2021-22 PSS.
Definition
All respondents were asked about their general feelings of safety in the last 12 months in the following four settings:
- using public transport alone after dark
- waiting for public transport alone after dark
- walking in local area alone after dark
- home alone after dark.
Public transport includes buses, trains, trams, taxis, and ferries.
Local area is defined as the respondent’s neighbourhood or suburb (i.e. the area around the respondent’s home).
Methodology
The information collected about general feelings of personal safety in the last 12 months includes:
- whether used public transport alone after dark
- feelings of safety using public transport alone after dark
- feelings of safety waiting for public transport alone after dark
- reasons for not using public transport alone after dark
- whether walked alone in local area after dark
- feelings of safety walking in the local area alone after dark
- reasons for not walking alone in local area after dark
- feelings of safety when home alone after dark
- reasons for not staying home alone after dark.
Data items
The data items and related output categories for this topic are contained within the SPS Level – General safety tab in the data item list available under Downloads.
Data uses
The main purpose of these questions was to collect information about a person’s perception of whether they felt safe in the selected settings, or whether they avoided the selected settings due to their perception of them as unsafe or for other reasons.
This data can also be used to examine:
- the relationship between general feelings of safety in the community and recent experiences of violence
- changes in perceptions of safety over time by socio-demographic groups.
Interpretation
Points to be considered when using and interpreting data for this topic include the following:
- 'Alone' meant the person did not have anyone else with them. However, if a person was at home with a young child, they may have felt as if they were alone and therefore were treated as such.
- A person who was walking with their dog was considered to be walking alone.
- If the respondent felt varying levels of safety depending on what mode of public transport they used, they were asked to consider their feelings of safety when using public transport in general.
Comparability with previous surveys
Data about general feelings of safety is comparable across all PSS cycles and the 1996 Women’s Safety Survey.
Sexual harassment
Population
Information regarding experiences of sexual harassment in the last 12 months was obtained from men and women aged 18 years and over in the 2021-22 PSS.
Definition
Sexual harassment is considered to have occurred when a person has experienced or been subjected to one or more selected behaviours which they found improper or unwanted, made them feel uncomfortable, and/or found offensive due to their sexual nature.
Methodology
The sexual harassment topic consists of a set of questions asking about experiences of sexual harassment in the 12 months prior to the survey. Questions in this topic were asked twice – once for sexual harassment by a man and then repeated for sexual harassment by a woman.
Respondents were asked if they experienced any of the following selected behaviours, presented in the table below, in the last 12 months, which they found improper or unwanted, made them feel uncomfortable, and/or found offensive due to their sexual nature.
| Sexual Harassment Behaviours | |
|---|---|
Behaviours | Inclusions/Exclusions |
Indecent phone call | Inclusion
Exclusions
|
Indecent text, email or post | Inclusions
Exclusions
|
Indecent exposure
| Inclusion
|
Inappropriate comments about body or sex life
| Inclusions
|
Unwanted touching, grabbing, kissing, or fondling | Inclusion
Exclusion
|
Distributing or posting pictures or videos of the person, that were sexual in nature, without their consent | Inclusion
|
Exposed to pictures, videos, or materials which were sexual in nature that the person did not wish to see | Inclusions
|
Characteristics of sexual harassment incidents
Respondents who had experienced sexual harassment in the last 12 months were asked about the method/s by which sexual harassment was perpetrated (face-to-face, electronically, or other method), the location/s where sexual harassment occurred (face-to-face incidents only), and their relationship to the perpetrator/s of the sexual harassment incidents.
Data items
The data items and related output categories for this topic are contained within the SPS Level – Sexual Harassment tab in the data item list available under Downloads.
Data uses
Sexual harassment data can be used to examine:
- the estimated number and proportion (prevalence rate) of persons who have experienced sexual harassment in the last 12 months
- whether rates of sexual harassment have changed over time (comparison with previous PSS editions)
- rates of different types of sexual harassment experienced in the last 12 months
- differences in rates of sexual harassment, by socio-demographic groups
- rates of sexual harassment by a male and a female perpetrator
- rates of sexual harassment by different relationship types
- the location of face-to-face incidents of sexual harassment
- the methods by which sexual harassment was perpetrated
- whether experienced sexual harassment and other types of violence in the last 12 months (e.g. sexual violence, physical violence, stalking).
Interpretation
Points to be considered when using and interpreting data for this topic include the following:
- Whether or not any sexual harassment amounted to a criminal offence cannot be determined from the information collected.
- The PSS only asked respondents about selected sexual harassment behaviours, and therefore may not capture all forms of sexual harassment that exist.
- The recognition and identification of any behaviour as sexual harassment was based on the respondent’s subjective beliefs regarding the nature and perceived intent of the behaviour. Individual differences in thresholds for what constitutes improper, unwanted, or offensive behaviour will affect how respondents interpret and answer these questions.
Comparability with previous surveys
Information about experiences of sexual harassment was collected in all previous editions of the PSS, as well as in the 1996 Women’s Safety Survey (WSS).
The following should be noted when making comparisons:
- The 1996 WSS only collected information about women’s experiences of sexual harassment by a man. All PSS editions collected information about men’s and women’s experiences of sexual harassment by both a man and a woman.
- From 2012 onwards, the PSS specified that the sexual harassment behaviours had to be found to be improper or offensive due to their sexual nature. The 1996 WSS and 2005 PSS merely determined if respondents had ever experienced the sexual harassment behaviours and did not ask whether the respondent found the behaviours to be improper or offensive due to their sexual nature. This should be considered when comparing sexual harassment data before and after 2012.
- New sexual harassment behaviours were added from the 2016 PSS onwards to accurately capture emerging trends in experiences of sexual harassment (such as the use of information and communications technology). Although these behaviours may have previously been collected as part of other categories, this expansion of categories should be taken into consideration when comparing sexual harassment prevalence rates before and after 2016.
- For the 2021-22 the PSS lifetime experiences of sexual harassment were not asked. Lifetime estimates are expected to remain relatively stable over a short-time frame. Refer to the 2016 data for these prevalence estimates and proportions.
| 1996 Women's Safety Survey | 2005 Personal Safety Survey | 2012 Personal Safety Survey | 2016 Personal Safety Survey | 2021-22 Personal Safety Survey |
|---|---|---|---|---|---|
Population | Women aged 18 years and over
| Men and women aged 18 years and over
| Men and women aged 18 years and over
| Men and women aged 18 years and over
| Men and women aged 18 years and over
|
Timeframe | Whether ever experienced sexual harassment in lifetime and last 12 months
| Whether ever experienced sexual harassment in lifetime and last 12 months
| Whether ever experienced sexual harassment in lifetime and last 12 months
| Whether ever experienced sexual harassment in lifetime and last 12 months
| Whether experienced sexual harassment in the last 12 months
|
Perpetrator sex
| Male | Male and female | Male and female | Male and female | Male and female |
Sexual harassment behaviours
|
|
|
|
|
|
Comparability | 1996 data is comparable with 2005 male perpetrator data, but not comparable with 2012, 2016 and 2021-22 data | 2005 male perpetrator data is comparable with 1996 data, but not comparable with 2012, 2016 and 2021-22 data. | 2012 data is comparable with 2016 data and 2021-22 for 12-month data, but not comparable to 1996 or 2005 data. | 2016 data is comparable with 2012 data and 2021-22 for 12-month data, but not comparable to 1996 or 2005 data. | 2021-22 data is comparable with 2016 and 2012 for 12-month data, but not comparable to 1996 or 2005 data. |
Violence - Prevalence
Population
Information regarding experiences of violence since the age of 15 was obtained from men and women aged 18 years and over in the 2021-22 PSS.
Definitions
Prevalence
Prevalence refers to the number and proportion (rate) of men and women who have experienced violence within a specified timeframe – usually in the last 12 months and since the age of 15. The Violence Prevalence topic is designed to produce a range of prevalence estimates for men's and women's experiences of violence, according to the type of violence, the sex and type of perpetrator, and timeframe.
Violence
In the PSS, violence is defined as any incident involving the occurrence, attempt or threat of either sexual or physical assault. Violence can be broken down into two main categories: sexual violence and physical violence.
Sexual violence is defined as the occurrence, attempt or threat of sexual assault experienced by a person since the age of 15. There are two components of sexual violence:
- Sexual assault is an act of a sexual nature carried out against a person’s will through the use of physical force, intimidation or coercion, including any attempts to do this. This includes rape, attempted rape, aggravated sexual assault (assault with a weapon), indecent assault, penetration by objects, forced sexual activity that did not end in penetration and attempts to force a person into sexual activity. Incidents so defined would be an offence under State and Territory criminal law. Sexual assault excludes unwanted sexual touching, which for the purposes of this survey is defined as Sexual Harassment.
- Sexual threat is the threat of acts of a sexual nature that were made face-to-face where the person believed it was able to and likely to be carried out.
Information was collected separately in the survey about experiences of sexual assault and sexual threat. This information was combined to provide an aggregate (total) number of persons who have experienced sexual violence (assault and/or threat) since the age of 15. Persons who have experienced both types of sexual violence are only counted once in the aggregated sexual violence total.
Physical violence is defined as the occurrence, attempt or threat of physical assault experienced by a person since the age of 15. There are two components of physical violence:
- Physical assault is any incident that involved the use of physical force with the intent to harm or frighten a person. It excludes incidents that occurred during the course of play on a sporting field.
- Physical threat is any attempt to inflict physical harm, or a threat or suggestions of intent to inflict physical harm, which was made face-to-face and which the person believed was able and likely to be carried out. It excludes incidents of violence in which the threat was actually carried out and incidents which occurred during the course of play on a sporting field.
Information was collected separately in the survey about experiences of physical assault and physical threat. This information was combined to provide an aggregate (total) number of persons who have experienced physical violence (assault and/or threat) since the age of 15. Persons who have experienced both types of physical violence are only counted once in the aggregated physical violence total.
Relationship to perpetrator
Relationship to perpetrator refers to the relationship of the perpetrator to the respondent. There are seven key perpetrator types in the PSS:
- Stranger – Someone the respondent did not know, or someone they only knew by hearsay.
- Current partner – A partner the respondent currently lives with in a married or de facto relationship.
- Previous partner – A person who the respondent lived with at some point in a married or de facto relationship, whom they are now separated, divorced, or widowed from.
- Boyfriend/girlfriend or date – This relationship may have different levels of commitment and involvement that does not involve living together. For example, this will include respondents who have had one date only, regular dating with no sexual involvement, or a serious sexual or emotional relationship. It excludes de facto relationships.
- Ex-boyfriend/girlfriend or date – A former relationship that involved either regular dating or a serious sexual or emotional relationship but that didn't include living together.
- Family member – Includes father/mother, son/daughter, brother/sister, and other relative or in-law.
- Other known person – This is defined as any other known person who does not fit into any of the partner, boyfriend/girlfriend or date, ex-boyfriend/girlfriend or date, or family member categories.
The following relationship categories have also been created to support analysis of partner violence data:
- Cohabiting partner – A person the respondent lives with (current partner) or lived with at some point (previous partner), in a married or de facto relationship.
- Intimate partner – Includes current partner (living with), previous partner (has lived with), boyfriend/girlfriend/date and ex-boyfriend/ex-girlfriend (never lived with).
Methodology
The Violence Prevalence topic consists of a set of questions repeated eight times, focusing on a different type of violence each time.
Respondents were asked about their experiences of four types of violence – physical assault, physical threat, sexual assault, sexual threat – by both a male and a female perpetrator. This produced the following eight types of violence in total:
- Sexual assault by a male
- Sexual assault by a female
- Sexual threat by a male
- Sexual threat by a female
- Physical assault by a male
- Physical assault by a female
- Physical threat by a male
- Physical threat by a female
Respondents were asked whether they have ever (since the age of 15) experienced each of the eight types of violence described above, and were instructed to include incidents that occurred on the job, at school, or overseas.
Overview of violence types collected in the PSS
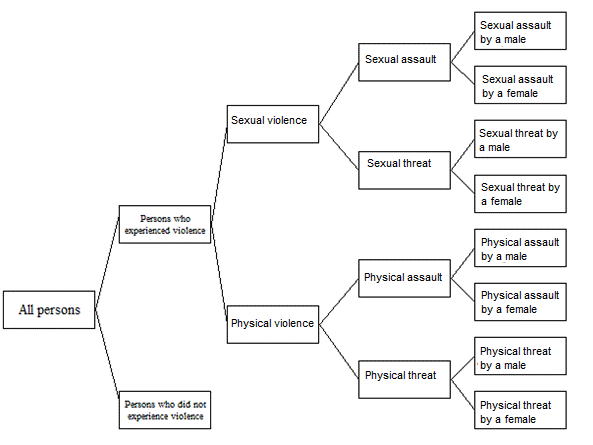
The first level shows the population of all persons.
The second level shows the population of all persons divided into those who experienced violence and those who did not experience violence.
The third level shows sexual violence and physical violence as the components of violence.
The fourth level shows sexual assault and sexual threat as the components of sexual violence; and physical assault and physical threat as the components of physical violence.
The fifth level shows sexual assault by a male and sexual assault by a female as the components of sexual assault; sexual threat by a male and sexual threat by a female as the components of sexual threat; physical assault by a male and physical assault by a female as the components of physical assault; sexual assault by a male and sexual assault by a female as the components of sexual assault.
For each of the 8 types of violence experienced, respondents were asked to identify all the perpetrator types that had ever perpetrated the violence against them since the age of 15. These perpetrator types included:
- stranger
- boyfriend or girlfriend or date
- current partner
- previous partner
- ex-boyfriend or ex-girlfriend
- father/mother
- son/daughter
- brother/sister
- other relative or in-law
- friend or housemate
- acquaintance or neighbour
- employer/manager/supervisor
- co-worker
- teacher/tutor
- client/patient/customer
- medical practitioner
- priest/minister/rabbi or other spiritual advisor
- carer
- other known person.
If ‘other known person’ was selected, a trigram coder was available to select a response. This use of a trigram coder (which was introduced for the 2021-22 cycle) allowed responses to be recoded to the above categories at the time of the survey to facilitate correct sequencing for the remainder of the topic/survey. See Data Processing and Coding chapter for more details on the use of trigram coders.
Based on these relationship to perpetrator questions, the PSS can provide (depending on data quality) estimates of the number and proportion of men and women who have experienced any of the eight types of violence since the age of 15 by any of the 19 perpetrator types listed above (8 types of violence x 19 perpetrator types produce a maximum of 152 prevalence rates).
Where a respondent had experienced one or more of the eight types of violence by one or more of the seven key perpetrator types (stranger, current partner, previous partner, boyfriend/girlfriend/date, ex-boyfriend/ex-girlfriend, family member, other known person), they were asked when the most recent incident occurred for each type of perpetrator for each type of violence experienced.
This means that prevalence rates for specific timeframes (last 12 months, last two years, last three years etc.) are available for any of the eight types of violence by any of the seven perpetrator types (8 types of violence x 7 perpetrator types produce a maximum of 56 prevalence rates, which can be restricted to specified timeframes). Prevalence rates for specific timeframes are also available for partner perpetrator categories (cohabiting partner, intimate partner).
Hierarchy of violence types collected in the PSS
A hierarchy of violence types exists in the PSS to ensure any single incident of violence is not counted more than once. Sexual assault is considered the most serious crime type and so is prioritised and asked first. The ranking of the hierarchy from most serious at the top is as follows:
- Sexual assault
- Face-to-face sexual threat
- Physical assault
- Face-to-face physical threat
Examples of where incidents would only be counted once:
- If a respondent experienced physical assault and physical threat in the same incident, this was counted once only as a physical assault.
- If a respondent experienced sexual threat and physical threat in the same incident, this was counted once only as a sexual threat.
- If an incident of sexual assault also involved physical assault or threats, this was counted once only as a sexual assault.
Data items
The data items and related output categories for this topic are contained within the Violence – Prevalence tab in the data item list available under Downloads. In addition, aggregate data items relating to this topic are contained within the SPS Level – VIO Aggregates tab.
Data uses
Violence prevalence data can be used to examine:
- the estimated number and proportion (rate) of men and women who have experienced violence, broken down by (depending on data quality) the type of violence, the type of perpetrator, the sex of perpetrator, and the timeframe. This can also be done for aggregated categories e.g. combining sexual assault and sexual threat to produce a prevalence rate for sexual violence, or combining current partner and previous partner to produce a prevalence rate for cohabiting partner (current and/or previous). Aggregates will only count each person once, despite how many types of violence included in the aggregate that they have experienced.
- differences in violence prevalence rates between men and women and other socio-demographic groups of interest, using 12- or 24- month timeframes.
- when the most recent incident of violence occurred for the following perpetrator types for each of the eight types of violence: stranger, boyfriend/girlfriend/date, current partner (living with), previous partner (lived with), other known person, ex-boyfriend/ex-girlfriend (never lived with), cohabiting partner, intimate partner, family member.
- changes in the prevalence of violence over time, by comparing 12- or 24- month prevalence data from the 2021-22 PSS with 12- or 24- month prevalence data from previous editions of the PSS.
Violence prevalence data cannot be used to examine:
- timeframe for the individual perpetrator types that form the groups of ‘family’ or ‘other group', as these were not collected. For example, the timeframe for mother is not available as mother was collected as part of the ‘family’ group.
- the prevalence of violence before the age of 15 (information about physical and sexual abuse experienced before the age of 15 is collected in a different topic of the survey – see the Abuse before the age of 15 chapter of this publication).
- the number of violent incidents experienced. The counting unit in the PSS is always persons, and not incidents.
Interpretation
Points to be considered when using and interpreting data for this topic include the following:
- Violence in the PSS is defined in terms of a set of specific behaviours, which may not align with legal definitions used in state/territory criminal codes. Whether or not any incident of violence amounted to a criminal offence cannot be determined from the information collected.
- Sexual assault includes any attempted sexual assaults, while physical assault excludes attempted physical assaults.
- Determinations about whether violence occurred are based on the respondent’s subjective perceptions concerning the incident, interpreted within the context of the behaviours identified in the survey.
- Threats that did not occur face-to-face are not counted in the threat data. Therefore, the threat data is not representative of all types of threats that could occur.
- Estimates of the number of incidents of violence and number of perpetrators are not able to be produced based on the data collected.
Comparability with previous surveys
Prevalence rates across the 1996 Women’s Safety Survey and all PSS cycles are comparable. However, the following should be noted when making comparisons:
- Analysis of changes over time are not recommended for timeframes that overlap.
- The 1996 WSS did not have a hierarchy applied to the violence types as has been applied to the PSS (see Hierarchy of violence types collected in the PSS in the Methodology section of this chapter).
- The range of perpetrator types asked about has expanded across the surveys, meaning prevalence rates for some perpetrator types in later editions of the survey may not exist in earlier editions (see table below for details).
- From the 2016 PSS onwards there was a change in the collection mode, whereby additional instructions were added to the questionnaire. This includes instructions to include incidents of violence that occurred on the job, at school, or overseas. These added instructions do not affect the comparability of PSS data from 2016 onwards with data prior to 2016 as these instructions were previously included in the interviewer instructions.
- Timeframe data for violence by an ex-boyfriend/ex-girlfriend and violence by an intimate partner were added from the 2016 PSS onwards, while timeframe data for violence by a family member was added in the 2021-22 PSS. Timeframe data for these perpetrator categories are not available in previous editions of the PSS.
- Multiple versions of the other known person timeframe data item, which include/exclude ex-boyfriend/ex-girlfriend/family members as required, have been produced so that appropriate comparisons can be made across time.
| 1996 Women's Safety Survey | 2005 Personal Safety Survey | 2012 Personal Safety Survey | 2016 Personal Safety Survey | 2021-22 Personal Safety Survey | |
|---|---|---|---|---|---|
| Population | Women aged 18 years and older | Men and women aged 18 years and older | Men and women aged 18 years and older | Men and women aged 18 years and older | Men and women aged 18 years and over |
| Sexual assault | Has any man (including your current partner) / woman ever forced you or tried to force you into sexual activity, against your will? | Has any man/woman ever forced you, or tried to force you, into sexual activity against your will? This excludes any unwanted sexual touching. | Has any man/woman (including your current partner) ever forced you, or tried to force you, into sexual activity against your will? This excludes any unwanted sexual touching. | Has any man/woman (including your current partner) ever forced you, or tried to force you, into sexual activity against your will? This includes incidents that occurred on the job, at school or overseas, and excludes any unwanted sexual touching. | Has any man/woman (including your current partner) ever forced you, or tried to force you, into sexual activity against your will? This includes incidents that occurred on the job, at school or overseas, and excludes unwanted sexual touching. |
| Sexual threat | Has any man (including your current partner) / woman ever threatened to force you into any sexual activity? | Has any man/woman (including your current partner) ever threatened to force you into any sexual activity? Only include incidents in which you believed the threat could be carried out and that were face-to-face. | Has any man/woman (including your current partner) ever threatened to force you into any sexual activity? Only include incidents in which you believed the threat could be carried out and that were face-to-face. | Has any man/woman (including your current partner) ever threatened to force you into any sexual activity? Only include incidents in which you believed the threat could be carried out and that were face-to-face. | Has any man/woman (including your current partner) ever threatened to force you into any sexual activity? Only include incidents in which you believed the threat could be carried out and that were face-to-face. |
Physical assault
| Did (your current partner/a previous partner) ever do any of these to you with the intent to harm or frighten you? Has any (other) man / woman done any of these with the intent to harm or frighten you?
| Has any man/woman (including your current partner) ever done any of these to you with the intent to harm or frighten you? This includes any use of force from a slap to a beating, and excludes incidents which occurred during the course of play on a sporting
| Has any man/woman (including your current partner) ever done any of these to you with the intent to harm or frighten you? This excludes incidents which happened during the course of play on a sporting field.
| Has any man/woman (including your current partner) ever done any of these to you with the intent to harm or frighten you? This includes incidents that occurred on the job, at school or overseas, and excludes incidents which happened during the course of play on a sporting field.
| Has a man/woman (including your current partner) ever done any of these to you with the intent to harm or frighten you? This includes incidents that occurred on the job, at school or overseas, and excludes incidents which happened during the course of play on a sporting field.
|
Physical threat
| Did (your current partner/a previous partner, that is, a partner you don't live with now) ever threaten or try to do any of these to you with the intent to harm or frighten you? / Has any (other) man / woman threatened or tried to do any of these to you with the intent to harm or frighten you?
| Has any man/woman (including your current partner) ever threatened or tried to do any of these with the intent to harm or frighten you? This includes face-to-face threats only and excludes incidents which occurred during the course of play on a sporting field.
| Has any man/woman (including your current partner) ever threatened or tried to do any of these with the intent to harm or frighten you? This includes face-to-face threats only and excludes incidents which occurred during the course of play on a sporting field.
| Has any man/woman (including your current partner) ever threatened or tried to do any of these with the intent to harm or frighten you? This includes face-to-face threats only and incidents that occurred on the job, at school or overseas. Excludes incidents which happened during the course of play on a sporting field.
| Has a man/woman (including your current partner) ever threatened or tried to do any of these with the intent to harm or frighten you? This includes face-to-face threats only and incidents that occurred on the job, at school or overseas. Excludes incidents which happened during the course of play on a sporting field.
|
Perpetrator categories
| Stranger Current partner Previous partner Boyfriend/girlfriend/date Other known person
| Stranger Current partner Previous partner Boyfriend/girlfriend/date Other known person
| Stranger Current partner Previous partner Boyfriend/girlfriend/date Other known person
| Stranger Current partner Previous partner Boyfriend/girlfriend/date Ex-boyfriend/girlfriend Other known person
| Stranger Current partner Previous partner Boyfriend/girlfriend/date Ex-boyfriend/girlfriend Family
Other known person
|
| Comparability | 1996 data is comparable with 2005, 2012, 2016 and 2021-22 data for types of violence and for broad perpetrator categories.
| 2005 data is comparable with 1996, 2012, 2016 and 2021-22 data for types of violence and for broad perpetrator categories.
| 2012 data is comparable with 1996, 2005, 2016 and 2021-22 for types of violence. 2012 data is comparable with 1996 and 2005 for broad perpetrator categories and 2016 and 2021-22 for broad and detailed perpetrator categories where they are common.
| 2016 data is comparable with 1996, 2005, 2012 and 2021-22 for types of violence. 2016 data is comparable with 1996 and 2005 for broad perpetrator categories and 2012 and 2021-22 for broad and detailed perpetrator categories where they are common.
| 2021-22 data is comparable with 1996, 2005, 2012, and 2016 for types of violence. 2021-22 data is comparable with 1996 and 2005 for broad perpetrator categories and 2012 and 2016 for broad and detailed perpetrator categories where they are common.
|
Violence - Most recent incident
Population
Information was obtained from men and women aged 18 years and over in the 2021-22 PSS who had experienced any incident of violence within the last 10 years involving:
- the occurrence or attempt of either physical or sexual assault
- the threat of either physical or sexual assault.
Definitions
Incident
An incident refers to an occurrence, attempt, or threat of either physical or sexual assault experienced by an individual.
Respondents were asked about the details of the most recent incident for 7 types of violence:
- Sexual assault by a male perpetrator
- Sexual assault by a female perpetrator
- Sexual threat by a male perpetrator (female respondents only)
- Physical assault by a male perpetrator
- Physical assault by a female perpetrator
- Physical threat by a male perpetrator
- Physical threat by a female perpetrator
Where the respondent may have been involved in continuous acts of a particular type of violence, they were instructed to only think about the most recent incident of that type of violence when answering the questions. This chapter covers details regarding the most recent incident (MRI) for each of these 7 types of violence.
Relationship to perpetrator
Relationship to perpetrator in MRI data refers to the perpetrator of the most recent incident only. In instances where more than one perpetrator was involved in the incident, respondents were asked to select the person that they thought was mainly responsible.
Methodology
The Violence MRI topic is designed to collect detailed information about the most recent incident of violence experienced in the last 10 years, for selected types of violence. For information about how the types of violence were collected, please refer to the Violence – Prevalence chapter.
The detailed information collected in Violence MRI includes characteristics of the incident itself, actions taken following the incident, and the impacts of the incident on the respondent. For example:
- The relationship of the perpetrator to the respondent
- The location of the incident
- Whether alcohol or any other substance was involved
- Whether the incident was reported to police
- Whether advice or support were sought after the incident
- Whether anxiety or fear was felt following the incident
- Whether any time was taken off work because of the incident
Detailed MRI information was not collected:
- if the most recent incident occurred more than 10 years ago – due to potential difficulties associated with recalling the incident.
- for the most recent incident of sexual threat by a male perpetrator (for male respondents) or by a female perpetrator (for both male and female respondents). Due to their low prevalence, reliable estimates about the characteristics of the MRI for these violence types are unable to be produced.
Further information regarding the collection of the following data items in the MRI topic:
- Police contact – The word ‘contacted’ was open to the respondent’s interpretation and may include both contact that did and did not amount to a formal report. Police may have been contacted by the respondent or someone else.
- Involvement of alcohol or any other substance – This includes any licit or illicit mood-altering substance. Includes where the respondent or the perpetrator had been drinking alcohol or using any other mood/behaviour-altering substance or were hung-over from alcohol or still recovering from the use of any other substance.
- Consulting doctor or other health provider about physical injuries sustained – This includes doctors in private practice, health centres, hospitals, emergency services etc. Includes only health practitioners who were visited for the treatment of injuries, and excludes visits to the doctor or any other health professional that were not for the purpose of treating injuries (e.g. counselling session).
- Sources of advice or support – Includes formal and informal sources of advice or support. Excludes anyone who was told or found out about the incident, but from whom the respondent did not actively seek advice or support (e.g. treatment sought for injuries which did not involve the respondent seeking advice or support).
- First person told – Includes telling anyone, from a friend to a formal service provider. The respondent did not necessarily have to seek advice or support from the person (e.g. the person may tell the police about the violence without perceiving this as seeking advice or support from them).
- Experience of anxiety or fear – If the anxiety or fear varied over time, respondents were asked to determine how often they experienced anxiety or fear on average during the 12 months after the incident.
Data items
The data items and related output categories for this topic are contained within the Violence Most Recent Incident tab in the data item list available under Downloads.
Data uses
Violence MRI data can be used to examine:
- the characteristics and nature of violent incidents, including information about the perpetrator, the violent behaviours involved, the location, whether alcohol or any other substance was involved, and whether physical injuries were sustained
- the actions taken in response to violent incidents, including whether the incident was reported to police and whether advice or support was sought after the incident
- the longer-term impacts of violent incidents, including whether anxiety or fear was experienced following the incident, whether time was taken off work, and whether changes were made to usual routine because of the incident
- differences between men and women, and other socio-demographic groups of interest, in the ways in which different types of violence are experienced.
Violence MRI data cannot be used to examine:
- the characteristics and nature of all incidents of violence ever experienced, as only information about the most recent incident that occurred in the last 10 years is collected for each type of violence
- the total number of violent incidents experienced
- the prevalence of particular types of violence in the population – the Violence – Prevalence topic has been designed to produce this data.
Interpretation
Points to be considered when using and interpreting data from this topic include:
- Violence MRI data is a subset of violence prevalence data and should not be used to estimate the prevalence of particular types of violence in the population, which the Violence Prevalence topic has been designed to do. This is because information is not collected about all incidents of each of the seven types of violence – only the most recent one. For example, a respondent may have experienced physical assault by a male stranger, and physical assault by a male previous partner. These are two incidents of the same type of violence – physical assault by a male. Information will be collected about only the more recent of the two incidents in the Violence MRI topic.
- Violence MRI data relates to the most recent incident of violence experienced only and is therefore not necessarily representative of all incidents of violence. Care should be taken in the way most recent incident data is interpreted and reported, and users should refrain from generalising the findings to all incidents. The estimates always represent the number and proportion of persons, rather than incidents (e.g. 70% of persons contacted the police about the most recent incident, rather than police being contacted about 70% of all incidents).
- Violence MRI data cannot be added across the different types of violence to produce an aggregated total for any of the data items. Persons may have experienced more than one type of violence and are included separately for each type they have experienced. As a person's experiences and subsequent actions may differ depending on the type of violence they experienced, conceptually it would be invalid to add together actions for all the different types of violence. For example, if a respondent had sought advice or support about their most recent incident of physical assault by a male but had not sought advice or support about their most recent incident of sexual assault by a male, they would be included in both categories if the data were simply combined. Consequently, violence MRI data should only be presented and analysed individually per the seven violence types.
- The same incident cannot be reported in more than one of the seven types of violence in the MRI topic. Instances in which a respondent experienced multiple types of violence within the one incident can only be reported once. For example, if a respondent who has been sexually assaulted has also experienced some of the behaviours which are classified as physical assault during the same incident (for example being slapped), information about the incident is only recorded as an incident of sexual assault (as per the hierarchy of violence types described in the Violence – Prevalence chapter), and not physical assault.
Comparability with previous surveys
Information about the most recent incident of violence was collected in all previous editions of the PSS, as well as the 1996 Women’s Safety Survey (WSS). The following should be noted when making comparisons:
- Analysis of changes over time are not recommended for timeframes that overlap.
- Detailed information about the most recent incident was not collected in the 2016 and 2021-22 PSS if the most recent incident occurred more than 10 years ago. This differs from the 1996 WSS and the 2005 and 2012 PSS, where detailed information was collected for incidents that occurred up to 20 years ago. This change was made due to reported difficulties respondents had with recalling the details of incidents that occurred more than 10 years ago, and also to reduce respondent burden. MRI data is still considered broadly comparable across the time series despite the change in timeframe from 2016 onwards.
- In contrast to the 2005 and 2012 PSS, the 2016 and 2021-22 PSS did not collect information about the most recent incident of sexual threat by a female for both male and female respondents, or the most recent incident of sexual threat by a male for male respondents, due to these being lower prevalence types of violence with higher levels of statistical error, for which reliable data is unable to be produced. The 1996 WSS also did not collect information about the most recent incident of sexual threat by a female.
- 'All reasons police contacted about most recent incident of assault' is a new data item in 2021-22, therefore comparative data from previous cycles in not available.
| 1996 Women's Safety Survey |
| 2005 Personal Safety Survey |
| 2012 Personal Safety Survey |
| 2016 and 2021-22 Personal Safety Survey |
|---|---|---|---|---|---|---|---|
| Population | Women aged 18 years and older | Men and women aged 18 years and older | Men and women aged 18 years and older | Men and women aged 18 years and older | |||
|
|
|
|
|
|
|
|
Perpetrator sex | Male and female |
| Male and female |
| Male and female |
| Male and female |
|
|
|
|
|
|
| |
Comparability | 1996 data is considered generally comparable with 2005, 2012, 2016 and 2021-22 data. |
| 2005 data is considered generally comparable with 1996, 2012, 2016 and 2021-22 data. |
| 2012 data is considered generally comparable with 1996, 2005, 2016 and 2021-2022 data. |
| 2016 and 2021-22 data are considered generally comparable with 1996, 2005 and 2012 data. |
Abuse before the age of 15
Population
Information regarding abuse experienced before the age of 15 was obtained from men and women aged 18 years and over in the 2021-22 PSS.
Definitions
The definition of child abuse can vary across the different sectors of government, criminal justice systems, service providers and research organisations, depending on the perspective and interests of the organisation that have created it. The PSS collects selected information about a person’s experience of sexual and physical abuse before the age of 15 years by any adult (male or female), including the person’s parents. For this topic, an adult is defined as someone aged 18 years or over.
The 2021-22 PSS definitions of sexual and physical abuse are outlined below.
Sexual abuse
Any act by an adult involving a child (under the age of 15 years) in sexual activity beyond their understanding, or contrary to currently accepted community standards. Excludes sexual abuse perpetrated by someone under the age of 18.
Physical abuse
Any deliberate physical injury (including bruises) inflicted upon a child (under the age of 15 years) by an adult. Excludes discipline that accidentally resulted in an injury, and physical abuse perpetrated by someone under the age of 18.
Methodology
The abuse topic asked respondents if they were sexually or physically abused by an adult before the age of 15.
For sexual abuse, respondents were asked:
- The next few questions are about any incidents of sexual abuse by an adult, before the age of 15. Were you sexually abused before the age of 15?
For physical abuse, respondents were asked:
- The next few questions are about any incidents of physical abuse, before the age of 15, where an adult, including your parents, deliberately injured you. This includes bruises. Were you physically abused before the age of 15?
Due to the sensitive nature of the topic, respondents had the option of declining to answer these questions.
If a respondent answered that they had experienced sexual or physical abuse before the age of 15, they were asked to identify all of the adult perpetrator types that abused them.
Information about the characteristics of the first incident of abuse was collected separately for sexual abuse and physical abuse. If the respondent indicated that they had been sexually/physically abused more than once, they were asked to focus on the first time they were sexually/physically abused to answer further questions about the characteristics of the first incident of abuse, including:
- their age at the time of the incident
- whether more than one perpetrator was involved
- their relationship to the perpetrator(s)
- whether the incident was ever reported to police (new 2021-22 data item).
If the respondent was unsure of their age at the time of the first incident, they were instructed to make their best guess.
Data items
The data items and related output categories for this topic are contained within the SPS Level – Abuse tab in the data item list available under Downloads.
Data uses
Abuse data can be used to examine:
- the relationship between experiences of sexual and physical abuse before the age of 15 and later experiences of violence as an adult
- the estimated number and proportion (rate) of persons aged 18 years and over who have experienced sexual and/or physical abuse before the age of 15, including by specific adult perpetrator types
- the characteristics of the first incident of sexual and physical abuse
- the relationship between experiences of child physical abuse, sexual abuse and witnessing violence before age 15.
Abuse data cannot be used to examine:
- prevalence rates for physical and sexual abuse perpetrated by a minor under the age of 18.
- the characteristics of all incidents of abuse. Characteristics information was only collected for the first incident of sexual abuse and first incident of physical abuse and is therefore not necessarily representative of all incidents of abuse that may have occurred. Users should avoid generalising these findings to all abuse incidents when evaluating the data.
- current rates of child abuse, and whether rates have increased or decreased over time. Abuse data collected in the PSS is a retrospective measure and cannot be used to monitor changes over time. As such, this data should not be compared across PSS cycles.
- rates of abuse in specific institutional settings. Although perpetrator information is collected, this is not always sufficient to determine whether the abuse occurred in an institutional setting or not.
Interpretation
Points to be considered when using and interpreting data for this topic include the following:
- The experience of physical abuse as a child is particularly difficult to measure, given changes in what is generally perceived as acceptable behaviour towards children in relation to discipline. For example, while caning was practised at schools in the past, this is no longer an accepted practice. As such, it is important to note that a respondent’s answer reflects their own interpretation of the question and what constitutes abuse.
- The prevalence of sexual and physical abuse before the age of 15 as measured by the PSS does not capture the total prevalence of child abuse, as the scope of the survey does not include persons aged under 18 years.
- Abuse data collected in the PSS is retrospective and relies on the respondent being able to accurately recall and interpret experiences from the past, and on their willingness to report them to an interviewer as adults.
Collection comparability with previous surveys
Information about experiences of abuse before the age of 15 was collected in the 1996 WSS and all editions of the PSS. The following changes have been made to the topic over time:
- Prior to 2016, the survey did not specify that an ‘adult’ is someone aged 18 years and over, and the term ‘adult’ was left to the respondent’s interpretation.
- The WSS only collected whether experienced sexual or whether experienced physical abuse and did not have an option to select a refusal category for either question.
- From 2016 onwards, the PSS asked respondents to identify all perpetrator types who have abused them before the age of 15. Prior to 2016, the survey only asked about the relationship to the perpetrator of the first incident of abuse.
- New perpetrator response categories were added in 2016 (foster carer or other person associated with care placement; other school-related staff; childcare worker; in-home care educator or carer; recreational leader; staff in a children’s home/orphanage; and corrective services personnel) and in 2021-22 (disability support worker or carer; and other staff member in an institution).
- In 2021-22, for the first time, the PSS asked respondents who had experienced physical/sexual abuse whether the first incident of each was ever reported to police.
Witnessing parental violence before the age of 15
Population
Information regarding witnessing parental violence before the age of 15 was obtained from men and women aged 18 years and over in the 2021-22 PSS.
Definitions
The PSS asked respondents if they ever saw or heard violence being directed at one parent by another (or by a partner who wasn’t a parent) before the age of 15.
In the context of this topic:
- Violence refers to physical assault only.
- Mother includes step-mothers and female guardians or caregivers. Partner includes the respondent’s father/stepfather, and the mother’s boyfriend or same-sex partner.
- Father includes step-fathers and male guardians or caregivers. Partner includes the respondent’s mother/stepmother, and the father’s girlfriend or same-sex partner.
Methodology
Respondents were asked whether they ever saw or heard any of the following being done to their mother and father by a partner, before the age of 15:
- threw anything that could hurt them
- pushed, grabbed or shoved
- slapped
- kicked, bit or hit with a fist
- hit with something else that could hurt
- beaten
- choked
- stabbed with a knife
- shot with a gun
- any other type of physical assault.
Respondents who reported having seen or heard any of the above being done to their mother and/or father by a partner were then asked how many times they saw or heard these things being done – ‘once or twice’ or ‘more than twice.’
Data items
The data items and related output categories for this topic are contained within the SPS Level – Witness Violence tab in the data item list available under Downloads.
Data uses
The data can be used to examine:
- the estimated prevalence (number and rate) of persons who have witnessed violence towards a parent by a partner before the age of 15
- the relationship between witnessing violence towards a parent by a partner before the age of 15 and later experiences of violence as an adult
- the relationship between experiences of child physical abuse, sexual abuse and witnessing violence before age 15.
The data cannot be used to examine:
- the prevalence of partner violence, as it only includes incidents of physical assault towards a parent by a partner that were witnessed by the respondent before the age of 15. Violence may have occurred but not been witnessed by the respondent, or the violence may have occurred after the respondent turned 15.
- current rates of children witnessing parental violence, and whether rates have increased or decreased over time. Witnessing parental violence as a child, as collected in the PSS, is a retrospective measure and cannot be used to monitor changes over time. As such, this data should not be compared across PSS cycles.
Interpretation
The following should be considered when using and interpreting data for this topic:
- The information collected was based on the respondent’s perceptions of the violence as a child, and their subsequent recollection of the events as an adult.
Collection comparability with previous surveys
This topic was first collected in the 2016 PSS. No changes were made to the topic for 2021-22.
Partner violence
Population
Information regarding partner violence experienced since the age of 15 was obtained from men and women aged 18 years and over in the 2021-22 PSS.
Definitions
Partner
The term 'partner' in the PSS is used to describe a person the respondent lives with, or lived with at some point, in a married or de facto relationship.
Current partner refers to a person the respondent currently lives with in a married or de facto relationship, at the time of the survey.
Previous partner refers to a person the respondent lived with at some point in a married or de facto relationship, from whom they are now separated (but may or may not still be living with them). This includes a partner the respondent was:
- living with at the time of experiencing violence
- no longer living with at the time of experiencing violence.
Partner violence
Partner violence refers to any incident of sexual assault, sexual threat, physical assault or physical threat by a current and/or previous partner.
Partner violence does not include violence by a current or former boyfriend/girlfriend or date, which refers to a person that the respondent dated, or was intimately involved with, but had never lived with.
Most recently violent previous partner
Where a person had experienced violence by more than one previous partner, they were asked to focus on the most recently violent previous partner when answering the more detailed questions. If the respondent had also experienced previous partner emotional and/or economic abuse, this may or may not have been the same violent previous partner.
Methodology
Respondents who identified that they had experienced an incident of violence by their current partner and/or a previous partner they had lived with in the Violence topic were sequenced into the Partner Violence topic to answer further questions about their experiences of partner violence since the age of 15. If the respondent had experienced both current partner and previous partner violence, the set of questions is asked separately for each type of partner.
Whilst some questions are very similar to those in the Violence topic that ask about the most recent incident (see Violence – Most Recent Incident (MRI) chapter of this publication), the Partner Violence topic is centred on incidents (and any resulting behaviours or actions taken) that occurred throughout the duration of the entire relationship and after the relationship ended (for previous partner violence), rather than just the most recent incident. For example, while the Violence MRI topic asked the respondent if they contacted the police about the most recent incident, the Partner Violence topic asked the respondent if they had ever contacted the police about any incident during the relationship or after the relationship ended.
Not all the same questions were asked for experiences of violence by both partner types. For example, some questions were only applicable when the perpetrator was a current partner while other questions were only applicable when the perpetrator was a previous partner.
Further information regarding the collection of the following data items:
- Length of relationship – The concept of the length of relationship is left to the respondent’s interpretation. They may, for example, base this on their first date, marriage, or when they moved in together.
- How often partner’s assaults or threats occurred during relationship – If the occurrence of assaults and threats varied over time, respondents are asked to determine how often the assaults or threats occurred on average.
- Sources of advice or support – Includes formal and informal sources of advice or support. Excludes anyone who was told or found out about the violence, but from whom the respondent did not actively seek advice or support (e.g. treatment sought for injuries which did not involve the respondent seeking advice or support).
- First person or service told – Includes telling anyone, from a friend to a formal service provider. The respondent did not necessarily have to seek advice or support from the person (e.g. the person may tell the police about the violence without perceiving this as seeking advice or support from them).
- Violence/restraining order ever issued against partner – Interviewers were trained to accept terminology used across different jurisdictions of Australia to label violence orders, including apprehended violence orders, domestic violence orders, intervention orders etc.
- Violence seen or heard by children in their care – Children in the respondent’s care can include the respondent’s or partner’s children, stepchildren, adopted or foster children.
- Whether violence increased while temporarily separated – ‘Increase’ was left to the respondent’s interpretation and may include an increase in severity and/or frequency. Respondents who experienced multiple temporary separations were asked if the violence increased on average across all the temporary separations.
- Experience of anxiety or fear – If anxiety or fear varied over time, respondents were asked to determine how often they experienced anxiety or fear on average.
Data items
The data items and related output categories for this topic are contained within the Partner Violence tab in the data item list available under Downloads. In addition, aggregate data items relating to this topic are contained within the SPS Level – PV & EMAB Aggregates tab.
Data uses
Partner violence data can be used to examine:
- the characteristics of the violence experienced over the course of the relationship, such as how often violence was experienced
- support-seeking behaviours, such as whether advice or support was ever sought and from whom
- police involvement, such as whether the police were ever contacted, and other legal actions taken, including whether the partner was charged, whether they went to court, and whether a restraining order was issued
- the impact of the partner violence on the respondent, including whether they experienced anxiety or fear because of the violence, changes to their usual routine, and whether they took time off work
- separations from a violent partner because of the violence, including whether they ever temporarily separated, reasons for separation, places stayed during temporary separations, whether left property or assets behind, and reasons for returning to the violent partner.
Partner violence data cannot be used to examine:
- the characteristics of all previous partner violence, as information is only collected for the most recently violent previous partner.
- the types of violence perpetrated by the violent partner. This information is not collected in the Partner Violence topic. Information about the types of violence experienced is collected in the Violence Prevalence topic.
- the characteristics of intimate partner violence where the respondent never lived with the perpetrator. These are classified as boyfriend/girlfriend/date and ex-boyfriend/ex-girlfriend relationships, and detailed information about violence experienced within these relationships is not collected in the Partner Violence topic.
- characteristics of the most recent incident of partner violence. Information about characteristics of the most recent incident of violence is collected in the Violence MRI topic, and will only include information about partner violence if the perpetrator of the most recent incident of any of the types of violence was a partner.
Interpretation
Points to be considered when using and interpreting data for this topic include the following:
- Partner Violence data cannot be broken down by the type of violence experienced (sexual/physical, assault/threat), only by the type of perpetrator (current or previous).
- Where a person has experienced violence by both a current and previous partner, information about the violence is collected separately for each partner type (and for previous partner, in relation to the most recent previous partner who was violent). Consequently, partner violence data can only be output and analysed through each partner type individually, and not as a combined total partner category.
- The level of detail available for partner violence data will vary depending on the type of partner violence (current or previous) and the sex of the respondent. Generally, more detailed information will be available for previous partner violence than for current partner violence, and where the sex of the respondent is female.
- Previous partner violence data relates to the most recently violent previous partner and is therefore not necessarily representative of all previous partner violence. Care should be taken in the way this data is interpreted and reported. Users should refrain from generalising the findings to all previous partner violence.
Collection comparability with previous surveys
Information about experiences of Partner Violence was collected in all editions of the PSS, as well as the 1996 Women’s Safety Survey, and the content collected is consistent. However, the following should be noted:
- Analysis of changes over time are not recommended for this topic.
- The Women’s Safety Survey only collected detailed information from women about the characteristics of violence by a male current and/or previous partner, whereas PSS collects detailed information from men and women about the characteristics of violence by a male or female current and/or previous partner.
- The data items within the ‘Separations from Partner’ topic underwent several revisions to the data item categories from PSS 2012 onwards. This resulted in either a reduction of categories in some items or an increase of categories in other items.
- The data items that involve restraining orders changed from 2016 onwards.
Partner emotional abuse
Population
Information regarding partner emotional abuse experienced since the age of 15 was obtained from men and women aged 18 years and over in the 2021-22 PSS.
Definitions
Partner
The term 'partner' in the PSS is used to describe a person the respondent lives with, or lived with at some point, in a married or de facto relationship.
Current partner refers to a person the respondent currently lives with in a married or de facto relationship, at the time of the survey.
Previous partner refers to a person the respondent lived with at some point in a married or de facto relationship from whom they are now separated (but may or may not still be living with them). This includes a partner the respondent was:
- living with at the time of experiencing emotional abuse
- no longer living with at the time of experiencing emotional abuse.
Emotional abuse
Emotional abuse occurs when a person is subjected to certain behaviours or actions that are aimed at preventing or controlling their behaviour, causing them emotional harm or fear. These behaviours are characterised in nature by their intent to manipulate, control, isolate or intimidate the person they are aimed at. They are generally repeated behaviours and include psychological, social, economic, and verbal abuse. Further details about the emotional abuse behaviours asked about in the PSS are provided in the Methodology section below.
Most recent emotionally abusive previous partner
Where a person had experienced emotional abuse by more than one previous partner, they were asked to focus on the most recent emotionally abusive previous partner when answering the more detailed questions. If the respondent had also experienced previous partner violence, this may or may not have been the same emotionally abusive previous partner.
Methodology
The Partner Emotional Abuse topic was designed to establish whether the respondent had experienced any manipulative or controlling behaviours from their current partner and/or from a previous partner since the age of 15. If the respondent had both a current partner and previous partner(s), the set of questions was asked separately for each type of partner.
In the PSS, a person was considered to have experienced emotional abuse if they reported they had experienced or been subjected to one or more of the following behaviours causing them emotional harm or fear:
- controlled or tried to control them from contacting family, friends or community
- controlled or tried to control them from using the telephone, internet or family car
- controlled or tried to control where they went or who they saw
- kept track of where they were and who they were with (e.g. monitoring social media, etc.)
- controlled or tried to control them from knowing, accessing, or deciding about household money
- controlled or tried to control them from working or earning money
- controlled or tried to control their income or assets
- controlled or tried to control them from studying
- deprived them of basic needs such as food, shelter, sleep, or assistive aids
- damaged, destroyed or stole any of their property
- constantly insulted them to make them feel ashamed, belittled or humiliated (e.g. put-downs)
- shouted, yelled or verbally abused them to intimidate them
- lied to their child/ren with the intent of turning them against them
- lied to other family members or friends with the intent of turning them against them
- threatened to take their child/ren away from them
- threatened to harm their child/ren
- threatened to harm their other family members or friends
- threatened to harm any of their pets
- harmed any of their pets
- threatened or tried to commit suicide (Note: this category has been changed for output to ‘Threatened or attempted suicide’).
The definition of emotional abuse excludes:
- cases of nagging, unless this nagging causes emotional harm or fear
- cases where a spouse has restricted the respondent’s access to money, the car, or the internet because of the respondent’s substance abuse, gambling, or compulsive shopping issues, unless the respondent perceives that these restrictions cause them emotional harm or fear.
Data items
The data items and related output categories for this topic are contained within the Partner Emotional Abuse tab in the data item list available under Downloads. In addition, aggregate data items relating to this topic are contained within the SPS Level – PV & EMAB Aggregates tab.
Data uses
Partner emotional abuse data can be used to examine:
- the prevalence of partner emotional abuse
- the characteristics of emotional abuse by a current and previous partner, such as the types of emotionally abusive behaviours experienced, how often the emotional abuse was experienced, and whether anxiety or fear was experienced as a result.
Partner emotional abuse data cannot be used to examine:
- the prevalence of emotional abuse by persons other than a partner the respondent lives or lived with. For example, information about emotional abuse by a family member or an intimate partner that the respondent never lived with (boyfriend or girlfriend) is not collected in the PSS.
- the characteristics of all previous partner emotional abuse, as detailed information is only collected for the most recent emotionally abusive previous partner. Respondents were, however, asked whether they experienced emotional abuse by more than one previous partner.
Interpretation
Points to be considered when using and interpreting data for this topic include the following:
- Whether or not the emotional abuse amounted to a criminal offence cannot be determined from the information collected.
- The PSS only asked respondents about selected emotional abuse behaviours, and therefore may not capture all forms of emotional abuse that exist.
- The recognition and identification of any behaviour as emotionally abusive was based on the respondent’s subjective beliefs. Individual differences in thresholds for what constitutes manipulative/controlling/isolating/intimidating behaviour resulting in fear or emotional harm will affect how respondents answer the questions.
- Conceptually it is invalid to add together data about the characteristics for current and previous partner emotional abuse, as the characteristics of partner emotional abuse could differ depending on the type of partner. This would also double count all persons who have experienced emotional abuse by both a current and previous partner.
- Emotional abuse by a previous partner may have occurred during and/or after the relationship ended.
- Previous partner emotional abuse data relates to the most recent emotionally abusive previous partner and is therefore not necessarily representative of all previous partner emotional abuse. Care should be taken in the way this data is interpreted and reported.
- In circumstances where respondents had difficulty answering questions about the frequency of behaviours, which may have varied over time, they were instructed to determine how often the behaviours occurred on average.
Comparability with previous surveys
Comparisons between the 1996 WSS and 2005 PSS, and subsequent PSS cycles are limited to only current partner emotional abuse (and for 1996 WSS, only male current partner), as the earlier survey editions did not collect information about experiences of previous partner emotional abuse. Users should also take into consideration:
- The expanded definition of partner emotional abuse when comparing data over time, as new behaviours were added in each new edition of the survey.
- Analysis of changes over time are not recommended for timeframes that overlap.
There were some minor changes to the question wording from the 2016 PSS onwards, however these do not impact on the overall comparability of 2016 and 2021-22 data with previous surveys. The changes include:
- Removing the word ‘intent’ from the initial question about whether the partner had caused the respondent emotional harm or fear (i.e. the respondent was asked whether they were caused emotional harm or fear, regardless of the intent of the partner).
- The words ‘stopped or tried to stop’ in the behaviour descriptions were replaced with ‘controlled or tried to control’.
- The words ‘monitored your whereabouts’ in the behaviour descriptions were replaced with ‘kept track of where you were and who you were with’.
- Social media was added as an example of monitoring behaviour that can occur online.
In the 2012 PSS, if a respondent experienced emotional abuse by both a male and female previous partner, information was collected separately for both the most recent emotionally abusive male previous partner and the most recent emotionally abusive female previous partner. This was changed in the 2016 PSS onwards, where information was collected only in relation to the most recent emotionally abusive previous partner overall. This has a negligible impact on comparability, as the number of respondents experiencing emotional abuse by both a male and female previous partner is very small.
New data items were added to the 2021-22 questionnaire that are not available in previous editions of the survey for historical comparison, including:
- whether emotional abuse occurred for the first time while living with previous partner
- whether emotional abuse experienced while living together with previous partner
- total length of relationship with emotionally abusive partner
- length of relationship with partner before first incident of emotional abuse occurred.
| 1996 Women's Safety Survey | 2005 Personal Safety Survey | 2012 Personal Safety Survey | 2016 and 2021-22 Personal Safety Survey | |
|---|---|---|---|---|
| Population | Women aged 18 years and older | Men and women aged 18 years and older | Men and women aged 18 years and older | Men and women aged 18 years and older |
| Timeframe | Experiences of male current partner emotional abuse since the age of 15 | Experiences of current partner emotional abuse since the age of 15 | Experiences of current/previous partner emotional abuse since the age of 15 | Experiences of current/previous partner emotional abuse since the age of 15 |
Definition
| Manipulation, isolation or intimidation by a current male partner
| Manipulation, isolation or intimidation by a current partner. Includes any persistent behaviour that seeks to control the respondent’s behaviour and contact with others.
| Emotional abuse occurs when a person is subjected to certain behaviours or actions that are aimed at preventing or controlling their behaviour with the intent to cause them emotional harm or fear. These behaviours are characterised in nature by their intent to manipulate, control, isolate or intimidate the person they are aimed at. They are generally repeated behaviours and include psychological, social, economic and verbal abuse. | Emotional abuse occurs when a person is subjected to certain behaviours or actions that are aimed at preventing or controlling their behaviour, and that cause them emotional harm or fear. These behaviours are characterised in nature by their intent to manipulate, control, isolate or intimidate the person they are aimed at. They are generally repeated behaviours and include psychological, social, economic and verbal abuse. |
Emotional abuse behaviours
|
|
|
|
|
Comparability
| 1996 data is limited to current male partner emotional abuse. As a result, only current male partner emotional abuse data from other years is comparable with 1996 data. While the data is comparable, users should remain mindful of the expanded definition of emotional abuse as new behaviours were added in each new edition of the survey.
| 2005 data is limited to current partner emotional abuse only. As a result, only current partner emotional abuse data from other years is comparable with 2005 data. While the data is comparable, users should remain mindful of the expanded definition of emotional abuse as new behaviours were added in each new edition of the survey.
| 2012 data is comparable with 1996 and 2005 data for current partner emotional abuse only, and 2016 and 2021-22 data for both current partner and previous partner emotional abuse. While the data is comparable, users should remain mindful of the expanded definition of emotional abuse as new behaviours were added in each new edition of the survey.
| 2016 and 2021-22 data is comparable with 1996 and 2005 data for current partner emotional abuse only, and 2012 data for both current partner and previous partner emotional abuse. While the data is comparable, users should remain mindful of the expanded definition of emotional abuse as new behaviours were added in each new edition of the survey.
|
Partner economic abuse
Population
Information regarding partner economic abuse experienced since the age of 15 was obtained from men and women aged 18 years and over in the 2021-22 PSS.
Definitions
Partner
The term 'partner' in the PSS is used to describe a person the respondent lives with, or lived with at some point, in a married or de facto relationship.
Current partner refers to a person the respondent currently lives with in a married or de facto relationship, at the time of the survey.
Previous partner refers to a person the respondent lived with at some point in a married or de facto relationship from whom they are now separated (but may or may not still be living with them). This includes a partner the respondent was:
- living with at the time of experiencing economic abuse
- no longer living with at the time of experiencing economic abuse.
Economic abuse
Economic abuse occurs when a person is subjected to certain behaviours or actions that are aimed at preventing or controlling their access to economic resources, causing them emotional harm or fear. These behaviours are characterised in nature by their intent to manipulate, control, isolate or intimidate the person they are aimed at, and are generally repeated. Further details about the economic abuse behaviours asked about in the PSS are provided in the Methodology section below.
Most recent economically abusive previous partner
Respondents who had experienced emotional abuse by a previous partner were asked if they had also experienced any economic abuse behaviours by their most recent emotionally abusive previous partner. Therefore, for respondents who had experienced both previous partner emotional abuse and previous partner economic abuse, the most recent emotionally/economically abusive previous partner was the same. If a respondent had not experienced any economic abuse behaviours by their most recent emotionally abusive previous partner, they were not asked if they experienced economic abuse by any other previous partner.
If the respondent had not experienced emotional abuse by a previous partner, they were asked whether they experienced any of the economic abuse behaviours (not already asked about in the Partner Emotional Abuse topic) by any previous partner. If the respondent had experienced economic abuse by more than one previous partner, they were asked to focus on the most recent economically abusive previous partner when answering the economic abuse behaviour and timeframe questions.
The most recent economically abusive previous partner may or may not have been the same as the previous violent partner.
Methodology
The Partner Economic Abuse topic was contained within the Partner Emotional Abuse topic of the survey and was designed to establish whether the respondent had experienced any economically manipulative or controlling behaviours by their current partner and/or by a previous partner since the age of 15. The set of questions were asked separately for economic abuse by a current partner and economic abuse by a previous partner (see Most recent economically abusive previous partner in the Definitions section above for how the previous partner is determined).
In the PSS, a person was considered to have experienced economic abuse if they reported they had experienced or been subjected to one or more of the following behaviours, causing emotional harm or fear:
- controlled or tried to control them from knowing about, having access to, or making decisions about household money
- controlled or tried to control them from working or earning money
- controlled or tried to control their income or assets
- controlled or tried to control them from studying
- deprived them of basic needs (e.g. food, shelter, sleep, assistive aids)
- damaged, destroyed or stole any of their property
- forced them to deposit income into their partner's bank account
- prevented them from opening or having them own bank account
- manipulated or forced them to cash in, sell or sign over any financial assets they own
- pressured or forced them to sign financial documents
- racked up significant debt on shared accounts, joint credit cards or in their name
- refused to contribute financially to them or the family, or would not provide enough money to cover living expenses
- refused to pay child support payments when required to (previous partner only)
- deliberately delayed property settlement after the relationship ended (previous partner only).
The definition of economic abuse excludes:
- cases where a spouse had restricted the respondent’s access to money, the car, or the internet because of the respondent’s substance abuse, gambling, or compulsive shopping issues, unless the respondent perceived that these restrictions caused them emotional harm or fear.
Data items
The data items and related output categories for this topic are contained within the SPS Level – Economic Abuse tab in the data item list available under Downloads.
Data uses
Partner economic abuse data can be used to examine:
- the prevalence of partner economic abuse
- the types of economically abusive behaviours experienced by a current partner and most recent economically abusive previous partner.
Partner economic abuse data cannot be used to examine:
- the prevalence of economic abuse by persons other than a partner the respondent lives or lived with. For example, information about economic abuse by a family member or an intimate partner that the respondent never lived with (boyfriend or girlfriend) is not collected in the PSS.
- the prevalence of specific economic abuse behaviours, as this information is only collected for the current economically abusive partner and most recent economically abusive previous partner.
Interpretation
Points to be considered when using and interpreting data for this topic include the following:
- Whether or not the economic abuse amounted to a criminal offence cannot be determined from the information collected.
- The PSS only asked respondents about selected economic abuse behaviours, and therefore may not capture all forms of economic abuse that exist.
- The recognition and identification of any behaviour as economically abusive is based on the respondent’s subjective beliefs. Individual differences in thresholds for what constitutes manipulative/controlling/isolating/intimidating behaviour resulting in fear or emotional harm will affect how respondents answer the questions.
- Conceptually it is invalid to add together data about the characteristics for current and previous partner economic abuse, as the characteristics of partner economic abuse could differ depending on the type of partner. This would also double count all persons who have experienced economic abuse by both a current and previous partner.
- Economic abuse by a previous partner may have occurred during and/or after the relationship ended.
- Previous partner economic abuse data refers to the most recent economically abusive previous partner and is therefore not necessarily representative of all previous partner economic abuse. Care should be taken in the way this data is interpreted and reported.
- Respondents who had not experienced economic abuse by their most recent emotionally abusive previous partner were not subsequently asked if they had experienced economic abuse by a different previous partner.
- Respondents who had experienced economic abuse by their most recent emotionally abusive previous partner were not asked if they had experienced economic abuse more recently by a different previous partner.
Comparability with previous surveys
Economic abuse as a distinct concept and topic was first introduced in the 2021-22 PSS. However, some of the economic abuse behaviours were collected as part of the emotional abuse topic, which has been running in the PSS since 2005, including:
- controlled or tried to control them from knowing about, having access to or making decisions about household money
- controlled or tried to control them from working or earning money
- controlled or tried to control their income or assets
- controlled or tried to control them from studying
- controlled or tried to control them from studying
- damaged, destroyed or stole any of their property.
New economic abuse behaviours that were added in 2021-22, include:
- forced them to deposit income into their partner's bank account
- prevented them from opening or having their own bank account
- manipulated or forced them to cash in, sell or sign over any financial assets they own
- pressured or forced them to sign financial documents
- racked up significant debt on shared accounts, joint credit cards or in their name
- refused to contribute financially to them or the family, or would not provide enough money to cover living expenses
- refused to pay child support payments when required to (previous partner only).
While specific behaviours that are common to the 2021-22 PSS and earlier versions of the survey can be compared, there are no comparable estimates of economic abuse prevalence prior to 2021-22.
Stalking
Population
Information regarding experiences of stalking since the age of 15 was obtained from men and women aged 18 years and over in the 2021-22 PSS.
Definition
In the PSS, stalking is defined as any unwanted contact or attention which could cause fear or distress. In addition, to be defined as stalking, the unwanted contact or attention had to occur on more than one occasion, or multiple types of unwanted contact or attention had to occur on one occasion only.
Methodology
The stalking topic consisted of a set of questions about experiences of stalking since the age of 15. The same set of questions was asked separately for stalking by a man and then stalking by a woman.
Respondents were asked if a man or a woman, including both people they know or a stranger, had ever done any of the following things to them, that could have caused them to feel fear or distress. Respondents were instructed to only include incidents where the contact was unwanted.
- Loitered or hung around outside their home.
- Loitered or hung around outside their workplace, school, or education facility.
- Loitered or hung around outside their place of leisure/social activities.
- Followed or watched them in person.
- Followed or watched them using an electronic tracking device (e.g. GPS tracking system, computer spyware).
- Maintained unwanted contact with them by phone, postal mail, email, text messages or social media websites.
- Posted offensive or unwanted messages, images, or personal information on the internet about them.
- Impersonated them online to damage their reputation.
- Hacked or accessed their email, social media, or other online account without their consent to follow or track them.
- Gave or left them objects where they could be found, that were offensive or disturbing.
- Interfered with or damaged any of their property.
The questions that determine if the definition of stalking is met, were repeated up to five times each for male and female perpetrators. The repeats stopped when:
- the definition of stalking was met (at which point the respondent proceeded to the questions regarding the most recent episode of stalking)
- the respondent had not reported an experience that met the definition of stalking and they either identified they had no (or no more) experiences to report or the limit of five repeats was reached.
For the most recent episode of stalking by a man and by a woman since the age of 15, the following information was collected:
- types of stalking behaviours experienced
- relationship to the perpetrator
- method of stalking in the first incident (new data item in 2021-22)
- when the most recent episode of stalking stopped or whether it was still occurring at the time of survey.
If the most recent episode of stalking by a man and by a woman occurred in the last 20 years, further information about the episode was collected, including:
- duration
- whether perceived as a crime at the time
- whether police contacted
- whether perpetrator charged by police
- all reasons police not contacted
- main reason police not contacted
- whether stalker ever assaulted or threatened to assault
- emotional reactions experienced
- areas of life impacted.
If more than one stalker was involved in the most recent episode, respondents were asked to identify who they perceived to be the main perpetrator.
Data items
The data items and related output categories for this topic are contained within the SPS Level – Stalking tab in the data item list available under Downloads.
Data uses
Stalking prevalence data can be used to examine:
- the estimated number and proportion (rate) of persons who have experienced stalking by a man and/or woman during the last 12 months and since the age of 15
- differences in the stalking prevalence rate between men and women, and other population groups of interest.
Most recent stalking episode data can be used to examine:
- differences between men’s and women’s experiences of stalking, including stalking behaviours experienced, impacts, actions, and outcomes
- differences between male-perpetrated stalking and female-perpetrated stalking, including stalking behaviours experienced, impacts, actions, and outcomes.
Interpretation
Points to be considered when using and interpreting data for this topic include the following:
- Whether or not any stalking behaviour amounted to a criminal offence cannot be determined from the information collected.
- The PSS only asked respondents about selected stalking behaviours, and therefore may not capture all forms of stalking that exist.
- The recognition and identification of any behaviour as stalking is based on the respondent’s subjective beliefs regarding the perceived intent behind the behaviour. Individual differences in thresholds for what constitutes unwanted contact or attention resulting in fear or distress will affect how respondents answered the questions about stalking.
- In rare instances where more than one person was involved in the stalking episode, respondents were instructed to select the person they perceived to be mainly responsible.
- Characteristics information was only collected for the most recent episode of stalking by a male and the most recent episode of stalking by a female, and is therefore not necessarily representative of all stalking episodes that may have occurred. For example, most recent episode data cannot be used to obtain the total number of people who have reported stalking to the police, as people may not have reported their most recent episode but may have reported other previous episodes. Most recent episode data also cannot be used to obtain prevalence rates for specific perpetrator types, as only information about the perpetrator of the most recent episode was collected.
- When asked about the duration of the stalking episode, if the stalking had stopped and started, respondents were asked to estimate the total time they thought they had been stalked, excluding the period/s when the stalking temporarily ceased.
- Most recent episode data for a male stalker and a female stalker cannot be combined to produce an aggregated total, as this would double count persons who have experienced stalking by both a male and female perpetrator. As a result, most recent episode data can only be output by male stalker and female stalker separately.
When interpreting data from the item ‘Whether most recent male/female stalker assaulted or threatened to assault’, data users should take note of the following:
- Respondents were asked if the stalker had ever assaulted or threatened to assault, without specifying a time period. Consequently, the assault or threat could have occurred at any point and not only during the episode(s) of stalking.
- The definition of assault and threat is broad, and a detailed set of questions/prompt cards were not included when respondents were asked this question. Respondents answered based on their own interpretation of assault/threat.
Comparability with previous surveys
Information about experiences of stalking was collected in all previous editions of the PSS, as well as the 1996 Women’s Safety Survey (WSS). The following should be noted when making comparisons:
- Analysis of changes over time are not recommended for timeframes that overlap.
- The 1996 WSS and the 2005 and 2012 PSS asked respondents about any experiences of stalking in their entire lifetime. The 2016 and 2021-22 PSS asked respondents about any experiences of stalking since the age of 15.
- The 1996 WSS collected information about the most recent episode of stalking, regardless of when it occurred. All PSS cycles collected information about the most recent episode of stalking only if it occurred in the last 20 years.
- The 1996 WSS only collected information about women’s experiences of stalking by a man. All PSS cycles collected information about men’s and women’s experiences of stalking by both a man and a woman.
- The types of stalking behaviours asked about have expanded over time to accommodate the increasing use of digital technologies as a medium for following and monitoring individuals. The stalking behaviours asked were expanded from 2016 onwards to include emerging communication and surveillance technologies, such as various electronic tracking devices, computer spyware, and tampering with online accounts, such as social media and email. Whilst the core stalking behaviours asked about are consistent across the different surveys, users should remain mindful of the additional stalking behaviours added from 2016 onwards when comparing this data across the time series.
| 1996 Women's Safety Survey | 2005 Personal Safety Survey | 2012 Personal Safety Survey | 2016 and 2021-22 Personal Safety Survey | |
|---|---|---|---|---|
| Population | Women aged 18 years and older | Men and women aged 18 years and older | Men and women aged 18 years and older | Men and women aged 18 years and older |
| Timeframe | Prevalence - Whether ever experienced stalking in lifetime | Prevalence - Whether ever experienced stalking in lifetime | Prevalence - Whether ever experienced stalking in lifetime | Prevalence - Whether ever experienced stalking since age 15 |
| Most Recent Episode - Any stalking that occurred in lifetime | Most Recent Episode - Stalking that occurred in the last 20 years | Most Recent Episode - Stalking that occurred in the last 20 years | Most Recent Episode - Stalking that occurred in the last 20 years | |
| Sex of stalker | Male | Male and female | Male and female | Male and female |
| Question | Has a man ever done any of these to you? Has a man ever done any of the following to you with the intent to harm or frighten you? | Has a man/woman ever done any of these to you? Which of the following did this man/woman do to you with the intent to harm or frighten you? | Has a man/woman ever done any of these to you? Which of the following did this man/woman do to you with the intent to harm or frighten you? | Has a man/woman ever done any of these things to you that could have caused you fear or distress? Include contact that was unwanted and ongoing occurrences of harassment or stalking. |
| Stalking behaviours |
|
|
|
|
| Comparability | 1996 stalking data is comparable with 2005 and 2012 stalking data. It is comparable with 2016 and 2021-22 stalking data only when both are restricted to a 12-month timeframe, due to the difference in the broader timeframe (lifetime experiences of stalking in contrast to experiences of stalking since the age of 15). Most recent episode data (proportions) remains comparable despite differences in the timeframe. Users should also consider the addition of behaviours introduced across cycles. |
2005 stalking data is comparable with 1996 and 2012 stalking data. It is comparable with 2016 and 2021-22 stalking data only when both are restricted to a 12-month timeframe, due to the difference in the broader timeframe (lifetime experiences of stalking in contrast to experiences of stalking since the age of 15). Most recent episode data (proportions) remains comparable despite differences in the timeframe. Users should also consider the addition of behaviours introduced across cycles. | 2012 stalking data is comparable with 1996 and 2005 stalking data. It is comparable with 2016 and 2021-22 stalking data only when both are restricted to a 12 month timeframe, due to the difference in the broader timeframe (lifetime experiences of stalking in contrast to experiences of stalking since the age of 15). Most recent episode data (proportions) remains comparable despite differences in the timeframe. Users should also consider the addition of behaviours introduced across cycles. | 2016 and 2021-22 stalking data is comparable with 1996, 2005 and 2012 stalking data only when restricted to a 12-month timeframe, due to the difference in the broader timeframe (experiences of stalking since the age of 15 in contrast of lifetime experiences of stalking). Most recent episode data (proportions) remains comparable despite differences in the timeframe. Users should also consider the addition of behaviours introduced across cycles. |
Data Output and Dissemination
Data availability
Results from the 2021-22 PSS are available in the form of:
- electronic publications (and associated data cubes) available free of charge on the ABS website
- special data services on request to meet specific information requirements.
This chapter outlines the products and services available and how to access them.
Publications
The first publication containing data from the 2021-22 Personal Safety Survey was released in March 2023 on the ABS website. Data presented in this publication provided a summary of the main findings from the topics collected in the survey, including experiences of physical and sexual violence, emotional abuse or violence by a partner, sexual harassment, stalking and experiences of sexual or physical abuse before the age of 15.
Additional thematic publications have also been released and can be found in the Related publications section of Personal Safety, Australia, 2021-22.
Data cubes containing tables of data are available in spreadsheet format under Data downloads for each publication. These tables include more detailed information about each of the topics summarised in the key findings. Both estimates and proportions/rates (as well as their relative standard errors) are included in the publication tables.
Supporting material
Supporting material is available in this publication to assist data users in analysing and interpreting the data from the survey. The following are available under Downloads:
- A representation of the computer-assisted interview questionnaire.
- Prompt cards used in the survey.
- A data item list containing details on the data items collected in the survey and the response categories available for each data item.
Special data services
While the published data is extensive and covers all the topics collected in the survey, additional data from the survey may be able to be provided upon request.
The ABS offers specialist consultancy services to assist data users with more complex information needs. However, as the level of detail or disaggregation of data that can be provided will depend on an assessment of data quality and reliability. The ABS will undertake an assessment of any request and determine whether the requested data is fit for purpose and of sufficient quality for the intended use. All specialist consultancy services attract a service charge, and data users will be provided with a quote before information is supplied.
If the information you require is not available from the publications, you may submit your request on the ABS website via the Consultancy Request Form , or contact the General Enquiries line (details located on the Contact Us page). The ABS Privacy Policy (www.abs.gov.au/privacy) outlines how the ABS will handle any personal information that you provide to us.
Data Quality and Technical Notes
Introduction
The estimates produced by the survey are based on information obtained from a sample of persons. Any data collection may encounter factors, known as non-sampling error, which can impact on the reliability of the resulting statistics. In addition, the reliability of estimates based on sample surveys are also subject to sampling variability. That is, the estimates may differ from those that would have been produced had all persons in the population been included in the survey. This is known as sampling error.
Sampling Error
Since the estimates are based on information obtained from a sample of the population, they are subject to sampling error (or sampling variability). That is, the estimates may differ from those that would have been produced had all persons in the population of interest been included in the survey.
The magnitude of the sampling error associated with a survey estimate depends on the following factors:
- Sample design – there are many different methods which could have been used to obtain a sample from which to collect data about experiences of violence. The final design attempted to make key survey results as representative as possible within cost and operational constraints (for further details see the Sample design and selection section of the Sampling chapter of this publication).
- Sample size – the larger the sample on which an estimate is based, the smaller the associated sampling error.
- Population variability – refers to the extent to which people in the target population differ on the particular characteristic being measured. This is referred to as the population variability for that characteristic. The smaller the population variability of a particular characteristic, the more likely it is that the population will be well represented by the sample, and therefore the smaller the sampling error. Conversely, the more variable the characteristic is in the population, the greater the sampling error.
Measures of sampling variability
Sampling error is a measure of the expected difference between published estimates (derived from a sample of persons), and the value that would have been produced if the total population (as defined for the scope of the survey) had been included in the survey. Sampling error is the result of random variation and can be estimated using measures of variance in the data.
One measure of sampling error is the standard error (SE) of the estimate, which indicates the extent to which an estimate might have varied from the true population value due to only a sample of persons being included in the survey. There are about two chances in three (67%) that the sample estimate will differ by less than one SE from the figure that would have been obtained if all persons had been surveyed, and about 19 chances in 20 that the difference will be less than two SEs.
Confidence intervals for example estimate
Image displays confidence intervals for an estimate within which a true population value could fall.
For estimates of population sizes, the size of the SE generally increases with the size of the estimate, so that the larger the estimate the larger the SE. However, the larger the survey estimate the smaller the SE becomes in percentage terms. Thus, larger survey estimates will be relatively more reliable than smaller estimates.
Another measure of the likely difference between the survey estimate and the true population value is the relative standard error (RSE), which is obtained by expressing the SE as a percentage of the estimate to which it is related. The RSE is a useful measure as it contextualizes the SE in relation to the size of the estimate.
\(\text{RSE %} = (\frac {SE} { estimate}) \times 100\)
From the 2012 Personal Safety Survey onwards, relative standard errors for estimates are published in 'direct' form. RSEs for estimates are calculated for each separate estimate and published individually using a replicate weights technique (Jackknife method). Direct calculation of RSEs can result in larger estimates having larger RSEs than smaller ones, since these larger estimates may have more inherent variability. More information about the replicate weights technique can be found below.
Estimates with an RSE of less than 25% are considered sufficiently reliable for most purposes. However, estimates with an RSE of 25% or more are also published in the results from the survey. Estimates with an RSE greater than 25% but less than or equal to 50% are annotated with an asterisk (*) to indicate they are less reliable and should be used with caution. Estimates with an RSE of greater than 50% are annotated by a double asterisk (**) and are considered too unreliable for most purposes.
The imprecision due to sampling variability, which is measured by the SE, should not be confused with inaccuracies that may occur because of reporting and/or recording errors made by respondents and/or interviewers during the course of the interview, and data coding and processing errors after enumeration is complete. Inaccuracies of this kind are referred to as non-sampling error, and they may occur in any data collection activity, whether it be a full count (census) or a sample survey. Non-sampling error is caused by factors other than those related to sample selection. It is any factor that results in the data values not accurately reflecting the true value of the population. In practice, the potential for non-sampling error can add to the inaccuracy of the estimates caused by sampling variability. It is not possible to quantify non-sampling error in the same way as sampling error, however every effort is made to reduce non-sampling error to a minimum by careful questionnaire design, intensive training and supervision of interviewers, and efficient operating procedures. For more details on non-sampling error, see below.
Calculation of standard error
The standard error of an estimate can be calculated using the estimate (count or proportion) and its corresponding RSE. For example, according to the results from the 2021-22 Personal Safety Survey (PSS), the estimated number of males aged 18 years and over who experienced physical assault in the last 12 months was 359,000. The RSE provided for this estimate is 19.3%. The standard error is calculated by:
\(\text{SE of estimate} = (\frac {RSE} { 100}) \times estimate\)
= (19.3 / 100) multiplied by 359,000
= 69,300 (rounded to the nearest 100)
Relative standard error of proportions
Proportions formed from the ratio of two estimates are also subject to sampling error. The size of the error depends on the accuracy of both the numerator and denominator. For proportions where the denominator is an estimate of the number of persons in a given population (e.g. all men who experienced physical assault by a male in the last 10 years), and the numerator is the number of persons in the denominator population with a particular characteristic (e.g. men who reported the most recent incident of physical assault by a male to police), a formula to approximate the RSE of the proportion is:
\(\text{RSE} (\frac {x} { y})\approx \sqrt{[RSE(x)]^2-[RSE(y)]^2}\)
This formula is only valid when the numerator (x) is a subset of the denominator (y).
The 2021-22 Personal Safety Survey (PSS) data tables provide relative standard error values for all published proportion estimates. If users wish to calculate the RSE of an unpublished proportion formed from the ratio of two published count estimates (and where one population is a subset of the other), the above approximation formula should be used.
Standard error of a difference
The difference between two survey estimates (counts or proportions) is itself an estimate, and therefore also subject to sampling variability. The sampling error of the difference between two estimates depends on their individual SEs and the level of statistical association (correlation) between the estimates. An approximate SE of the difference between two estimates (x-y) may be calculated using the following formula:
\(\text{SE} (x-y)\approx \sqrt{[SE(x)]^2+[SE(y)]^2}\)
This formula is only valid for differences between discrete and uncorrelated characteristics or sub-populations.
The approximate RSE of a difference between two survey estimates can be calculated from the SE using the following formula:
\(\text{RSE}(x-y)\approx\frac {SE (x-y)} { |x-y|}\)
Standard error of a sum
The sum of two survey estimates (counts or proportions) is itself an estimate, and therefore also subject to sampling variability. The sampling error of the sum of two estimates depends on their individual SEs and the level of statistical association (correlation) between the estimates. An approximate SE of the sum of two estimates (x+y) may be calculated using the following formula:
\(\text{SE} (x+y)\approx \sqrt{[SE(x)]^2+[SE(y)]^2}\)
This formula is only valid for sums of discrete and uncorrelated characteristics or sub-populations.
The approximate RSE of the sum of two survey estimates can be calculated from the SE using the following formula:
\(\text{RSE}(x+y)\approx\frac {SE (x+y)} { x+y} \)
Replicate Weights Technique
A class of techniques called 'replication methods' provide a general method of estimating variances for the types of complex sample designs and weighting procedures employed in ABS household surveys.
The basic idea behind the replication approach is to select sub-samples repeatedly from the whole sample, for each of which the statistic of interest is calculated. The variance of the full sample statistic is then estimated using the variability among the replicate statistics calculated from these sub-samples. The sub-samples are called 'replicate groups', and the statistics calculated from these replicates are called 'replicate estimates'.
There are various ways of creating replicate sub-samples from the full sample. The replicate weights produced for the 2021-22 PSS were created under the delete-a-group Jackknife method of replication (described below).
There are numerous advantages to using the replicate weighting approach, including the fact that:
- the same procedure is applicable to most statistics such as means, percentages, ratios, correlations, derived statistics and regression coefficients
- it is not necessary for the analyst to have available detailed survey design information if the replicate weights are included with the data file.
Derivation of replicate weights
Under the delete-a-group Jackknife method of replicate weighting, weights were derived as follows:
- 60 replicate groups were formed, with each group formed to mirror the overall sample. Units from a cluster of dwellings all belong to the same replicate group, and a unit can belong to only one replicate group.
- For each replicate weight, one replicate group was omitted from the weighting and the remaining records were weighted in the same manner as for the full sample.
- The records in the group that was omitted received a weight of zero.
- This process was repeated for each replicate group (i.e. a total of 60 times).
- Ultimately each record had 60 replicate weights attached to it with one of these being the zero weight.
Application of replicate weights
As noted above, replicate weights enable variances of estimates to be calculated relatively simply. They also enable unit record analyses such as chi-square and logistic regression to be conducted, which take into account the sample design.
Replicate weights for any variable of interest can be calculated from the 60 replicate groups, giving 60 replicate estimates. The distribution of this set of replicate estimates, in conjunction with the full sample estimate, is then used to approximate the variance of the full sample.
The formulae for calculating the standard error (SE) and relative standard error (RSE) of an estimate using this method are shown below:
\(\text{SE} (y)= \sqrt{(\frac{59}{60})\sum_{g=1}^{60}(y_g-y)^2}\)
where:
- g = (1, ..., 60) (the number of replicate weights)
- y(g) = estimate from using replicate weighting
- y = estimate from using full person weight.
The RSE(y) = SE(y)/y*100.
This method can also be used when modelling relationships from unit record data, regardless of the modelling technique used. In modelling, the full sample would be used to estimate the parameter being studied (such as a regression coefficient); i.e. the 60 replicate groups would be used to provide 60 replicate estimates of the survey parameter. The variance of the estimate of the parameter from the full sample is then approximated, as above, by the variability of the replicate estimates.
Availability of RSEs calculated using replicate weights
Actual RSEs for estimates (counts and proportions) have been calculated and are available in spreadsheet format (data cubes) under Data downloads found in the Personal Safety, Australia, 2021-22 publication and the associated thematic releases. The RSEs presented in the data cubes were calculated using the replicate weights methodology described above.
Significance testing of differences between survey estimates
When comparing estimates between surveys or between populations within a survey, it is useful to determine whether apparent differences are 'real' differences or simply the product of differences between the survey samples. One way to examine this is to determine whether the difference between the estimates is statistically significant. This is done by calculating the standard error of the difference between two estimates (x – y) and using that to calculate the test statistic using the formula below (the standard error of the difference between two estimates – the denominator in the below formula – can be calculated using the formula provided in 'Standard error of a difference' located above):
\( (\frac {x-y} { SE (x-y)}) \)
If the value of the test statistic is greater than 1.96, there is good evidence, with a 95% level of confidence, of a statistically significant difference between the two populations with respect to the characteristic being compared. Otherwise, it cannot be stated with confidence (at the 95% level of confidence) that there is a real difference between the populations.
Non-Sampling Error
Non-sampling error may occur in any data collection, whether it is based on a sample or a full count such as a census. Non-sampling errors occur when survey processes work less effectively than intended, and can occur at any stage throughout data collection and processing.
Every effort has been made to reduce non-sampling error through careful design and testing of the questionnaire, training of interviewers, and extensive editing and quality control procedures at all stages of data collection and processing.
The major sources of non-sampling error are:
- response errors due to incorrect interpretation or wording of questions
- errors related to recall and memory
- non-response bias due to non-responders in a sample differing from responders with respect to certain characteristics
- data processing errors, such as mistakes in the recording or coding of the data obtained.
These sources of error are discussed in more detail below.
Response errors
Response errors may have arisen from three main sources:
- flaws in questionnaire design and methodology
- flaws in interviewing technique
- inaccurate reporting by the respondent.
Errors may be caused by misleading or ambiguous questions, inadequate or inconsistent definitions of terminology used, or poor overall survey design (for example, context effects where responses to a question are directly influenced by the preceding questions). In order to overcome problems of this kind, individual questions and the questionnaire overall, were thoroughly tested before being finalised for use in the survey, and interviewers appropriately trained (for more details on testing undertaken and interviewer training, see the Survey Development and Data Collection chapter of this publication).
During testing, particular attention was given to the wording of questions and respondent interpretation of them, as well as to the interviewer instructions, to ensure that information collected fitted within the relevant definitions.
While the questionnaire has been improved and streamlined through rigorous testing, the type and amount of data required from the survey resulted in a complex questionnaire. In some cases, such as when a person had experienced incidents of violence by multiple perpetrators, errors may have resulted from the interviewer and/or the respondent's confusion.
In any survey, inaccurate reporting may occur due to respondents misunderstanding the questions or providing false information to protect their own or others’ privacy and personal safety. For example, some people may not have reported violent incidents they experienced, particularly if the perpetrator was somebody close to them, such as a partner or family member. However, conducting the interviews in private with respondents, and the use of Computer-Assisted Self-Interview (CASI) for the voluntary component of the survey, were procedures implemented to make respondents feel safe and comfortable to disclose sensitive information.
In addition, extensive editing and quality control procedures were applied at all stages of data processing. In situations where known inconsistencies remain in the data that are potentially open to misinterpretation, these are identified in the interpretation section of the relevant content topic chapters of this publication.
Errors related to recall
Recall errors may arise in a number of ways. People may forget to report, or may misreport the details of, incidents that occurred in the past. Recall errors are more likely to occur for information collected about incidents that occurred a long time ago.
To minimise the impact of recall error and reduce respondent burden, when collecting information about the characteristics of a person's most recent incident of the 8 types of violence, detailed information about the most recent incident was only collected if the incident occurred in the last 10 years.
Non-response bias
Non-response occurs when people are unable to or decline to participate in a survey, or are unable to be contacted. Non-response can affect the reliability of results by introducing bias. The impact of any bias depends on the rate of non-response and the extent of the difference between the characteristics of those people who responded to the survey and those who did not.
The 2021-22 PSS achieved an overall response rate of 52.2% (fully responding households, after sample and other loss). It is not possible to quantify the nature and extent of the differences in experiences of violence between respondents in the survey and non-respondents. However, under- or over- representation of particular demographic groups in the sample are compensated for in the weighting process, to achieve representativeness at the state/territory (for female sample), section of state (i.e. capital city and balance of state), sex, age group, and marital status levels. Other disparities are not adjusted for.
The following methods were adopted to reduce the level and impact of non-response:
- use of the Computer-Assisted Self-Interview (CASI) for the sensitive topics, or the alternative options of continuing with a face-to-face interview (Computer-Assisted Personal Interview or CAPI) or a telephone interview (Computer-Assisted Telephone Interview or CATI) with the respondent, conducted in a private setting
- the use of interviewers, where available, who could speak languages other than English (where the language spoken was able to be established)
- follow-up of respondents if there was initially no response after initial contact
- weighting to population benchmarks to ensure national representativeness for key populations of interest.
Interviews where the only questions that were not answered allowed 'don't know' or refusal options (such as income, current partner demographics, or abuse before the age of 15) were treated as fully responding for estimation purposes. These responses were coded to ‘Not known’ or ‘Refusal’ categories as applicable. Furthermore, the characteristics of an additional 2,310 respondents who completed only the compulsory component of the survey were able to be analysed for non-response bias. A selection of characteristics for this population are presented in Response Rates section of the Sampling chapter of this publication.
Processing errors
Processing errors may occur at any stage between the initial collection of the data and the final compilation of statistics. These may be caused by a failure of computer editing programs to detect errors in the data, or may occur during the manipulation of raw data to produce the final survey data files (e.g. while deriving new data items from raw survey data, or during the estimation procedures or weighting of the data file).
To minimise the likelihood of these errors occurring, a number of quality control processes were employed, including:
- within the instruments, trigram coders were used to aid the interviewer with the collection of demographic data, such as education level, country of birth and language spoken. This was complemented by manual coding of text fields where interviewers could not find an appropriate response in the coder.
- computer editing. Edits were devised to ensure that logical sequences were followed in the questionnaires, that necessary items were present, and that specific values lay within certain ranges. These edits were designed to detect reporting and recording errors, incorrect relationships between data items, and missing data items. Following the introduction of the Computer-Assisted Self-Interview option, the number of edits was reduced, with only key edits (such as those associated with perpetrator type and where sequencing would be impacted) applied to the instrument. Where there are known inconsistencies in reporting, these are discussed in the relevant survey content topic chapters.
- data file checks. At various stages during processing (such as after computer editing and subsequent amendments, weighting of the file, and derivation of new data items), frequency counts and/or tabulations were obtained from the data file showing the distribution of persons for different characteristics. These were used as checks on the contents of the data file, to identify unusual values which might have significantly affected estimates, and illogical relationships between data items not previously identified by edits. Further checks were conducted to ensure consistency between related data items, and between relevant populations.
- comparison with historical data. Where possible, checks of the data were undertaken to ensure consistency of the survey outputs against results of previous PSS cycles and comparable data available from other sources.
Other factors affecting estimates
In addition to data quality issues, there are a number of both general and topic-specific factors which should be considered when interpreting the results of the survey. The general factors affect all estimates obtained but may affect specific topics to a greater or lesser degree, depending on the nature of the topic and the intended use of the data. This section outlines these general factors. Topic-specific issues pertaining to the interpretation of data from specific survey topics are discussed in the individual survey content topic chapters of this publication.
Collection mode
Almost half of the respondents (46%) completed their survey as a full face-to-face survey (computer-assisted personal interview or CAPI) conducted by an interviewer. Approximately one-fifth (21%) of respondents completed part of their survey as a CAPI and then opted to complete a computer-assisted self-interview (or CASI). The CASI mode allowed respondents to report their information directly into the questionnaire on the interviewer’s laptop without the need to verbalise their experiences to an interviewer.
Telephone interviewing (computer-assisted telephone interview or CATI) was developed as a contingency during initial nationwide lockdowns during the COVID-19 pandemic. Small-scale testing was carried out in two stages in 2021 before being approved for use in the field in early 2022. Supporting telephone enumeration was critical to achieving collection outcomes, while ensuring interviewers and respondents remained safe and abided by public health guidelines. Approximately one-third (34%) of the sample were interviewed by telephone.
A review of prevalence data by sex and mode did not identify any systematic mode impacts, and the results produced were broadly consistent across the three different data collection modes used to enumerate the survey. Any differences that were found between the modes were small, and consistent with the expectation that there will be some natural variability in results across the mode types. All care was taken to preserve comparability with previous PSS results to enable time series comparisons.
Concepts and definitions
The scope of each topic and the concepts and definitions used therein should be considered when interpreting survey results. This information is available for individual survey content topics in this publication.
Reference periods
All results should be considered within the context of the experiential timeframe that apply to the various topics. Reference periods can differ across topics (e.g. since the age of 15 for violence and stalking prevalence and characteristics of partner violence; before the age of 15 for childhood abuse and witnessing parental violence; last 12 months for sexual harassment; last 10 years for characteristics of the most recent incident) and also across questions (e.g. ‘in the last 12 months’ and ‘in the 12 months after the incident’ for experiences of anxiety or fear). These timeframes should be taken into consideration when comparing results from the survey to data from other sources that may use different reference periods.
Classifications and categories
The classifications and categories used in the survey provide an indication of the level of detail available in survey output. However, the ability of respondents to provide the data may limit the amount of detail that can be output. Classifications used in the survey can be found in in the Classifications and Standards chapter of this publication.
Collection period
The 2021-22 PSS was enumerated from 28 March 2021 to 29 May 2022. When considering PSS results over time, or comparing them with data from other sources, users should take into account any differences between collection periods, and the possible effect of those differences on the data.
Confidentiality (incl. perturbation)
The Census and Statistics Act, 1905, provides the authority for the ABS to collect statistical information, and requires that statistical output shall not be published or disseminated in a manner that is likely to enable the identification of a particular person or organisation. This requirement means that the ABS must take care and make assurances that any statistical information about individual respondents cannot be derived from published data.
To minimise the risk of identifying individuals in aggregate statistics, a technique is used to randomly adjust cell values. This technique is called perturbation. Perturbation involves a small random adjustment of the statistics and is considered the most satisfactory technique for avoiding the release of identifiable statistics while maximising the range of information that can be released. These adjustments have a negligible impact on the underlying pattern of the statistics.
After perturbation, a given published cell value will be consistent across all tables. However, adding up cell values to derive a total will not necessarily give the same result as published totals. The following footnote has been included in all data tables, and diagrams and graphs where required: ‘Cells in this table have been randomly adjusted to avoid the release of confidential data. Discrepancies may occur between sums of the component items and totals.’
Perturbation has been applied to published data from the 2016 PSS onwards. Data from previous PSS editions and the 1996 WSS that are presented in the publications produced for the 2021-22 Personal Safety Survey have not been perturbed, but have been confidentialised to prevent the release of identifiable information about a person if required.
Classifications and Standards
Introduction
The following contains information about each of the ABS standard classifications and their general use in the 2021-22 Personal Safety Survey.
For more information about ABS standard classifications, see Classifications, standards and methods in the Statistics section of the ABS website.
Classification of country of birth
In the 2021-22 PSS, country of birth was classified to the Standard Australian Classification of Countries (SACC), 2016, incorporating updates through to, and including, 2019.
The 2016 SACC is the Australian statistical standard for social statistics classified by country and is intended for use in the collection, storage and dissemination of all Australian social statistics classified by country.
The identification of country units in the classification, and the way in which they are grouped, does not imply the expression of any opinion on the part of the ABS concerning the legal status of any country, territory, or area, or concerning the delimitation of its frontiers or boundaries.
While survey results can be classified to the 4-digit (individual country) level, the survey sample is often not sufficient to support reliable estimates at this level of detail. For general purposes, classification of country of birth to the 2-digit Minor Group level (broad geographic regions e.g. Southern Asia) is more suitable.
This classification has been used for the following data items:
- country of birth (respondent)
- country of birth of respondent's current partner that they live with (if applicable)
- country of birth of mother (respondent)
- country of birth of father (respondent).
Classification of language
In the 2021-22 PSS, language information for the respondent was classified to the Australian Standard Classification of Languages (ASCL), 2016.
The 2016 ASCL was produced to meet a statistical and administrative need for a standard classification of languages. It was designed for use in the collection, aggregation and dissemination of data relating to language usage in Australia.
All world languages are in scope of the classification, and languages with significant numbers of speakers in Australia are separately identified within the classification structure.
While survey results can be classified to the 4-digit (individual language) level, the survey sample is often not sufficient to support reliable estimates at this level of detail. For general purposes, classification of language to the 2-digit Minor Group level (broad language groups e.g. East Slavic) is more suitable.
This classification has been used for the following data items:
- first language spoken as a child
- main language spoken at home.
Classification of education
In the 2021-22 PSS, education information for the respondent was classified to the Australian Standard Classification of Education (ASCED), 2001.
The 2001 ASCED is a statistical classification designed for use in the collection and analysis of data on educational activity and attainment. The ASCED includes all sectors of the Australian education system, including schools, vocational education and training, and higher education. The ASCED is comprised of two component classifications: 'Level of Education' and 'Field of Education'. It provides a basis for compiling comparable administrative and statistical data on educational activities and attainment classified by level and field.
While survey results for field of study can be classified to the 6-digit (Detailed Fields) level, the survey sample is often not sufficient to support reliable estimates at this level of detail. For general purposes, classification of main field of study to the 1-digit Broad Fields level (broad fields of study e.g. Engineering and related technologies) is more suitable. Similarly, while survey results for level of education can be classified to the 3-digit (Detailed Levels) level, classification to the 1-digit Broad Levels level (broad levels of education e.g. Bachelor degree level) is more suitable.
This classification has been used for the following data items:
- level of highest non-school qualification
- main field of highest non-school qualification
- level of highest educational attainment
- main field of highest educational attainment
- level of current study
- main field of current study.
Classification of industry
In the 2021-22 PSS, industry of main job was classified to the Australian and New Zealand Standard Industrial Classification (ANZSIC), 2006 (Revision 2.0).
The ANZSIC has been jointly developed by the ABS and Statistics New Zealand. The ANZSIC provides a basis for the standardised collection, analysis, and dissemination of economic data on an industry basis for Australia and New Zealand. The use of ANZSIC enhances the comparability of industry statistics produced by the two countries.
While survey results for industry of main job can be classified to the 3-digit (Group) level, the survey sample is often not sufficient to support reliable estimates at this level of detail. For general purposes, classification of industry of main job to the top Division level (e.g. Construction) is more suitable.
Classification of occupation
In the 2021-22 PSS, occupation in main job was classified to the Australian and New Zealand Standard Classification of Occupations (ANZSCO), 2013, Version 1.3.
ANZSCO provides a basis for the standardised collection, analysis, and dissemination of occupation data for Australia and New Zealand. The use of ANZSCO improves the comparability of occupation statistics produced by the two countries.
While survey results for occupation in main job can be classified to the 6-digit (detailed occupation) level, the survey sample is often not sufficient to support reliable estimates at this level of detail. For general purposes, classification of occupation of main job at the 1-digit Major Group level (broad occupation groups e.g. sale workers) is more suitable.
Geography and SEIFA
The geography produced for the 2021-22 PSS used the 2016 Australian Statistical Geography Standard (ASGS): Volume 1, Volume 4 and Volume 5, and SEIFA used the 2016 Socio-economic indexes for areas.
The ASGS is a social geography, developed to reflect the location of people and communities, and used for the release and analysis of statistics and other data. The ASGS is updated every 5 years to account for growth and change in Australia's population, economy and infrastructure.
SEIFA combines Census data such as income, education, employment, occupation, housing and family structure to summarise the socio-economic characteristics of an area.
Geography items output from the 2021-22 PSS include:
- State or Territory of usual residence
- Remoteness Areas
- Section of State
- Greater Capital City Statistical Areas
- Index of relative socio-economic advantage and disadvantage (score and deciles)
- Index of relative socio-economic disadvantage (score and deciles).
Further details can be found in the Household geography and Socio-economic indexes for areas (SEIFA) section of the Household and Demographic Characteristics chapter of this publication.
Abbreviations
| Abbreviations | |
|---|---|
| ABS | Australian Bureau of Statistics |
| ABSCQ | Australian Bureau of Statistics Classification of Qualifications |
| ANZSCO | Australian and New Zealand Standard Classification of Occupations |
| ANZSIC | Australian and New Zealand Standard Industrial Classification |
| ARA | Any responsible adult |
| ARIA+ | Accessibility and Remoteness Index of Australia |
| ASCED | Australian Standard Classification of Education |
| ASCL | Australian Standard Classification of Language |
| ASGS | Australian Statistical Geography Standard |
| CAI | Computer Assisted Interview |
| CAPI | Computer-Assisted Personal Interview |
| CASI | Computer-Assisted Self-Interview |
| CATI | Computer-Assisted Telephone Interview |
| CAWI | Computer-Assisted Web Interview |
| COB | Country of Birth |
| COVID-19 | Coronavirus disease 2019 |
| DSS | Department of Social Services |
| FR | Fully Responding |
| GCCSA | Greater Capital City Statistical Areas |
| GPS | Global Positioning System |
| HRP | Household reference person |
| MESC | Main English-Speaking Country |
| MMS | Multi-media messaging service |
| MRI | Most recent incident |
| OECD | Organisation for Economic Co-operation and Development |
| PSS | Personal Safety Survey |
| RA | Remoteness Areas |
| RSE | Relative Standard Error |
| SACC | Standard Australian Classification of Countries |
| SAG | Survey Advisory Group |
| SDAC | Survey of Disability and Carers |
| SE | Standard Error |
| SEIFA | Socio-economic Indexes for Areas |
| SMS | Short message service |
| SOS | Section of State |
| TAFE | Technical and Further Education |
| WSS | Women's Safety Survey |
Downloads
PSS 2021-22 Questionnaire
PSS 2021-22 Prompt Cards
PSS 2021-22 Data Item List
Related Information
Personal Safety Survey current and historical releases
For details on publications released as part of the 2021-22 Personal Safety Survey, please refer to Personal Safety, Australia, 2021-22. Prior PSS releases can also be accessed via the Previous Release tab of the same publication. Prior versions of the PSS User Guide can be accessed via the Previous Release tab of this User Guide.
For information on the Women’s Safety Survey, please refer to Women’s Safety Australia, 1996 or Women’s Safety, Australia: User Guide, 1996 .
Related conceptual papers and frameworks
The following papers provide context around measuring violence (including family, domestic and sexual violence) in Australia and the differences between available data sources:
- Foundation for a National Data Collection and Reporting Framework for family, domestic and sexual violence
- Bridging the data gaps for family, domestic and sexual violence
- Defining the Data Challenge for Family, Domestic and Sexual Violence
- Directory of Family, Domestic, and Sexual Violence Statistics