UNSW-ESCoE Conference on Economic Measurement: Opening address
Advances in Economic Measurement
Dr David Gruen AO
Australian Statistician
Monday 25 November 2024
Introduction
I was born in Sydney and have lived here for a couple of extended periods of time. I thank the Traditional Custodians of the land who have cared for it over millennia. I pay my respects to their Elders and acknowledge and welcome members of the Aboriginal and Torres Strait Islander community who are attending today.
Thank you for the opportunity to give the opening address at the UNSW-ESCoE Conference on Economic Measurement.
My aim is to give you a sense of some of the developments that have a bearing on economic measurement. I hope to convince you that there are interesting issues in economic measurement – issues where the attention of academics and collaboration between academics and national statistical offices will pay dividends.
I’ll touch on a few different topics rather than give a detailed account of any one in particular. My aim is to whet your appetite to learn more and hopefully to convince you to add to the stock of knowledge on these important topics!
Updating frameworks for economic statistics
It is a truth universally acknowledged that economic statistics are underpinned by standards, frameworks and classifications and, because economies and societies change, these standards must be in want of updating.
Australia has just updated the classification of occupations in the Australian labour market. The previous classification, the Australian and New Zealand Standard Classification of Occupations (ANZSCO), dates from 2006 and was the classification for occupations in both the Australian and New Zealand labour markets, as the name implies. The new classification is for the Australian labour market alone – so bungy jump master will no longer be separately identified – and the classification goes by the catchier acronym, OSCA – Occupation Standard Classification for Australia. It is due to be officially launched early next month.
In the realm of economic statistics, probably the most significant standard is the standard that underpins the National Accounts, known as the System of National Accounts (SNA).
The most recent update to the SNA was in 2008. Inconveniently for all concerned, this update coincided with the global financial crisis, rendering implementation of SNA 2008 much more fraught than it should have been.
A huge amount of work has gone into the current update of the SNA, which is expected to be ratified by the United Nations Statistical Commission (UNSC) in March next year: hence SNA 2025.
As you would expect, there are many aspects of SNA 2025. I thought I would tell you a little about two of them:
- the treatment of data as an asset and
- the treatment of non-renewable resources.
Data as an Asset
Over the past generation, there has been an explosion in the use and value of data in our societies. Think, for example, of the central role data plays in the success of the world’s largest companies – Amazon, Apple, Google and Meta (perhaps also Nvidia).
Therefore, it seems desirable to include some forms of data as economic assets in the National Accounts. The difficulties arise when one moves from the conceptual to the specific – decisions must be made about which types of data to include and how to measure them.
SNA 2025 defines data as “information content that is produced by accessing and observing phenomena; and recording, organising and storing information elements from these phenomena in a digital format, which provide an economic benefit when used in productive activities”.
Thus defined, data is the result of production. It must have labour and/or capital inputs and must be produced and used in production for more than a year to meet the SNA requirements of an asset and be capitalised in the National Accounts.
The recommended approach to estimating the value of data as an asset is to estimate the value of the labour input – considering the wages paid for specific occupations and the proportion of time spent creating data assets.
Even with this level of guidance, several important decisions remain to be made to derive empirical estimates. Our current estimates – which remain preliminary – are that including data as an asset will raise the level of GDP by a few percentage points.
Non-Renewable Resources
Another important change in SNA 2025 involves the treatment of non-renewable resources – a change of particular interest for Australia given our extensive endowment of these resources. [1]
While SNA 2008 ignores depletion of non-renewable resources as a cost of production, SNA 2025 includes depletion as a cost of production in the central National Accounts framework. This will increase the coherence between the SNA and the System of Environmental Economic Accounting (SEEA).
While this change in treatment won’t have an impact on GDP, it will lower estimates of Net Domestic Product. Depletion, as well as consumption of fixed capital, will be subtracted from GDP to derive this net measure.
To derive an estimate of the volume of non-renewable resources in the ground that have economic value requires considering both new discoveries and depletion of the resource as it is extracted and sold. It also requires an estimate of the market price of the resource in the ground, which determines the contribution each resource (e.g., iron ore, coal, gold) makes to the aggregate estimate.
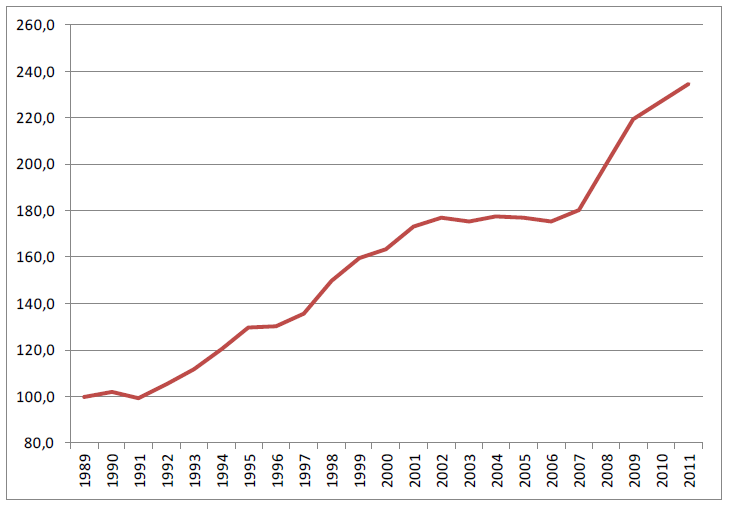
The most recent estimates of the volume of Australian non-renewable resources were developed by Paul Schreyer and Carl Obst nearly a decade ago and show an interesting interplay between new discoveries and the depletion of the existing resource. Figure 1 shows these estimates in the form of an index of the volume of economically viable Australian mineral and energy resources in the ground (or under the sea near the coast). [2]
Figure 1: Volume of Australian mineral and energy resources, index (1989 = 100)
Image

Description
This figure shows estimates in the form of an index of the volume of economically viable Australian mineral and energy resources in the ground (or under the sea near the coast). The estimated volume of economically viable Australian mineral and energy resources more than doubled over the two decades from the end of the 1980s. Over this period, new discoveries more than offset the depletion of resources via extraction.
Source: Schreyer, P. and Obst, C., (2015), "Towards Complete Balance Sheets in the National Accounts: The Case of Mineral and Energy Resources", OECD Green Growth Papers, No. 2015/02, OECD Publishing, Paris
As the above figure shows, the estimated volume of economically viable Australian mineral and energy resources more than doubled over the two decades from the end of the 1980s. Over this period, new discoveries more than offset the depletion of resources via extraction. These are finite non-renewable resources, so this pattern of rising estimated volumes of economically viable resources cannot continue forever. But it can continue for an extended time.
Over the two decades from the late 1980s, new discoveries of natural gas made by far the largest contribution to growth in the estimated volume of Australian mineral and energy resources. Perhaps surprisingly, iron ore also contributed to growth because new discoveries of economically viable ore exceeded the large quantity of iron ore extracted and sold over this time.
The other interesting aspect of this change to the National Accounts framework is that the economic viability of non-renewable resources can change profoundly with changes in the economy and society. To give a contemporary example, the global effort to respond to climate change has very significantly enhanced the value of minerals in the ground like lithium as well as a range of rare earths. [3] At some point, it will undoubtedly have the opposite effect on coal and fossil fuels. Economic responses to climate change also raise the likelihood that assets can become stranded.
SNA 2025 also recommends a change in how ownership of these non-renewable resources is allocated. Currently the total resources value is allocated to the legal owner – the general government. SNA 2025 proposes to split ownership of these assets between the government, private sector, and traditional owners based on the risks and rewards faced by these different sectors.
There are clear measurement challenges in accurately estimating the volume of Australian mineral and energy resources. The current methodology relies heavily on historical data, assumptions such as the discount rate, and modelling. A review of the methodology and the assumptions will be needed before the changes are implemented.
Additional data will be required, among other things for estimating the economic ownership split between governments, miners and traditional owners. We are working with states and territories to source disaggregated royalty payment data, and with relevant federal departments to source disaggregated mining tax data to develop more accurate estimates.
The Consumer Price Index (CPI)
Let me turn to the topic of data collection, and how it has changed. Rather than focus on broad trends – which I can summarise as more digital and less direct collect – I thought I would give a concrete example by comparing the compilation of the consumer price index twenty years ago and today.
Twenty years ago, prices for the CPI were collected entirely by ABS field officers collecting prices in each of the capital cities. This required the ABS to maintain field officers in each city – about 20 in total – who visited stores and entered prices on a handheld device. This was an expensive way to collect data, and it limited the number of outlets we could visit and the number of prices we could collect to around 100,000 each quarter.
Fast forward twenty years and around half the CPI basket is compiled using prices from administrative data and other forms of digitally collected data. The most notable of these is supermarket ‘scanner’ data, which allows us to include every product sold in the four major supermarket chains, rather than a small sample. We also make use of the quantity data to dynamically update the CPI basket weights each month.
In addition to scanner data, we use data collected by third party providers, administrative data from governments and web-scraped data. We now use millions of prices each month (too many to count) to produce the CPI.
For the other half of the CPI, prices are collected from websites and by calling businesses, rather than visiting them, as was the case at the turn of the century. This change was made before the COVID-19 pandemic and meant there was no interruption to our price collection when social distancing became a thing.
The passage of twenty years has seen significant changes in the goods and services that households consume. In contrast to twenty years ago, the CPI now includes prices for streaming services, ride sharing (think Uber), shared accommodation (think Airbnb), electric vehicles and food delivery services.
With the advent of new data sources, the CPI is of higher quality and produced at lower cost. The new data sources have enabled us to publish a monthly CPI indicator more cheaply than previously would have been possible. The monthly CPI indicator reflects up-to-date prices for around two thirds of the basket of goods and services in any given month of the quarter but is compiled using IT systems built in 1993 – the year inflation targeting began!
A welcome injection of funds from government is enabling us to move to a complete monthly CPI from the end of 2025, bringing us in line with the rest of the OECD (apart from New Zealand).
I want to take this opportunity to record my appreciation to Kevin Fox for his long and productive association with the ABS. In the early-to-mid 2000s, Kevin led research on the use of scanner data in the CPI. The method he and his colleagues developed underpins what the ABS has used in the CPI since 2017. Kevin’s contributions have also been the catalyst for many of the recent enhancements to the CPI, including the move to a monthly CPI.
As Leigh Merrington and Jason Atkinson are discussing the monthly CPI in a later session, I will leave further details to them.
Business Longitudinal Analysis Data Environment (BLADE) and Person-Level Integrated Data Asset (PLIDA)
A final topic I want to mention is the impressive growth in integrated data assets in recent years. [4] This development should be of interest to this audience because it facilitates economic research on a much wider range of topics than was previously possible.
I will talk specifically about the Business Longitudinal Analysis Data Environment (BLADE) and Person-Level Integrated Data Asset (PLIDA), both hosted by the ABS. The critical developments that led to the first versions of these integrated data assets occurred in 2015. They are now the two largest and most extensive integrated data assets in Australia. [5]
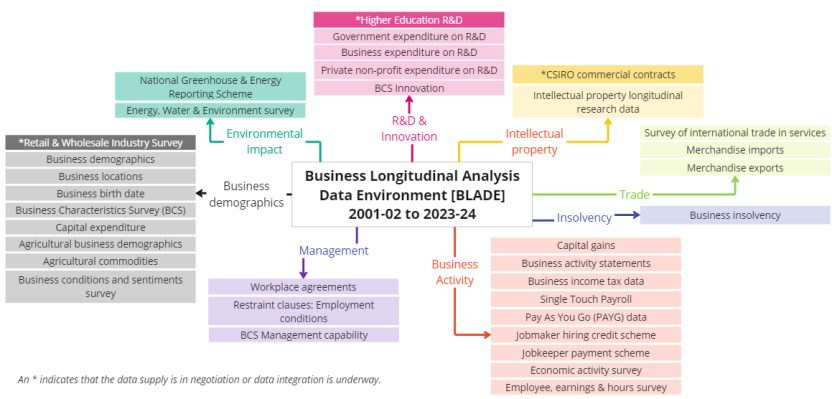
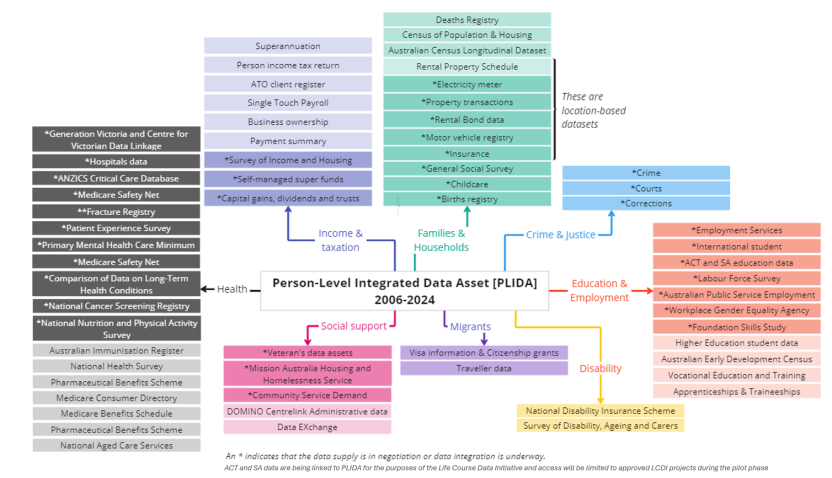
Figures 2 and 3 show the array of datasets that now make up these two data assets. BLADE includes surveys on a wide range of business characteristics, data on business income and tax, on exports and imports, insolvency, and employment conditions.
Figure 2: Business Longitudinal Analysis Data Environment (BLADE) Datasets
Image

Description
This figure outlines all the datasets included in the Business Longitudinal Analysis Data Environment (BLADE). BLADE is an economic data tool combining tax, trade and intellectual property data with information from ABS surveys to provide a better understanding of the Australian economy and businesses performance over time.
Figure 3: Person Level Integrated Data Asset (PLIDA) datasets
Image

Description
This figure outlines the all the datasets included in the Person-Level Integrated Data Asset (PLIDA). PLIDA is a secure data asset combining information on health, education, government payments, income and taxation, employment, and population demographics (including the Census) over time. It provides whole-of-life insights about various population groups in Australia, such as the interactions between their characteristics, use of services like healthcare and education, and outcomes like improved health and employment.
PLIDA includes information from the Census, tax return data, data on social security recipients, migrants, and on health, education, and disability.
Further datasets marked with a ‘+ sign’ are in the process of being added to these integrated data assets.
These integrated data assets are therefore providing analysts with increasingly powerful tools to shed light on economic research questions across multiple dimensions. They can be accessed virtually for economic research projects.
Conclusion
To conclude, I hope I have convinced you that there is much progress in work on economic measurement and many topics that benefit from collaboration between academics and official statisticians.
I hope many of you will take up the invitation to contribute to that effort, at this conference and beyond.
Thank you.
Footnotes
[1] There are also proposed changes relevant to renewable energy resources. The proposal is to extend the economic asset boundary to include these resources.
[2] Schreyer, P. and Obst, C., (2015), "Towards Complete Balance Sheets in the National Accounts: The Case of Mineral and Energy Resources", OECD Green Growth Papers, No. 2015/02, OECD Publishing, Paris.
[3] With many previously economically unviable lithium deposits now viable, a combination of price and volume effects led to a rise in the value of Australian lithium exports from $1.6billion in 2021 to $18.8billion in 2023.
[4] Datasets are ‘integrated’ when they are linked together so that analysts can study several aspects of individuals’ (or individual businesses’) behaviour together. The unit records are linked together in such a way that records from different datasets (for example, health and tax records) are identified as being for the same person (or same business). This is done via a spine that is common across the linked datasets (see https://www.abs.gov.au/about/data-services/data-integration/person-linkage-spine for further information). The individual records are de-identified so that privacy is preserved, and the identity of individuals (or individual businesses) is not revealed. It is incumbent on the hosts of these data assets, in this case the ABS, to ensure they are secure, with well-developed protocols to ensure the private information of individuals and businesses is protected and is not compromised.
[5] See https://www.abs.gov.au/about/our-organisation/australian-statistician/speeches/data-linkage-and-integration-improve-evidence-base-public-policy-lessons-australia for a history of the development of BLADE and PLIDA.