In the 2021 Census, the number of people counted as usual residents of the Australian Capital Territory (ACT) was 454,000. This was up from 397,000 in 2016. Fifty years ago, in 1971, the Census counted 137,000 people.
Snapshot of Australian Capital Territory
High level summary data for Australian Capital Territory in 2021
Released
28/06/2022
Population
Age
The median age (AGEP) for people from the ACT has been on the rise. In 1971, the median age was 23 years. The median age was 35 years in both 2016 and 2021. The Australian median age was 38 years in 2021.
Aboriginal and Torres Strait Islander peoples
In the 2021 Census, 9,000 people identified as being of Aboriginal and/or Torres Strait Islander origin (INGP) in the ACT, making up 2.0% of the ACT population. This was an increase from 6,500 counted in 2016, and lower than the Australian percentage of 3.2% in 2021.
For more information, see Australian Capital Territory: Aboriginal and Torres Strait Islander population summary.
Country of birth
Most people in the ACT were born in Australia (BPLP). The proportion of people who were born overseas has increased over time. In 1971, 25.3% of people were born overseas. This increased to 26.4% in 2016, and 28.7% in 2021.
In 2021, the top five countries of birth in the ACT were:
- Australia (67.5%)
- India (3.8%)
- England (2.9%)
- China (2.7%)
- Nepal (1.3%)
Language
In 2021, most people in the ACT only used English at home (71.3%) (LANP). This was down from 72.7% in 2016.
After English the most common languages used were Mandarin (3.2%), Nepali (1.3%), Vietnamese (1.1%) and Punjabi (1.1%).
Religion
In 2021, the main religious affiliation (RELP) in the ACT was Christianity (38.1%). This proportion has decreased over time as people reporting non-Christian religions and no religious affiliation have increased. In 2016, Christian affiliation was 45.4%, and in 1971 it was 83.9%.
In 2021, 12.1% of people in the ACT were affiliated with a non-Christian religion. The most common were Hinduism (4.5%), Islam (3.2%) and Buddhism (2.8%).
The percentage of people who identified as having no religious affiliation was 44.2% in 2021. This was an increase from 36.8% in 2016, and 9.6% in 1971.
Household and families
Households are getting smaller in the ACT. In 2021, the average number of people who lived in each household in the ACT was 2.5, a decrease from 3.6 people in 1971.
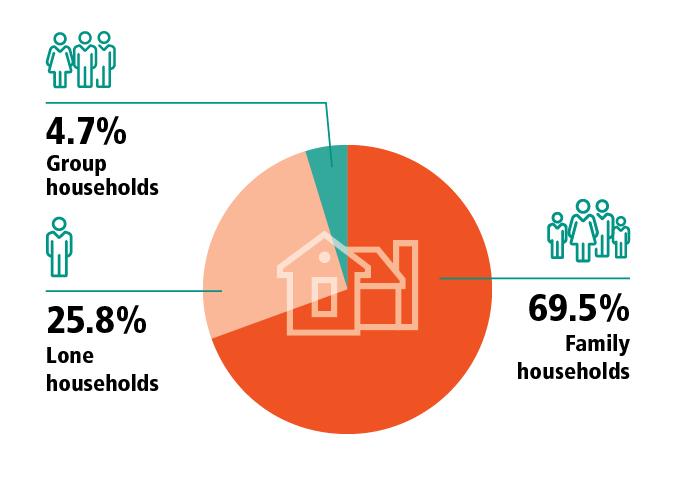
In 2021, 69.5% of households were family households. This was a decrease from 70.3% in 2016.
The most common type of family in the ACT was families with children. In 2021, 45.3% of families were couples with children and 13.9% were one parent families.
Households
Image
Description
The image shows a pie chart displaying the values of Group households, 4.7%, Lone households, 25.8%, and Family households, 69.5%.
Based on place of enumeration. Excludes visitor only and other non-classifiable households.
Source: Household composition (HHCD)
Housing
The 2021 Census counted almost 175,000 occupied private dwellings across the ACT. This was an increase from just under 151,000 in 2016. In 1971 there were almost 38,000 occupied private dwellings in the ACT.
In 2021, most people lived in separate houses (63.2%), rather than flats, apartments or other dwelling types. This was a decrease from 67.0% in 2016. Over this time the proportion of people who lived in flats or apartments increased from 15.0% to 19.4%.
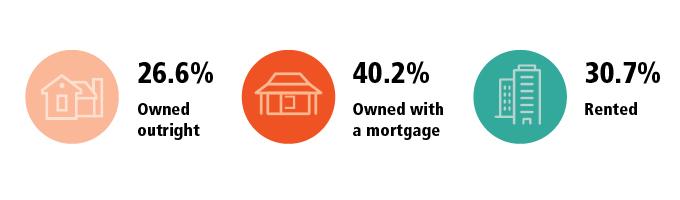
In 2021 66.8% of households in the ACT were homeowners (owned outright or with a mortgage). This was a slight increase from 65.5% in 2016.
Housing
Image
Description
The image displays the following values: Owned outright, 26.6%, Owned with a mortgage, 40.2%, and Rented, 30.7%.
Refers to occupied private dwellings and excludes visitor only and other non-classifiable households. Owned with a mortgage includes dwellings being purchased under a shared equity scheme. Rented excludes dwellings being occupied rent-free. Other tenure type and tenure type not stated represent remaining 2.5%.
Source: Tenure type (TEND)
For more detailed state specific data see the Snapshot of Australian Capital Territory data cube, available for download on the Snapshot of Australia page.