Introduction
Since its initial release in 2017, the ABS has considered the Labour Account to be the best source of industry information on employment and jobs. Following the addition of sector data in this release, the Labour Account should also be considered the best source of information on private and public sector jobs.
The Labour Account has been developed to provide a framework that brings together data from a number of sources, including household surveys, business surveys and administrative data. Through the balancing and confrontation processes of the Labour Account, the ABS is able to produce estimates of key labour market variables to enable analysis of the state of the Australian labour market and changes over time.
Starting with this release, the ABS has extended the Labour Account framework to also include information on the number of filled jobs for both the private and public sectors, for both the total economy and each industry division. Sector data are now available from the Labour Account from the September quarter 2010 onwards.
National analysis
There were 2.1 million public sector jobs in the September 2019 quarter, compared to 12.3 million private sector jobs.
Since the September quarter 2010, public sector jobs increased by 198,100 (or 10.4%) jobs, compared to 1.9 million (or 18.4%) jobs in the private sector.
The public sector’s share of all filled jobs decreased over the nine years, from approximately 15.5% in September quarter 2010, to 14.6% in the September 2019 quarter.
Table 1. Filled jobs by sector by quarter, seasonally adjusted
| Quarter | Public sector filled jobs ('000) | Proportion of total filled jobs (%) | Private sector filled jobs ('000) | Proportion of total filled jobs (%) | Total filled jobs ('000) |
|---|---|---|---|---|---|
| September quarter 2010 | 1,906.4 | 15.5 | 10,399.2 | 84.6 | 12,288.3 |
| December quarter 2010 | 1,902.8 | 15.4 | 10,502.0 | 84.7 | 12,394.7 |
| March quarter 2011 | 1,892.7 | 15.3 | 10,476.2 | 84.7 | 12,371.5 |
| June quarter 2011 | 1,857.4 | 15.0 | 10,540.0 | 84.9 | 12,415.4 |
| September quarter 2011 | 1,869.4 | 15.0 | 10,601.7 | 85.1 | 12,455.1 |
| December quarter 2011 | 1,831.5 | 14.7 | 10,615.7 | 85.3 | 12,442.1 |
| March quarter 2012 | 1,825.8 | 14.6 | 10,681.6 | 85.4 | 12,512.8 |
| June quarter 2012 | 1,857.3 | 14.8 | 10,678.0 | 85.1 | 12,544.0 |
| September quarter 2012 | 1,869.2 | 14.8 | 10,742.0 | 85.3 | 12,598.4 |
| December quarter 2012 | 1,877.1 | 14.8 | 10,765.6 | 85.1 | 12,643.4 |
| March quarter 2013 | 1,865.1 | 14.7 | 10,772.4 | 85.2 | 12,647.0 |
| June quarter 2013 | 1,901.3 | 14.9 | 10,815.3 | 85.0 | 12,718.2 |
| September quarter 2013 | 1,902.9 | 14.9 | 10,885.6 | 85.2 | 12,772.9 |
| December quarter 2013 | 1,902.2 | 15.0 | 10,780.2 | 85.0 | 12,688.1 |
| March quarter 2014 | 1,909.1 | 15.0 | 10,837.9 | 84.9 | 12,759.3 |
| June quarter 2014 | 1,906.2 | 15.0 | 10,840.5 | 85.1 | 12,741.8 |
| September quarter 2014 | 1,899.3 | 14.9 | 10,849.2 | 85.2 | 12,732.1 |
| December quarter 2014 | 1,931.4 | 15.0 | 10,945.7 | 84.9 | 12,886.2 |
| March quarter 2015 | 1,930.9 | 14.9 | 11,033.7 | 85.0 | 12,980.6 |
| June quarter 2015 | 1,938.1 | 14.9 | 11,106.7 | 85.2 | 13,036.6 |
| September quarter 2015 | 1,943.0 | 14.9 | 11,129.0 | 85.3 | 13,052.5 |
| December quarter 2015 | 1,965.9 | 14.8 | 11,309.7 | 85.1 | 13,289.7 |
| March quarter 2016 | 1,977.4 | 14.9 | 11,253.2 | 85.0 | 13,246.8 |
| June quarter 2016 | 1,996.7 | 15.0 | 11,286.9 | 85.0 | 13,271.5 |
| September quarter 2016 | 2,012.7 | 15.2 | 11,269.7 | 85.0 | 13,263.3 |
| December quarter 2016 | 2,011.1 | 15.0 | 11,360.6 | 84.9 | 13,385.6 |
| March quarter 2017 | 2,039.3 | 15.2 | 11,371.7 | 84.7 | 13,429.9 |
| June quarter 2017 | 2,033.7 | 15.0 | 11,552.0 | 85.1 | 13,571.2 |
| September quarter 2017 | 2,049.3 | 14.9 | 11,689.3 | 85.2 | 13,717.5 |
| December quarter 2017 | 2,067.5 | 14.9 | 11,769.5 | 85.0 | 13,854.3 |
| March quarter 2018 | 2,084.5 | 15.0 | 11,782.8 | 84.8 | 13,887.8 |
June quarter | 2,080.1 | 14.9 | 11,931.4 | 85.3 | 13,995.3 |
| September quarter 2018 | 2,091.4 | 14.9 | 11,982.5 | 85.3 | 14,051.7 |
| December quarter 2018 | 2,095.1 | 14.7 | 12,152.1 | 85.2 | 14,267.9 |
| March quarter 2019 | 2,086.9 | 14.6 | 12,155.6 | 85.2 | 14,261.6 |
June quarter | 2,098.9 | 14.7 | 12,228.0 | 85.5 | 14,308.9 |
| September quarter 2019 | 2,104.4 | 14.6 | 12,315.4 | 85.6 | 14,395.1 |
Industry analysis
From the June quarter 2019 to September 2019 there was an increase of 5,500 jobs in the public sector. This increase in jobs was driven by increases in the Health care and social assistance and Education and training industries.
From the September 2010 quarter to September 2019 there was an increase of 198,100 public sector jobs. This increase over the longer period was driven by increases in jobs in the Health care and social assistance (113,200), Public administration and safety (58,100) and Education and training (57,400) industries. During this same period, notable decreases in public sector jobs were seen in Transport, postal and warehousing (14,200) and Electricity, gas, water and waste services (13,400).
In the September quarter 2019, the three industries with the highest share of public sector jobs were Public administration and safety (32.8%), Education and training (30.8%) and Health care and social assistance (25.3%).
From the June quarter 2019 to September 2019 there was an increase of 87,400 jobs in the private sector. This increase in jobs was driven by increases in jobs in Health care and social assistance and Transport, postal and warehousing.
From the September quarter 2010 to September 2019 there was an increase of 1.9 million private sector jobs. This increase over the longer period was driven by increased jobs in the Health care and social assistance (499,500), Professional, scientific and technical services (297,500) and Accommodation and food services (207,400) industries. During this same period notable decreases in private sector jobs were seen in Manufacturing (60,600) and Agriculture, forestry and fishing (37,400).
In the September quarter 2019, the three industries with the highest proportion of private sector jobs were Retail trade (11.3%), Health care and social assistance (11.1%), and Professional, scientific and technical services (9.9%).
Gender and age analysis
The annual Jobs in Australia data provides further insights into the people working in the public and private sector. The gender and age structure for public and private sector job holders was noticeably different in 2016-17, peaking earlier in the private sector (at around 25-29 years) than the public sector (at around 45-49 years). Males were more likely to work in private sector jobs than females, while the opposite was true for public sector jobs.
Source: Jobs in Australia (6160.0)
Location analysis
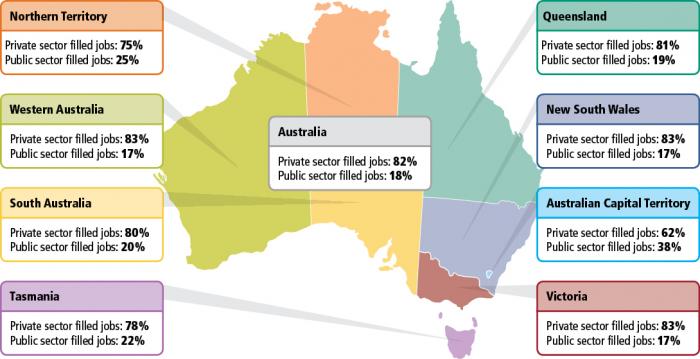
The annual Jobs in Australia data provides further insights into the differences in public and private sector jobs across Australia. In 2016-17, the State or Territories with the highest proportion of public sector jobs were the Australian Capital Territory (38%), the Northern Territory (25%) and Tasmania (22%). The states with the lowest proportion of public sector jobs were New South Wales (17%), Victoria (17%) and Western Australia (17%).
Figure 8 - Proportion of jobs by state or territory, by sector, 2016-17
Image
Description
Source: Jobs in Australia (cat: 6160.0)
Methodology
The public and private sector estimates in the Labour Account have been compiled by applying proportions from business sources to balanced numbers of filled jobs for each industry. Private sector proportions have been derived using private sector aggregates in the Quarterly Business Indicators Survey, benchmarked to data from the annual Economic Activity Survey. Public sector proportions have been derived using public sector benchmarks from the annual Survey of Employment and Earnings, distributed across quarters using movements in public sector Compensation of Employees.
Comparison with other data
The ABS considers the Labour Account to be the best source of headline information on employment by industry. It has been specifically designed to produce the most comprehensive estimates for industries in Australia, drawing upon a broad range of data sources. It provides an estimate of the number of jobs, hours worked, and associated labour income that align very well with industry measures of output in the economy. In the future, it is expected to lead to improvements in the measurement of productivity.
The Labour Account is also the best source of quarterly private and public sector jobs information. While the annual public sector Survey of Employment and Earnings provides a robust level estimate of public sector employment, the additional scope and confrontation processes of the Labour Account provide the best indicator of the relative proportions and changes over time across both private and public sectors.