Development of a Composite Indicator for Business Digital Intensity in Australia (Digital Intensity Index)

Experimental estimates from the 2021-22 Business Characteristics Survey - Digital Activity module.

Released
28/07/2023

Introduction

One of the key elements of the digital economy that policy makers look to understand is the digital intensity of Australian businesses. The Business Characteristics Survey (BCS) collects and disseminates numerous indicators that describe the adoption and integration of digital technologies and practices by businesses.

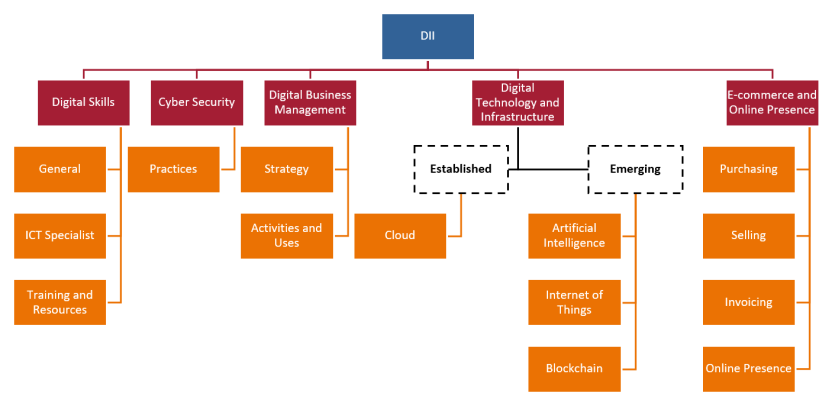
This article presents information on how the ABS has developed an experimental Digital Intensity Index (DII) composite indicator which brings together several metrics into a single measure of business digital intensity.

Background

There have been numerous attempts by statistical agencies to construct digital intensity composite indicators such as the European Union’s Digital Economy and Society Index (DESI), the German Digital Economy Indicator, and the Canadian Digital Intensity Indicator. Each of these metrics are composite indicators; they aggregate the individual concepts that make up, for example, business digital intensity into one or more summarising statistics.

Prior to the production of the DII, an economy-wide composite indicator on digital intensity was not available for Australia. In Australia, there is demand from policy makers and businesses for such statistics to explore issues like the digitalisation of small businesses and productivity. The ABS’ DII has been constructed based on:

Please note, the DII cannot be benchmarked against the aforementioned composite indicators due to differences in content, scope, coverage and approach.

Producing a composite measure of business digital intensity

Framework

The DII framework was constructed in consultation with subject matter experts across government. The ABS aimed to devise a simple model that is intuitive, transparent and one which will preserve coherence and interpretability over time. As such, the DII has broadly been divided into five branches based on topics from the BCS. These branches are:

  • Digital Skills. This branch consists of variables about digital skills used by businesses (separating those of ICT specialists from those of general staff) and the training and resources provided to employees.
  • Cyber Security. This branch includes variables related to the adoption of preventative cyber security practices, notably excluding variables related to reportable cyber security incidents and impacts.
  • Digital Business Management. This branch includes variables about practices for the use of digital resources. It covers the application and reason a digital resource is being used (i.e., where and why) rather than the details of the application (i.e., how).
  • Digital Technology and Infrastructure. This branch considers the adoption of digital technologies and infrastructure, notably excluding factors outside of the business’ control such as internet type, speed and quality.
  • E-commerce and Online Presence. This branch includes purchasing, selling, invoicing, and online presence variables.
High-level structure of the DII

The DII consists of five main branches: Digital Skills, Cyber Security, Digital Business Management, Digital Technology and Infrastructure, and E-commerce and Online Presence.

Where applicable, these topics have been further divided into sub-topics to better aggregate variables. Digital Skills are further divided into General (staff), ICT Specialist, and Training and Resources; Cyber Security into Practices (for conceptual accuracy); Digital Business Management into Strategy, and Activities and Uses; Digital Technology and Infrastructure into Cloud (an established technology) and Artificial Intelligence, Internet of Things, and Blockchain (emerging technologies); and E-commerce and Online Presence into Purchasing, Selling, Invoicing, and Online Presence.

Please note, the Established and Emerging headers do not inform weights but are included for conceptual relevance.

Please also note, the digital technologies and infrastructure considered are not limited to those listed. These have been highlighted as they are of significant interest.

The relevant individual variables were then selected and appropriately placed under the structure. These were aggregated using a weighted sum, that is, individual variables were multiplied by a factor (informing the relative contribution to the DII) before taking the sum.

To determine the weights, the DII took a subjective rather than data-driven approach; i.e., weights have been applied to reflect conceptual expectations. This has the advantage of being more intuitive and supporting the comparability of successive releases. The subjectivity of the DII is largely manifested in the structure; minimal impositions have been made to the weights themselves.

The subjective approach has been implemented by applying weights in stages rather than applying weights directly to the variables.

  • Relative weights are given to variables of a question relative to the number of variables considered. Generally, relative weights have allocated an equal proportion to each variable. Exceptions were variables considered to be alternatives. These were merged before the weights were applied to ensure concepts were not being exaggerated. The high-level structure is presented above.
  • These weighted variables are aggregated to form the question score, bound between 0 and 1.
  • This is repeated for questions within a branch, then branches within a larger branch, up to calculating a single DII at the business record level.
  • Each business’ DII score is then used to produce an aggregate composite estimate.

The DII (for 2021-22) has been bound between 0 and an upper bound of 1 (as have branch components before applying the relevant weight). A business achieving a DII at the upper bound can be considered to have taken advantage of all available digital opportunities (which have been recognised/collected on the BCS). In future collection cycles, the upper bound will increase to acknowledge, for example, the emergence of new technologies, providing an adjustment factor for more meaningful time series analysis.

This publication categorises businesses into five DII levels:

  • Non-Digital: Businesses which have no digital intensity
  • Baseline: Businesses achieving a DII greater than 0 and less than or equal to 0.25
  • Developing: Businesses achieving a DII greater than 0.25 and less than or equal to 0.5
  • Established: Businesses achieving a DII greater than 0.5 and less than or equal to 0.75
  • Advanced: Businesses achieving a DII greater than 0.75 and less than or equal to 1

Guiding principles

Several guiding principles were employed to best extract the concept of business digital intensity without tainting its definition.

  • Relative measures (such as increases) have been excluded from the model given the contexts of such measures are unknown. For example, an increase in employed ICT specialists could reflect an expansion of digital capabilities or a response to lost employees.
  • Businesses have not been penalised for negative events, such as cyber security incidents, as these are external factors and may be outside of the control of the business.
  • Other responses (i.e., free-text responses from businesses on the survey) are excluded as these would misrepresent the digital frontier (see Future considerations). A notable consequence is emerging technologies will be limited to those listed on the BCS. Emerging technologies not currently collected on the BCS will be recognised in future releases.
  • The DII aims to only cover inputs and decision-related processes. Outputs, such as the percentage of business income from e-commerce sales, are excluded as these are dependent on digital intensity and would be influenced by other factors.
  • All technologies and practices outside of the business’ control are excluded. A notable exclusion is internet-related variables.

Statistical techniques were employed to inform the development of the DII and test its robustness. Techniques included Principal Component Analysis (PCA) and factor analysis, cluster analysis, and sensitivity analysis. These techniques identified characteristics of the data which also informed and justified subjective decisions.

Analysis of Digital Intensity Index, by Australia and employment size and industry

At the Australia level, the majority of businesses recorded a Baseline, Developing or Established DII. Only 3% of businesses recorded a Non-Digital DII and 1% recorded an Advanced DII.

  1. Proportions are of all businesses in each output category.
  2. Some proportions are subject to high relative standard error (RSE) and should be used with caution. Please refer to the data cube spreadsheet in the data downloads section for RSE details.

While the model has been constructed to categorise businesses into 5 levels, the Non-Digital and Advanced levels are only available for Australia (i.e., Total). Outputs for these levels by employment size and by industry are not available due to confidentiality. As such, the data presented below by employment size and by industry are presented for the following three levels:

  • Baseline,
  • Developing, and
  • Established.

By employment size, the level of digital intensity increased with each successive employment size range. Businesses with 200 or more persons employed recorded 53% for Established while those with 0-4 persons employed recorded 5%. The relationship between employment size and the DII may reflect the availability of resources that larger businesses have compared to smaller businesses to adopt digital technologies and practices.

  1. Proportions are of all businesses in each output category. 
  2. Some proportions are subject to high relative standard error (RSE) and should be used with caution. Please refer to the data cube spreadsheet in the data downloads section for RSE details. 

The highest proportions of businesses with an Established DII level were recorded in the Information media and telecommunications industry (22%) followed by Wholesale trade (19%).

Within the Information media and telecommunications industry, the publishing and internet-providing businesses were most likely to be more digitally intense.

For Mining, coal mining and metal ore businesses were most likely to be more digitally intense compared to quarrying businesses.

Please refer to the data downloads section for the full set of estimates by ANZSIC industry division.

  1. Proportions are of all businesses in each output category.
  2. Some proportions are subject to high relative standard error (RSE) and should be used with caution. Please refer to the data cube spreadsheet in the data downloads section for RSE details.

Future considerations

The ABS will consider the provision of DII-derivative products to meet anticipated demand. Considerations include:

  • Business Longitudinal Analysis Data Environment (BLADE) Integration. The DII will provide another input for productivity, efficiency, and business growth analysis.
  • The Digital Frontier. Effectively the maximum score a business can achieve, this statistic will provide a basis for more meaningful and comparable timeseries analysis. The digital frontier will increase beyond the current upper bound of 1 to reflect new digital developments and consequent opportunities; acting as an adjustment factor for successive releases.

For further information regarding the product, its use and prospects, please contact us.

Data Downloads

Digital Intensity Index Estimates

Back to top of the page