The ABS will be closed from 12.00pm, 24 December 2024 and will reopen at 9.00am, 2 January 2025. During this time there will be no statistical releases and our support functions will be unavailable. The ABS wishes you a safe and happy Christmas.

Introducing a monthly Consumer Price Index (CPI) indicator for Australia

This information paper introduces the monthly CPI indicator for Australia and outlines the research and methodology

Released
16/08/2022

Summary

Update 29 September 2022

The ABS has updated this information paper to now include a mock-up of the publication including Time Series tables with the metadata of the new series. These can be found in the Mock-up of the monthly Consumer Price Index (CPI) indicator publication section at the bottom of this release.

  • On 26 October 2022, the ABS will commence publication of a monthly CPI indicator. This first publication will occur alongside the release of the quarterly CPI. Thereafter, the monthly CPI indicator will be published around four weeks after the end of the reference month, starting with the October month release on 30 November. The exception to this will be the November data, which will be published in January.
  • The monthly CPI indicator will provide a timelier indication of inflation using the same data collected for use in the quarterly CPI. Each month will include updated prices for between 62 and 73 per cent of the weight of the quarterly CPI basket.
  • The quarterly CPI will continue to be Australia’s key measure of inflation
  • There will be no changes to the quarterly CPI outputs and release schedule.
  • Consistent with existing policy, the ABS does not comment on the use (or otherwise) of the price indexes we publish. However, it should be noted that the monthly CPI indicator may be routinely subject to revision, in contrast to the quarterly CPI which is only revised in exceptional circumstances.
  • This paper includes monthly CPI indicator data from 2018 up to June 2022.
 
Feedback

The ABS welcomes any feedback and comments by 13 September 2022, which can be directed to prices.statistics@abs.gov.au

 
Acknowledgment

The ABS would like to acknowledge and give thanks to the following stakeholders who assisted in peer reviewing this Information Paper:

  • Reserve Bank of Australia;
  • Treasury;
  • Department of Social Services; and
  • Dr Jan de Haan, international CPI expert from Statistics Netherlands

Introduction

The quarterly Consumer Price Index (CPI) provides a general measure of prices for goods and services purchased by Australian households. Changes in the CPI provide a measure of household inflation. A key purpose of the quarterly CPI is to inform monetary policy, with the Reserve Bank of Australia (RBA) having an explicit inflation target to "keep annual consumer price inflation between 2 and 3 per cent, on average, over time." (RBA: Australia's Inflation Target).

The quarterly CPI is also used to adjust a range of Government pensions and allowances. The quarterly CPI is used by government, academics and economists for macroeconomic analysis, as well as by businesses and the general community to inform the setting of wages and the prices of goods and services.

Most advanced countries publish a monthly CPI in line with the International Monetary Fund's (IMF) Special Data Dissemination Standards (SDDS). The SDDS sets guidelines for the compilation of statistics for those countries that wish to access international capital markets. Australia is one of only two OECD economies (the other is New Zealand), and the only G20 country, that does not produce a monthly CPI. 

Until recently, the costs of producing an Australian monthly CPI have been prohibitive. Enhancements to the quarterly CPI, through the use of new data sources, have reduced data collection costs and made it possible to produce a more frequent measure of household inflation. In particular, the use of scanner data and web-scraping (automated) data collection techniques provide high frequency data at a lower cost.

The recent acquisition of a new monthly data series for rental price information means the ABS now has monthly price data for 43 per cent of the weight of the CPI basket.

When combined with quarterly and annual price collections, the new monthly CPI indicator represents up-to-date prices for between 62 and 73 per cent of the weight of the CPI basket, depending on the month in the quarterly cycle. Research by the ABS, presented in this paper, shows this information provides a timely indicator of household inflation in Australia.

Quarterly CPI

In 2022, annual CPI inflation reached its highest level in 20 years. This has increased the focus on inflation for policy decision making and the cost-of-living experience of Australian households. Inflation is also high in many countries around the world.

The quarterly CPI is Australia’s key measure of inflation because:

  • It enables consistent comparisons to be made over time back to when the index started in 1948;
  • Prices are updated at least once during the quarter for everything in the CPI basket where a price change could have occurred, noting that prices for some items such as education fees change only once per year;
  • It is revised only in exceptional circumstances, such as to correct a significant error or, in the case of all price indexes, when the reference base is changed periodically; and
  • It is more comprehensive than the monthly CPI indicator as it publishes data for all 87 expenditure classes and each of the eight capital cities.

Development of a monthly CPI indicator

The ABS has explored whether existing data sources used in the quarterly CPI can also be used to produce a monthly CPI indicator of inflation.

The ABS collects a large volume of data on the prices faced by consumers. The ABS collects these prices at a range of frequencies including weekly, monthly, quarterly and annually.

The frequency of price collection is determined by how often prices typically change and the availability of data. Where price change occurs frequently, such as for food and petrol, weekly and monthly price data is collected for use in the quarterly CPI. Where price change is typically less frequent, such as for restaurant meals and hairdressing services, price data is collected quarterly. In practice, this means that prices collected once a quarter are assumed to reflect the prices for the entire quarter. For series with annual price changes, prices are collected once a year, as in the case of education fees and property rates. 

The ABS is producing this monthly CPI indicator recognising there is value in providing more timely consumer price insights, particularly given the current high rate of inflation. While it will be fit for its purpose as a monthly indicator, we note the data collections underpinning it were not designed with monthly reporting of inflation in mind. As a result, the monthly CPI indicator has some deficiencies relative to the quarterly CPI. In particular, the frequency of price collection and the methods used to compile the two indexes will lead to differences between the monthly CPI indicator and the quarterly CPI.

The following table shows the frequency with which data is collected by the proportion of the quarterly CPI basket that these represent. Conceptually, the monthly CPI indicator will include all the items of the quarterly CPI basket, however, not all items in the basket will be updated with new prices each month.

Where prices are not collected in a particular month, prices collected in previous months will be ‘carried forward’ (see appendix 2 for further explanation). Where prices are updated in month 2 or 3 of any given quarter, the new prices data will not be used to revise previous months in the quarter. For this reason, the average of the index in the three months for the monthly CPI indicator will not equal the index of the quarterly CPI.

Including the data collected once per year:

  • January, April, July and October months will include up-to-date price information for 62 per cent of the weight of the quarterly CPI.
  • February, May, August and November months will include up-to-date price information for 73 per cent of the weight of the quarterly CPI.
  • March, June, September and December months will include up-to-date price information for 71 per cent of the weight of the quarterly CPI.
 Timing of data collection by weight in CPI basket¹
CPI for month ofData updated monthly² (%)Data updated once per quarter (%)Data updated annually (%)Prices not updated (carried forward)³ (%)Total (%)
January, April, July and October4391038100
February, May, August and November43201027100
March, June, September and December43181029100

¹ For more details refer to Appendix 1

² Includes rents data which is currently collected quarterly.  A monthly rents series is under development, it is intended to be included from the September quarter 2022 onwards.

³ For more details refer to Appendix 2

Research findings

The data presented in this paper are preliminary and may be subject to change.

Using data back to December 2017, the ABS has compiled a monthly CPI indicator series. The series presented in this paper measures the Rents series in month 2. Starting from September 2022, the Rents series will be measured on a monthly basis in both the monthly CPI indicator and the quarterly CPI.

Figure 2 compares the annual changes in the monthly CPI indicator and quarterly CPI series. The two series align closely, which supports the view the monthly CPI indicator is a useful and more timely indicator of household inflation. Outcomes in the March quarter 2022 demonstrate the value of the monthly CPI indicator with the annual change increasing in both January and February. This provided an earlier indication of the increase in CPI inflation ahead of the release of the March quarter 2022 CPI.

Figure 2: Annual change in monthly CPI indicator¹ and quarterly CPI series² (%)

Figure 2: Annual changes in monthly CPI indicator and quarterly CPI series
The chart in figure 2 compares the annual percentage changes in the monthly CPI indicator and quarterly CPI series. Data for this chart is located below under the 'Figure 2 data' heading

¹ Monthly CPI indicator annual movement is the change over a period of 12 months e.g. May 2021 to May 2022.

² The quarterly CPI outcomes are plotted in the last month of each quarter. For example, the quarterly CPI outcome for the March quarter 2022 is plotted in March 2022.

Figure 2 data

Figure 3 compares the 3-month movement of the monthly CPI indicator with the quarterly CPI movement and again shows it provides a timely indication of CPI inflation. This is particularly evident at the beginning of the COVID-19 pandemic in 2020 when CPI inflation fell suddenly in April. Then in July and August 2020, CPI inflation increased to a higher rate than the pre-COVID 2019 rate.

Figure 3: Three-month movement¹ and quarterly CPI movement comparison² (%)

Figure 3: Three-month movement and quarterly CPI movement comparison (%)
The chart in figure 3 compares the 3-month movement of the monthly CPI indicator with the quarterly CPI movement and shows it provides a timely indication of CPI inflation. Data for this chart is located below under the 'Figure 3 data' heading

¹ Monthly CPI indicator three-month movement is the change over a period of 3 months e.g. February 2022 to May 2022.
² The quarterly CPI outcomes are plotted in the last month of each quarter. For example, the quarterly CPI outcome for the March quarter 2022 is plotted in March 2022.

Figure 3 data

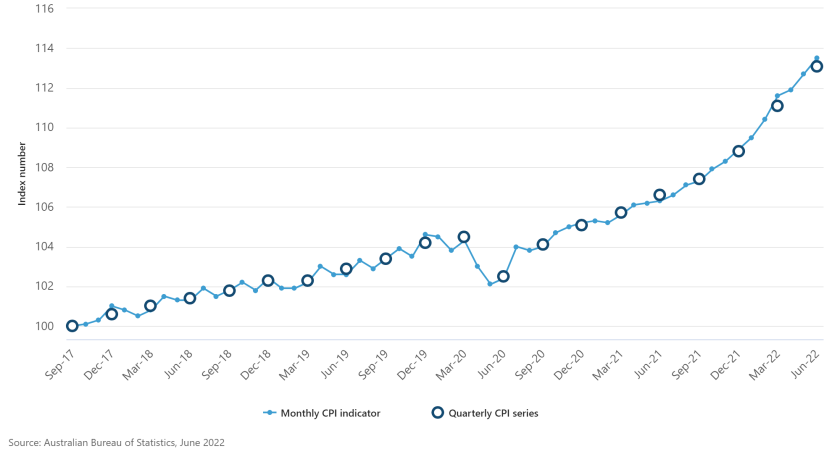
Figure 4 compares the index of the monthly CPI indicator and quarterly CPI series and shows the two series align closely over time.

The monthly CPI indicator shows a saw-tooth pattern throughout 2018 and 2019. The main cause of this pattern is the seasonal nature of domestic and international holiday travel prices. Airfare and accommodation prices are highly influenced by Christmas, Easter and school holidays. The effect of school holidays, which usually occur in month 1 of each quarter, sees an increase in prices in month 1 followed by a decrease in prices in month 2 once school has returned. This effect is not evident in the quarterly CPI series due to prices being averaged over the three months of the quarter. This seasonal pattern in the monthly CPI indicator series is consistent throughout 2018 and 2019 and then changes following the onset of COVID-19 and its impact on holiday travel.

Figure 4: Monthly CPI indicator and quarterly CPI index number¹ comparison (Sep 2017 = 100.0)

Figure 4: Monthly CPI indicator and quarterly CPI index number¹ comparison (Sep 2017 = 100.0)
The chart in figure 4 shows a comparison of the index number of the monthly CPI indicator and quarterly CPI series and shows the two series align closely over time. Data for this chart is located below under the 'Figure 4 data' heading

¹ The quarterly CPI outcomes are plotted in the last month of each quarter. For example, the quarterly CPI outcome for the March quarter 2022 is plotted in March 2022.

Figure 4 data

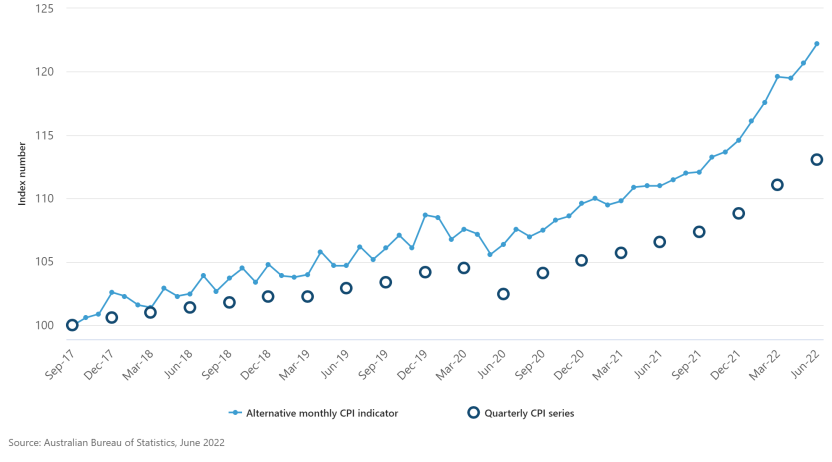
While it is possible to derive month-on-month changes from the monthly CPI indicator series, these movements can be volatile due to a combination of seasonal effects and differences in the coverage of prices used to compile each monthly estimate (see figure 5). The monthly CPI indicator movements are particularly impacted by seasonal factors such as the effect of school holidays on prices for holiday travel. Differences in the range of goods and services priced each month (see appendix 1) also introduce a ‘seasonal pattern’ for month-on-month comparisons.

For these reasons, the ABS recommends using either comparisons of the current month to the same month in the previous year (figure 2) or 3 months prior (figure 3) to understand trends in the monthly CPI indicator. These comparisons remove differences in coverage between the two periods being compared and, in the case of annual movements, reduce the impact of other seasonal factors, making trends in the monthly CPI indicator easier to identify.

The ABS is working to develop a seasonally adjusted measure of the monthly CPI indicator. This will account for both the calendar related seasonal events, such as school holidays, and the seasonal effect introduced through the use of carry forward imputation for those goods and services where prices are collected once per quarter.

¹ Monthly CPI indicator month on month movement is the change over a period of 1 month e.g. April 2022 to May 2022.

Relationship between the new monthly CPI indicator and the existing quarterly CPI

Figures 2 and 3 above compare the movements of the monthly CPI indicator with the quarterly CPI. These figures show the monthly CPI indicator performs well as an indicator of inflation as measured by the quarterly CPI. Figures 2 and 3 also show that while the movements of the monthly CPI indicator and quarterly CPI align closely in most cases, they are usually not identical. This is to be expected as a result of differences in the way the two series are calculated.

Figure 6 shows the relationship between annual movements of the monthly CPI indicator and the quarterly CPI. The difference in the time periods being compared leads to a small numerical difference between the two series.

Figure 6: Annual movements - monthly CPI indicator and quarterly CPI

Figure 6: Annual movements - monthly CPI indicator and quarterly CPI
Figure 6 is an illustration to show the relationship between annual movements of the monthly CPI indicator and the quarterly CPI: Monthly CPI - Annual monthly CPI movement = (change between index month and the same month of the previous year) Quarterly CPI - Annual movement of the Quarterly CPI = (change between index quarter and the same quarter from the previous year)

In mathematical terms, where monthly price data are available, the quarterly CPI series is derived as the average of the three months. This equates to the following:

\(Index_{quarter} = (Index_{month1} + Index_{month2} + Index_{month3})/3\)

Movements for the quarterly CPI series are calculated by comparing \(Index_{quarter}\) to the corresponding \(Index_{quarter}\) from either 12-months previously (for an annual price change) or 3-months earlier for a quarterly change.

\(Quarterly\space CPI_{movement} = ((Index_{current\space quarter}\space – Index_{reference\space quarter})/Index_{reference\space quarter})*100\)

For the monthly CPI indicator the price movement is calculated by simply comparing the current month with the equivalent month for the time period of interest.

\(Monthly\space CPI indicator_{movement} = ((Index_{current\space month} - Index_{reference\space month})/ Index_{reference\space month}) *100\)

The price of a 250g chocolate bar is $2 between January and May. The price of the same chocolate bar increases to $2.10 in June and remains at $2.10 through to September.

Figure 7 shows the monthly CPI indicator and quarterly CPI derived from these prices from a base period = 100.0.

As can be seen, the monthly CPI indicator would increase from 100.0 to 105.0 in June reflecting the 5 per cent increase in price that occurred in June. However, the June quarter CPI only increases to 101.7 because it is the average of the three months in the quarter ((100.0 + 100.0 + 105.0)/3). Therefore, the June quarter CPI would have risen 1.7 per cent relative to the March quarter. If the price remained at $2.10 until September, the quarterly CPI and monthly CPI indicator would both be 105.0 in September. The quarterly CPI would rise 3.3 per cent between the June and September quarters, while the monthly CPI Indicator would not record any change over the three months to September.

This example demonstrates that due to timing differences, the price change captured in the monthly CPI indicator and the quarterly CPI will be closely aligned, but not equal.

Figure 7. Index comparison of monthly CPI indicator and quarterly CPI for hypothetical prices

Figure 7. Index comparison of monthly CPI indicator and quarterly CPI for hypothetical prices
This chart uses a hypothetical example to easily demonstrate that due to timing differences, the price change captured in the monthly CPI indicator and the quarterly CPI will be closely aligned, but not equal.

The example in figure 7 applies to series measured with price data collected each month. The All groups CPI combines data with different frequencies of collection (see appendix 1). As noted in the section above on ‘Development of a monthly CPI indicator’ this means the index of the quarterly CPI will not equal the three-month average of the indexes of the monthly CPI indicator.

Implementation

Monthly CPI indicator outputs

For the new monthly CPI indicator, the ABS will publish a subset of the CPI quarterly outputs on a monthly basis. All data will be at the national level, derived as a weighted average of the eight capital cities. As shown in the following table the monthly publication will include:

  • All groups
  • Each of the eleven CPI groups
  • Selected expenditure classes including: Automotive fuel, New dwelling purchase by owner-occupiers, Rents, Domestic holiday travel, International holiday travel and some Food categories. These expenditure classes represent the majority of goods and services where monthly price data are available.
Weighted average of eight capital cities – Annual movement (%)
 Apr 2021 to Apr 2022May 2021 to May 2022Jun 2021 to Jun 2022
All groups CPI5.56.26.8
Food and non-alcoholic beverages4.75.36.4
    Meat & seafood5.76.26.5
    Fruit & vegetables6.64.59.1
Alcohol and tobacco2.31.82.3
    Alcohol1.51.01.4
    Tobacco3.62.93.7
Clothing and footwear0.42.61.8
Housing8.99.19.3
    Rents1.01.61.6
    New dwelling purchased by owner-occupiers19.619.521.0
Furnishings, household equipment and services5.96.46.2
Health2.22.22.5
Transport9.213.816.4
    Automotive fuel19.533.743.3
Communication-0.7-0.1-0.1
Recreation and culture4.44.34.9
    Holiday travel and accommodation8.26.78.6
Education4.64.64.6
Insurance and financial services2.72.53.3
CPI analytical series¹   
    Trimmed meannanana
    Weighted mediannanana

¹ The ABS is investigating a seasonally adjusted monthly CPI indicator series in order to produce monthly measures of the Trimmed mean and Weighted median series.

More detailed data for capital cities and expenditure classes will continue to be available in the quarterly publication.

Release schedule

The quarterly CPI will continue to be released four weeks after the end of the reference quarter. This is typically the final Wednesday in the month following the end of the reference quarter. The monthly CPI indicator will follow a similar schedule of around four weeks after the end of the reference month. The exception to this will be the publication of the November data which will occur in January rather than December.

Revision policy for monthly CPI indicator

While the quarterly CPI is not revised, the monthly CPI indicator may be revised while we continue to develop the series. Some examples of where revisions may occur include:

  • More complete data becoming available closer to the release of the quarterly CPI. This will result in revisions to the previous 1-2 months of the monthly CPI indicator.
  • Converting a series from being measured once per quarter to being measured on a monthly basis. Revisions to the previous 12 months will be implemented to preserve the annual movement in the current and subsequent months.

Where a revision to the monthly series does occur, the ABS will communicate the reason for the revision.

The attached link outlines a range of issues that users should consider in relation to using price indexes in contracts  - Inflation and Price Indexes - Use of Price Indexes in Contracts (abs.gov.au).

Future work

The focus of the ABS has been on making the monthly CPI indicator available in a manner that is fit for purpose and useful for decision making.

Over time, the ABS intends to expand the coverage of what is measured on a monthly basis. Further use will be made of administrative data and web-scraped data, where possible, to keep data collection costs low. These changes will be implemented in both the quarterly CPI and monthly CPI indicator.

Once the monthly CPI indicator is available, the ABS will engage with stakeholders on future developments and enhancements for improving it. However, there are constraints in our current systems that will limit the capacity to expand coverage of what is measured on a monthly basis and the amount of detailed information the ABS can publish each month.

As previously mentioned, the ABS is finalising a monthly Rents data series, which will be included in the monthly CPI indicator and quarterly CPI publications on 26 October 2022.

Appendix

Appendix 1: Monthly CPI goods and services coverage

Appendix 2: Imputation approach used in months where price data are not collected

What's in the monthly CPI visual

What's in the monthly CPI indicator?

What's in the monthly CPI infographic
This infographic explains the frequency with which data is collected by the proportion of the quarterly CPI basket that these represent. Conceptually, the monthly CPI indicator will include all the items of the quarterly CPI basket, however, not all items in the basket will be updated with new prices each month. Where prices are not collected in a particular month, prices collected in previous months will be ‘carried forward’ (see appendix 2 for further explanation). Where prices are updated in month 2 or 3 of any given quarter, the new prices data will not be used to revise previous months in the quarter. For this reason, the average of the index in the three months for the monthly CPI indicator will not equal the index of the quarterly CPI. Including the data collected once per year: • Month 1 (January, April, July and October months) will include up-to-date price information for 62 per cent of the weight of the quarterly CPI. • Month 2 (February, May, August and November months) will include up-to-date price information for 73 per cent of the weight of the quarterly CPI. • Month 3 (March, June, September and December months) will include up-to-date price information for 71 per cent of the weight of the quarterly CPI. All eleven groups are included in each month, with the following breakdown: Month 1: 43% monthly data, 9% quarterly data, 10% annual data, 38% data not updated (carried forward) Month 2: 43% monthly data, 20% quarterly data, 10% annual data, 27% data not updated (carried forward) Month 3: 43% monthly data, 18% quarterly data, 10% annual data, 29% data not updated (carried forward) The eleven groups of the CPI basket are: Housing Food and non-alcoholic beverages Transport Alcohol and tobacco Furnishings, household equipment and services Recreation and culture Health Insurance and financial services Education Clothing and footwear Communication

Frequently Asked Questions (FAQs)

Monthly CPI indicator FAQs

Media Releases

Supporting media release Introducing a monthly CPI indicator published 16/08/2022.

Mock-up of the monthly Consumer Price Index (CPI) indicator publication

The following section includes details of the monthly CPI indicator publication layout, including Named Time Series (NTS) tables and series ids.  The monthly CPI indicator publication will be published from 26 October 2022.

Key statistics

Section will include a list of key Monthly CPI indicators.

Main features

Section will include the following

Weighted average of eight capital cities - Annual
 Month 2021 to Month 2022Month 2021 to Month 2022Month 2021 to Month 2022

All groups CPI


Food and non-alcoholic beverages


    Meat & seafood


    Fruit & vegetables


Alcohol and tobacco


    Alcohol


    Tobacco


Clothing and footwear


Housing


    New dwelling purchase


    Rents


Furnishings, household equipment and services


Health


Transport


    Automotive fuel


Communication


Recreation and culture


Education


Insurance and financial services


CPI analytical series


Trimmed mean


Weighted median


Overview

This section will include an overview of the main contributors to the annual percentage change for the current month.

Mock-up TABLE 1. Monthly CPI Indicator: All groups, Groups and select Expenditure classes

Analytical series Australia, Index Numbers and Percentage Change from Corresponding Month of Previous Year, Weighted Average of Eight Capital Cities

Mock-up TABLE 2. Monthly CPI Indicator: Select Groups, select Expenditure classes and Analytical series

Analytical series, Australia, Percentage Change from previous period, Weighted Average of Eight Capital Cities

Back to top of the page