In 2022:
- 4,042,512 students were enrolled in schools across Australia, an increase of 11,795 students (0.3%) compared with 2021.
- the majority of students were enrolled in government schools (64.5%), followed by Catholic schools (19.7%) and independent schools (15.9%).
Over the five years to 2022, total student enrolments increased by 3.8%. Independent schools recorded the largest increase (12.5%), followed by Catholic schools (3.9%) and government schools (1.9%).
| 2022 | 2021 | 2020 | 2019 | 2018 | 2018-22 (% change) | |
|---|---|---|---|---|---|---|
| Government | 2,605,826 | 2,622,755 | 2,629,143 | 2,594,830 | 2,558,169 | 1.9 |
| Catholic | 795,368 | 787,181 | 778,605 | 769,719 | 765,735 | 3.9 |
| Independent | 641,318 | 620,781 | 599,226 | 584,262 | 569,930 | 12.5 |
| Total | 4,042,512 | 4,030,717 | 4,006,974 | 3,948,811 | 3,893,834 | 3.8 |
The highest annual growth rates of student enrolments in 2022 were in:
- Western Australia: 0.9%
- Australian Capital Territory: 0.8%
- Victoria: 0.5%
- South Australia: 0.5%.
The lowest was in the Northern Territory (-1.2%).
Population growth rates for 5 to 19 year olds in 2022 were:
- Western Australia: 1.8%
- Queensland: 1.7%
- Victoria: 1.3%.
The lowest was in the Australian Capital Territory (-0.3%).
Further information on population growth rates can be accessed from National, state and territory population, June 2022.
In 2022, the annual growth rate for school enrolments was 0.3% (11,795 more students), the lowest growth rate since both full-time and part-time students were included in this publication (1995):
- government school enrolments recorded a fall of 0.6% (16,929 fewer students).
- non-government school enrolments recorded an increase of 2.0% (28,724 more students).
Primary school student enrolments dropped by 20,266 students compared with the year before (a change of 0.9%):
- government primary school enrolments decreased -1.9% (30,049 fewer students).
- non-government primary school enrolments increased 1.4% (9,783 more students).
Secondary school student enrolments increased by 32,061 students (a change of 1.8%):
- government secondary school enrolments increased 1.3% (13,120 more students).
- non-government secondary school enrolments grew by 2.6% (18,941 more students).
In 2022, all remaining South Australian government and non-government schools completed the transition to Year 7 as the starting school grade of secondary schooling. This meant that 2022 is the first year South Australian schools across all affiliations had Year 7 as their starting secondary school grade.
The proportion of students enrolled in non-government schools in 2022 was:
- highest in the Australian Capital Territory (39.1%) and South Australia (37.4%).
- lowest in the Northern Territory (26.6%).
- lower for students enrolled in schools in very remote areas (12.9%) than for remote areas (21.6%), outer regional areas (27.6%), inner regional areas (35.7%) and major cities (36.8%).
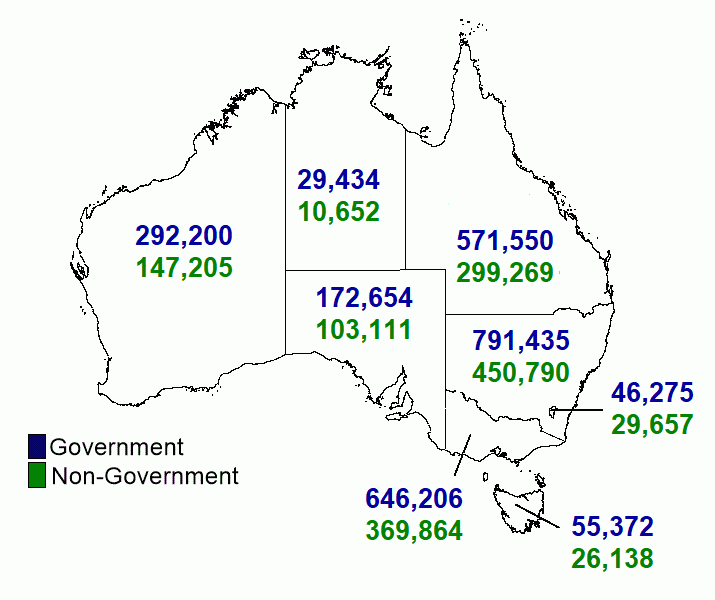
Map 1. Student enrolment counts by state and territory and school affiliation, 2022
Image

Description
A map of Australia showing student enrolment counts by state and territory and affiliation for 2022. Western Australia 292,200 Government studen enrolments; 147,205 Non-Government enrolments. Northern Territory 29,434 Government student enrolments; 10,652 Non-Government enrolments. South Australia 172,654 Government student enrolments; 103,111 Non-Government enrolments. Victoria 646,206 Government student enrolments; 369,864 Non-Government enrolments. Tasmania 55,372 Government student enrolments; 26,138 Non-Government enrolments. New South Wales 791,435 Government student enrolments; 450,790 Non-Government enrolments. Australian Capital Territory 46,275 Government student enrolments; 29,657 on-Government student enrolments. Queensland 571,550 Government student enrolments; 299,269 Non-Government enrolments.