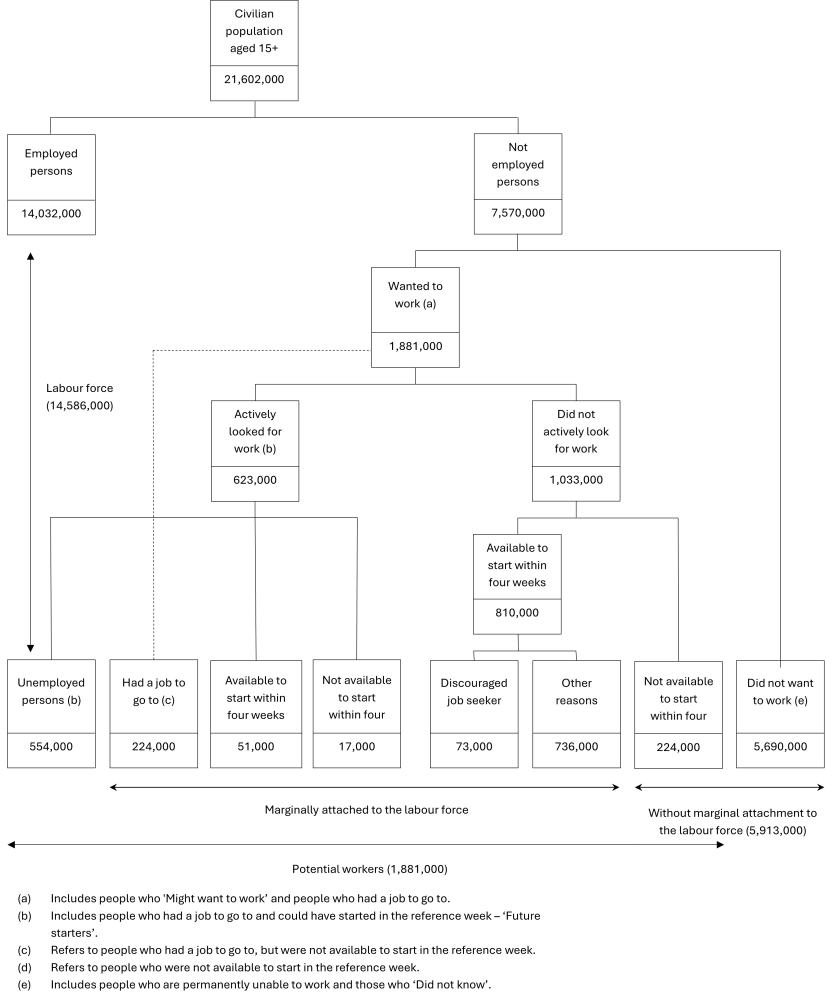
Chart 3: Potential workers
[["Feb-15","Mar-15","Apr-15","May-15","Jun-15","Jul-15","Aug-15","Sep-15","Oct-15","Nov-15","Dec-15","Jan-16","Feb-16","Mar-16","Apr-16","May-16","Jun-16","Jul-16","Aug-16","Sep-16","Oct-16","Nov-16","Dec-16","Jan-17","Feb-17","Mar-17","Apr-17","May-17","Jun-17","Jul-17","Aug-17","Sep-17","Oct-17","Nov-17","Dec-17","Jan-18","Feb-18","Mar-18","Apr-18","May-18","Jun-18","Jul-18","Aug-18","Sep-18","Oct-18","Nov-18","Dec-18","Jan-19","Feb-19","Mar-19","Apr-19","May-19","Jun-19","Jul-19","Aug-19","Sep-19","Oct-19","Nov-19","Dec-19","Jan-20","Feb-20","Mar-20","Apr-20","May-20","Jun-20","Jul-20","Aug-20","Sep-20","Oct-20","Nov-20","Dec-20","Jan-21","Feb-21","Mar-21","Apr-21","May-21","Jun-21","Jul-21","Aug-21","Sep-21","Oct-21","Nov-21","Dec-21","Jan-22","Feb-22","Mar-22","Apr-22","May-22","Jun-22","Jul-22","Aug-22","Sep-22","Oct-22","Nov-22","Dec-22","Jan-23","Feb-23","Mar-23","Apr-23","May-23","Jun-23","Jul-23","Aug-23","Sep-23","Oct-23","Nov-23","Dec-23","Jan-24","Feb-24"],[[97.599999999999994],[null],[null],[null],[null],[null],[null],[null],[null],[null],[null],[null],[100.90000000000001],[null],[null],[null],[null],[null],[null],[null],[null],[null],[null],[null],[93.799999999999997],[null],[null],[null],[null],[null],[null],[null],[null],[null],[null],[null],[95.400000000000006],[null],[null],[null],[null],[null],[null],[null],[null],[null],[null],[null],[106.59999999999999],[null],[null],[null],[null],[null],[null],[null],[null],[null],[null],[null],[105.8],[null],[null],[null],[null],[null],[null],[null],[null],[null],[null],[null],[118.3],[null],[null],[null],[null],[null],[null],[null],[null],[null],[null],[null],[114.7],[null],[null],[null],[null],[null],[null],[null],[null],[null],[null],[null],[108.59999999999999],[null],[null],[null],[null],[null],[null],[null],[null],[null],[null],[null],[104.3]],[[265.60000000000002],[null],[null],[null],[null],[null],[null],[null],[null],[null],[null],[null],[263.19999999999999],[null],[null],[null],[null],[null],[null],[null],[null],[null],[null],[null],[284.10000000000002],[null],[null],[null],[null],[null],[null],[null],[null],[null],[null],[null],[278.39999999999998],[null],[null],[null],[null],[null],[null],[null],[null],[null],[null],[null],[300.19999999999999],[null],[null],[null],[null],[null],[null],[null],[null],[null],[null],[null],[320.39999999999998],[null],[null],[null],[null],[null],[null],[null],[null],[null],[null],[null],[333],[null],[null],[null],[null],[null],[null],[null],[null],[null],[null],[null],[357.39999999999998],[null],[null],[null],[null],[null],[null],[null],[null],[null],[null],[null],[351.80000000000001],[null],[null],[null],[null],[null],[null],[null],[null],[null],[null],[null],[328.5]],[[716.79999999999995],[null],[null],[null],[null],[null],[null],[null],[null],[null],[null],[null],[681],[null],[null],[null],[null],[null],[null],[null],[null],[null],[null],[null],[679.10000000000002],[null],[null],[null],[null],[null],[null],[null],[null],[null],[null],[null],[664.60000000000002],[null],[null],[null],[null],[null],[null],[null],[null],[null],[null],[null],[616.89999999999998],[null],[null],[null],[null],[null],[null],[null],[null],[null],[null],[null],[631.20000000000005],[null],[null],[null],[null],[null],[null],[null],[null],[null],[null],[null],[747.39999999999998],[null],[null],[null],[null],[null],[null],[null],[null],[null],[null],[null],[494.39999999999998],[null],[null],[null],[null],[null],[null],[null],[null],[null],[null],[null],[462],[null],[null],[null],[null],[null],[null],[null],[null],[null],[null],[null],[518.60000000000002]],[[1299.5999999999999],[null],[null],[null],[null],[null],[null],[null],[null],[null],[null],[null],[1231.9000000000001],[null],[null],[null],[null],[null],[null],[null],[null],[null],[null],[null],[1233.9000000000001],[null],[null],[null],[null],[null],[null],[null],[null],[null],[null],[null],[1205.3],[null],[null],[null],[null],[null],[null],[null],[null],[null],[null],[null],[1118.5],[null],[null],[null],[null],[null],[null],[null],[null],[null],[null],[null],[1115.5999999999999],[null],[null],[null],[null],[null],[null],[null],[null],[null],[null],[null],[1212],[null],[null],[null],[null],[null],[null],[null],[null],[null],[null],[null],[892.60000000000002],[null],[null],[null],[null],[null],[null],[null],[null],[null],[null],[null],[868.89999999999998],[null],[null],[null],[null],[null],[null],[null],[null],[null],[null],[null],[946.5]],[[1629.0999999999999],[null],[null],[null],[null],[null],[null],[null],[null],[null],[null],[null],[1558.7],[null],[null],[null],[null],[null],[null],[null],[null],[null],[null],[null],[1539.5999999999999],[null],[null],[null],[null],[null],[null],[null],[null],[null],[null],[null],[1520],[null],[null],[null],[null],[null],[null],[null],[null],[null],[null],[null],[1441.7],[null],[null],[null],[null],[null],[null],[null],[null],[null],[null],[null],[1479.4000000000001],[null],[null],[null],[null],[null],[null],[null],[null],[null],[null],[null],[1572.7],[null],[null],[null],[null],[null],[null],[null],[null],[null],[null],[null],[1222.5999999999999],[null],[null],[null],[null],[null],[null],[null],[null],[null],[null],[null],[1207],[null],[null],[null],[null],[null],[null],[null],[null],[null],[null],[null],[1311]],[[1858.5999999999999],[null],[null],[null],[null],[null],[null],[null],[null],[null],[null],[null],[1796],[null],[null],[null],[null],[null],[null],[null],[null],[null],[null],[null],[1755.0999999999999],[null],[null],[null],[null],[null],[null],[null],[null],[null],[null],[null],[1759.0999999999999],[null],[null],[null],[null],[null],[null],[null],[null],[null],[null],[null],[1650.4000000000001],[null],[null],[null],[null],[null],[null],[null],[null],[null],[null],[null],[1701.7],[null],[null],[null],[null],[null],[null],[null],[null],[null],[null],[null],[1804.7],[null],[null],[null],[null],[null],[null],[null],[null],[null],[null],[null],[1428.7],[null],[null],[null],[null],[null],[null],[null],[null],[null],[null],[null],[1427.8],[null],[null],[null],[null],[null],[null],[null],[null],[null],[null],[null],[1552.0999999999999]],[[2124.1999999999998],[null],[null],[null],[null],[null],[null],[null],[null],[null],[null],[null],[2059.1999999999998],[null],[null],[null],[null],[null],[null],[null],[null],[null],[null],[null],[2039.2],[null],[null],[null],[null],[null],[null],[null],[null],[null],[null],[null],[2037.5],[null],[null],[null],[null],[null],[null],[null],[null],[null],[null],[null],[1950.5],[null],[null],[null],[null],[null],[null],[null],[null],[null],[null],[null],[2022],[null],[null],[null],[null],[null],[null],[null],[null],[null],[null],[null],[2137.8000000000002],[null],[null],[null],[null],[null],[null],[null],[null],[null],[null],[null],[1786.0999999999999],[null],[null],[null],[null],[null],[null],[null],[null],[null],[null],[null],[1779.5999999999999],[null],[null],[null],[null],[null],[null],[null],[null],[null],[null],[null],[1880.5999999999999]],[[203.69999999999999],[151.30000000000001],[163.40000000000001],[147.5],[139],[154],[177.30000000000001],[168.59999999999999],[172.80000000000001],[169.5],[173.09999999999999],[301.5],[190.59999999999999],[165.19999999999999],[154.40000000000001],[164.09999999999999],[157.09999999999999],[179.09999999999999],[186.30000000000001],[171.59999999999999],[178.19999999999999],[182.69999999999999],[186.59999999999999],[307.60000000000002],[213.40000000000001],[175.80000000000001],[167.59999999999999],[164.30000000000001],[163.59999999999999],[188.09999999999999],[175.09999999999999],[149.09999999999999],[170.30000000000001],[162.69999999999999],[170.90000000000001],[277.5],[192.19999999999999],[166.19999999999999],[160.59999999999999],[155.59999999999999],[160.90000000000001],[174.30000000000001],[185.19999999999999],[163.80000000000001],[172.90000000000001],[187.30000000000001],[179.5],[312.39999999999998],[198.69999999999999],[188.59999999999999],[176.5],[173.19999999999999],[182],[181.59999999999999],[172.30000000000001],[178.30000000000001],[192.90000000000001],[210.19999999999999],[203.59999999999999],[327.10000000000002],[235.40000000000001],[186.5],[309.39999999999998],[576.5],[427.19999999999999],[354.39999999999998],[292.60000000000002],[298.80000000000001],[284.30000000000001],[249.09999999999999],[208.80000000000001],[351.10000000000002],[240.90000000000001],[176.19999999999999],[198],[185.19999999999999],[212.5],[241.30000000000001],[372.5],[513.39999999999998],[519.5],[273.69999999999999],[243.30000000000001],[394.80000000000001],[259.39999999999998],[228.5],[228.19999999999999],[216.69999999999999],[209.59999999999999],[230.19999999999999],[229.69999999999999],[202.09999999999999],[224.80000000000001],[204.19999999999999],[230],[409],[263.80000000000001],[206.19999999999999],[209.5],[195.80000000000001],[211.5],[227.19999999999999],[224.59999999999999],[225.09999999999999],[211.09999999999999],[214.09999999999999],[230.09999999999999],[419.80000000000001],[241.40000000000001]],[[764.60000000000002],[759.89999999999998],[761],[740.10000000000002],[750],[788.5],[762.89999999999998],[775.20000000000005],[745.39999999999998],[738.60000000000002],[724.29999999999995],[765.20000000000005],[719.29999999999995],[715.39999999999998],[714.79999999999995],[725.10000000000002],[723.10000000000002],[725.70000000000005],[712],[717.20000000000005],[709.60000000000002],[733.10000000000002],[743.29999999999995],[724.5],[751.29999999999995],[749.70000000000005],[720.79999999999995],[715.29999999999995],[727.70000000000005],[728.29999999999995],[719.70000000000005],[712],[704.5],[712.70000000000005],[735.5],[725.89999999999998],[732.89999999999998],[728.29999999999995],[731.29999999999995],[717],[707.79999999999995],[702.70000000000005],[697.70000000000005],[665.60000000000002],[665.5],[679.29999999999995],[666.60000000000002],[674.70000000000005],[666.5],[683],[704.39999999999998],[703],[712.29999999999995],[718.89999999999998],[717.10000000000002],[710.70000000000005],[720.89999999999998],[699.89999999999998],[682.29999999999995],[714.5],[693.70000000000005],[707.10000000000002],[831.5],[908],[987.5],[1005.2],[918.70000000000005],[930.39999999999998],[948.10000000000002],[926.79999999999995],[892],[857.39999999999998],[796.5],[776],[751.20000000000005],[703.70000000000005],[693.39999999999998],[654.79999999999995],[623.89999999999998],[632.79999999999995],[709.29999999999995],[634.29999999999995],[575.60000000000002],[575.70000000000005],[558],[552.5],[541],[554.89999999999998],[511.10000000000002],[490.80000000000001],[502.80000000000001],[510.19999999999999],[490],[497.80000000000001],[496.89999999999998],[521.70000000000005],[513.29999999999995],[515.20000000000005],[538.29999999999995],[522.89999999999998],[515.20000000000005],[547.60000000000002],[542.10000000000002],[520.79999999999995],[557.39999999999998],[575.60000000000002],[579.10000000000002],[600.20000000000005],[548.29999999999995]]]
[]
[{"axis_id":"0","tick_interval":"","axis_min":"","axis_max":"","axis_title":"","precision":-1,"axis_units":"","tooltip_units":"","table_units":"","data_unit_prefix":"","data_unit_suffix":"","reverse_axis":false}][{"value":"0","axis_id":"0","axis_title":"Potential workers ('000)","axis_units":"","tooltip_units":"('000)","table_units":"('000)","axis_min":"0","axis_max":"2500","tick_interval":null,"precision":"1","data_unit_prefix":"","data_unit_suffix":"","reverse_axis":false}]