The ABS will be closed from 12.00pm, 24 December 2024 and will reopen at 9.00am, 2 January 2025. During this time there will be no statistical releases and our support functions will be unavailable. The ABS wishes you a safe and happy Christmas.

National Ocean Account, Experimental Estimates

Latest release

Experimental estimates to measure changes in ocean ecosystems.

Reference period
November 2022

Key statistics

  • In 2021 mangroves and saltmarsh combined provided coastal protection services for 280 thousand people occupying 150 thousand dwellings.
  • In 2021 there were 1.1 million ha of saltmarsh.
  • In 2020 there were 389 thousand ha of intertidal seagrass meadows.

Phase 2 of National Ocean Account

This release is Phase 2 of the National Ocean Account. It includes new estimates of saltmarsh and intertidal seagrass ecosystems. Phase 1 of the Account can be accessed here

Towards A National Ocean Account is a discussion article that highlights learnings from the development of the Account. Feedback continues to be sought on the functionality and use of Phase 1 and 2 of the Account.

Saltmarsh

Saltmarsh extent was estimated from an experimental earth observation model.

In 2021, there were 1.1 million ha of saltmarsh nationally.

Saltmarsh ecosystems were primarily located in:

  • Queensland (45% of total)
  • Northern Territory (38% of total)

The sediment compartments that contributed most to national estimates were:

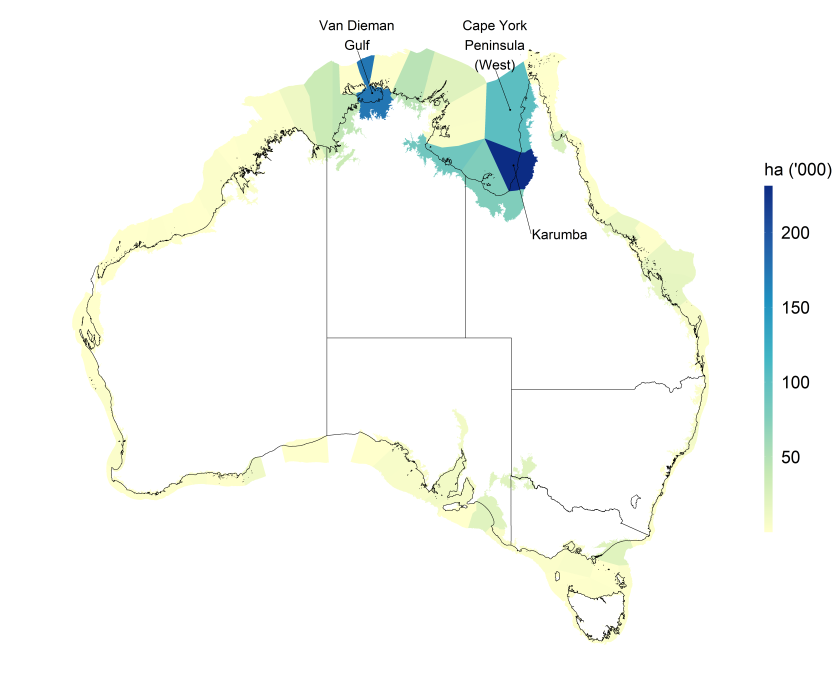
  • Karumba, Queensland (21% of total)
  • Van Diemen Gulf, Northern Territory (16% of total)
  • Cape York Peninsula (West), Queensland (9% of total)

Saltmarsh extent by primary sediment compartment, 2021

A map of Australia with primary sediment compartments shaded from yellow to green to blue indicating the total hectares of saltmarsh. The primary sediment compartments Van Dieman Gulf (Northern Territory), Karumba (Gulf of Carpentaria, Queensland), and Cape York Peninsula (West) (Queensland) are labelled as they have the largest saltmarsh extents.
The image shows a map of Australia including state boundaries with primary sediment compartments shaded to indicate the total hectares of saltmarsh within the compartment. The colour scale goes from pale yellow to dark blue representing a range from zero to 231 thousand hectares. The three primary sediment compartments with the largest saltmarsh extent are labelled. Karumba (Gulf of Carpentaria, Queensland) is dark blue (more than 200 thousand ha) and has the largest extent. Van Dieman Gulf (Northern Territory) is blue (150 to 200 thousand ha) and has the second greatest extent. Cape York Peninsula (West) (Queensland) is teal (100 to 150 thousand ha) and has the third largest extent. Other sediment compartments in the Gulf of Carpentaria in Northern Territory and Queensland are lighter teal (50 to 100 thousand ha). Much of the remainder of the Northern Territory coast, patches along the Queensland coast, the Coorong in South Australia and Ninety Mile Beach in Victoria are pale green (25 to 50 thousand ha). The remaining sediment compartments are pale yellow (less than 25 thousand ha) with the exception of Ningaloo (Central Western Australia), Baxter (Southern Western Australia) and Head of Bight (Western South Australia) which have no colour as there was no saltmarsh identified in these primary sediment compartments.

Based on the 2016 national land use model, the land uses that most commonly occurred on saltmarsh were:

  • Water (51% of total)
  • Grazing native vegetation (20% of total)
  • Managed resource protection (16% of total)

Intertidal seagrass

Intertidal seagrass refers to seagrass that is present in the area of coastline between the high and low tide marks. The total intertidal extent of seagrass was estimated from an experimental earth observation model.

In 2020 there were 388.7 thousand ha of seagrass in intertidal coastal waters.

Intertidal seagrass ecosystems were predominantly located in:

  • Queensland (31% of total)
  • Western Australia (23% of total)
  • Northern Territory (19% of total)

The sediment compartments that contributed most to national estimates were:

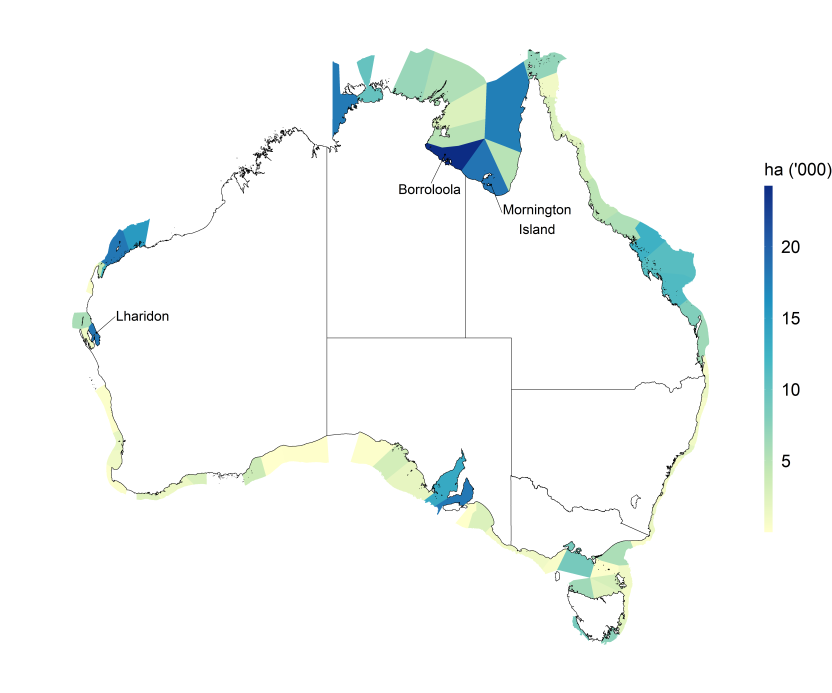
  • Borroloola, Northern Territory (6.2% of total)
  • Mornington Island, Queensland (4.7% of total)
  • Lharidon, Western Australia (4.7% of total)

Intertidal seagrass extent by primary sediment compartment, 2020

A map of Australia with primary sediment compartments shaded from yellow to green to blue indicating the total hectares of intertidal seagrass. The primary sediment compartments Lharidon (central Western Australian coast), Borroloola (Gulf of Carpentaria, Northern Territory), and Mornington Island (Gulf of Carpentaria, Northern Territory and Queensland) are labelled as they have the largest intertidal seagrass extents.
The image shows a map of Australia including state boundaries with primary sediment compartments shaded to indicate the total hectares of intertidal seagrass within the compartment. The colour scale goes from pale yellow to dark blue representing a range from zero to 25 thousand hectares. The three primary sediment compartments with the largest intertidal seagrass extent are labelled. Borroloola (Gulf of Carpentaria, Northern Territory) is dark blue (more than 20 thousand ha) and has the largest extent. Mornington Island (Gulf of Carpentaria, Northern Territory and Queensland) is blue (15 to 20 thousand ha) and has the second greatest extent. Lharidon (central Western Australian coast around Hamelin Bay) is also blue and has the third largest extent. Other areas shown in blue (15 to 20 thousand ha) include areas east of Exmouth to Dampier in Western Australia, Darwin in the Northern Territory, and western Cape York Peninsula in Queensland. Areas around Adelaide are blue and teal (10 to 20 thousand hectares), and some compartments around Tasmania and near Melbourne are shades of green (5 to 10 thousand ha). Northern Territory sediment compartment areas range between 5 to 15 thousand ha. Sediment compartments around the central Queensland coast have between 10 to 15 thousand ha (shown in teal). The remaining sediment compartments with data available are pale yellow to light green (less than 5 thousand ha). There are sediment compartments with no colour in the northwest of Australia (predominately between Roebourne in the Port Headland region of Western Australia and Bonaparte East on the Western Australia/Northern Territory border) along with some in the Central West and Southern Coast of Western Australia as data was not available for these regions.

Kelp

The production of kelp accounts was investigated during the development of phase 2 of the National Ocean Account. Experts in the field were engaged in this process and confirmed that there is insufficient data currently available to produce reliable national kelp accounts. The ABS will continue to explore potential opportunities in producing kelp accounts. Tables 3 and 6 illustrate the potential format of kelp ecosystem accounts, should account ready data become available.

Carbon stock and sequestration

Saltmarsh

In 2021, 275.6 million tonnes of carbon (MtC) were stored in saltmarsh and 10.1 million tonnes of carbon dioxide equivalent were sequestered annually (tCO2e yr-1).

  • Northern Territory had the largest amount of carbon stored in saltmarsh (44%).
  • This was driven by the Northern Territory storing a higher amount of carbon per hectare.
  • Queensland had the highest sequestration rate (33%).
  • This was driven by Queensland having the greatest saltmarsh extent.

Coastal protection services

Coastal protection may be afforded to communities from either mangroves, saltmarsh, or a combination of both. The same dwelling, person, or length of coastline may be protected by mangroves and saltmarsh simultaneously and is only counted in the total once.

In 2021, 149.6 thousand dwellings were offered coastal protection by either saltmarsh, mangroves, or both.

  • 58 thousand (39.0% of total) were in Queensland.
  • 23 thousand (15.3% of total) were in Victoria.

Saltmarsh protected 88.1 thousand dwellings.

  • 21 thousand were in Victoria.

Mangroves protected 85.6 thousand dwellings.

  • 52 thousand were in Queensland.

Note: Dwellings protected by mangrove and saltmarsh will not sum to the total as a dwelling may be protected by mangroves and saltmarsh

In 2021, 280 thousand people received coastal protection services from either saltmarsh, mangroves, or both.

  • 116 thousand (41.5% of total) were in Queensland.
  • 40 thousand (14.3% of total) were in Victoria.

Saltmarsh protected 151 thousand people.

  • 37 thousand were in Victoria.
  • 32 thousand were in Tasmania.

Mangroves protected 175 thousand people.

  • 107 thousand were in Queensland.
  • 23 thousand were in Northern Territory.

Note: People protected by mangroves and saltmarsh will not sum to the total as a person may be protected by mangroves and saltmarsh

In 2021, 19.6 thousand kilometres of Australia's coastline were offered coastal protection from either saltmarsh, mangroves, or both.

  • 6.0 thousand kilometres (30.8% of total) were in Western Australia.
  • 5.3 thousand kilometres (27.3% of total) were in Northern Territory.
  • 5.3 thousand kilometres (27.1% of total) were in Queensland.

Saltmarsh protected 3.6 thousand kilometres of coastline.

  • 826 kilometres were in Victoria.
  • 773 kilometres were in Tasmania.
  • 736 kilometres were in South Australia.

Mangroves protected 16.9 thousand kilometres of coastline.

  • 5.7 thousand kilometres were in Western Australia.
  • 5.2 thousand kilometres were in Northern Territory.
  • 5.0 thousand kilometres were in Queensland.

Note: Coastline protected by mangroves and saltmarsh will not sum to the total as a length of coastline may be protected by mangroves and saltmarsh

In 2021, the cost to replace mangroves and saltmarsh offering coastal protection through a seawall was:

  • $228 billion to replace services provided by either saltmarsh, mangroves, or both.
  • $41.6 billion for saltmarsh.
  • $196 billion for mangroves.

The annual service value of mangroves and saltmarsh, estimated through capital depreciation of seawall infrastructure, was:

  • $2.3 billion to $9.1 billion in annual services value offered by either saltmarsh, mangroves, or both.
  • $416 million to $1.7 billion in annual services value offered by saltmarsh.
  • $2.0 billion to $7.8 billion in annual services value offered by mangroves.

Changes from previous release

  • This release represents phase 2 of the National Ocean Account and includes new estimates for saltmarsh and intertidal seagrass ecosystems based off new earth observation based data sets. The August release represented phase 1 of the National Ocean Account and included statistics for mangroves based off an earth observation data set and seagrass covering inter- and sub- tidal coastal waters using a consolidated data set of ecological surveys. 
  • The methodology informing the coastal protection estimates for mangroves has been refined since the August release. This provides a more accurate estimate of length of coastline protected and the associated economic replacement costs. As a result, statistics on length of coastline, seawall construction cost, minimum and maximum service values have been updated in this release and in Table 7: Ecosystem Services Account, Saltmarsh and Mangrove Ecosystems (Australia, States, Territories), 2021.

Data downloads

Data files
Back to top of the page