Australian National Accounts: State Accounts

This is not the latest release View the latest release

Key National Accounts aggregates by state and territory

Reference period
2019-20 financial year
Released
20/11/2020

Key statistics

Key aggregates, 2019-20 % change
  NSWVICQLDSAWATASNTACTAustralia
Chain volume measures (a)
 GSP-0.7-0.5-1.1-1.41.40.35.32.4-0.3
 GSP per capita (b)-1.8-2.3-2.6-2.30.1-0.65.71.4-1.7
 Real Gross State Income-1.5-0.9-3.4-1.180.43.72.3-0.1
Current price values
 GSP01.4-1.80.79.72.84.53.81.7

(a) Reference year for chain volume measures is 2018-19.
(b) Population estimates are as published in National, state and territory population and ABS projections.

Articles

This year's State Accounts release includes the following articles:

Analysis of results

Gross State Product (GSP) volume measures

The Australian economy contracted 0.3% in 2019-20, ending 28 consecutive years of economic growth as economic activity was impacted by the COVID-19 pandemic and bushfires. In 2019-20, there were mixed results across states and territories with four states recording contraction and the smaller jurisdictions recording expansion.

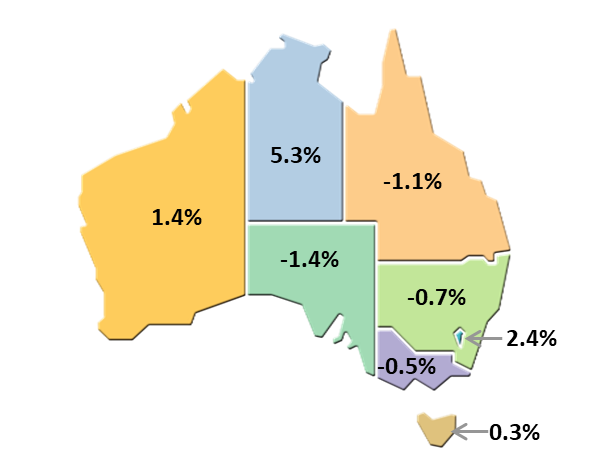
Gross State Product annual growth, 2019-20

A map of Australia depicting the Gross State Product annual growth for the financial year ending 2019-20
A map of Australia depicting the Gross State Product annual growth for the financial year ending 2019-20. The left of the map shows that Western Australia's Gross State Product annual growth increased by 1.4%, for the 2019-20 financial year. The middle of the map shows that Northern Territory's Gross State Product annual growth increased by 5.3%, whereas South Australia's annual growth decreased by 1.4%, for the 2019-20 financial year. The right of the map shows that Queensland's Gross State Product annual growth decreased by 1.1%, New South Wales' Gross State Product annual growth decreased by 0.7%, Australian Capital Territory increased by 2.4% and Victoria decreased by 0.5% in the 2019-20 financial year. The bottom of the map shows that Tasmania's Gross State Product annual growth increased by 0.3% for the 2019-20 financial year.

New South Wales

New South Wales GSP fell 0.7% in 2019-20, the state's first fall in recorded history. The COVID-19 pandemic related restrictions and containment measures, drought and bushfires drove the weakness. 

Tourism and recreation related industries such as Transport, Postal and Warehousing, Accommodation and Food Services, Arts and Recreational Services and Administrative Support Services were adversely impacted by both the onset of the COVID-19 pandemic and bushfires over the summer months. 

Drought conditions continued in 2019-20, resulting in Agriculture GVA to fall 9.1%, recording its third consecutive fall. 

Dwelling investment remained weak, falling 15.5%, the steepest decline since 2000-01. This was reflected in a fall in Construction GVA (-4.8%), the largest industry detractor from growth. 

Professional, Scientific and Technical Services GVA (4.2%) partly offset the fall, driven by increased demand for computer systems, cyber security services and web services as workplaces enabled working from home arrangements and businesses adopted alternate business models. 

Health Care and Social Assistance GVA rose 4.4%, driven by the public sector response to COVID-19 and continued demand for disability services. Private health services contracted reflecting restrictions on elective surgeries and reductions in visits to medical practitioners and allied health services. 

Victoria

Following steady growth over the past decade, Victoria GSP fell 0.5% as economic activity was impacted by the COVID-19 pandemic related restrictions and containment measures. The largest contractions in industry gross value added (GVA) were recorded in services industries including Accommodation and Food Services (-12.5%), Other services (-7.8%), Arts and Recreation Services (-6.1%) and Transport, Postal and Warehousing (-5.6%). 

Construction GVA contracted for the first time since 2012-13, reflecting the recent slowdown in building approvals and dwelling investment. 

Industries serving businesses continued to expand. Professional, Scientific and Technical Services GVA rose 4.5% with increase demand for computer and web-based services. Financial and Insurance Services GVA continued to grow, reflecting increased loan and deposit balances. 

Health Care and Social Assistance GVA rose 4.2%, driven by the public sector response to COVID-19 and continued demand for disability services. Private health services contracted reflecting restrictions on elective surgeries and reductions in visits to medical practitioners and allied health services. 

Public Administration and Safety rose 5.7%, reflecting continued spending on frontline services. 

Queensland

Queensland GSP fell 1.1%, the state's first fall in recorded history. Queensland was adversely impacted by the COVID-19 pandemic and related containment measures like the rest of Australia. Queensland recorded a larger contraction compared to the national result due to larger falls in private investment. 

Dwelling investment continued to fall due to oversupply of high-density apartments following high levels of investment in 2014-15 and 2015-16. New engineering construction continued to fall, reflecting reduced investment by LNG and coal miners. This was reflected in a fall in Construction and Professional, Scientific and Technical Services GVA. 

Public Administration and Safety GVA partly offset the falls as the government responded to the COVID-19 pandemic as well as increased spending on frontline services. 

Queensland was the only state to record a fall in nominal GSP, reflecting the sharp falls in coal and LNG prices experienced in 2019-20.

South Australia

South Australia GSP decreased 1.4%, recording the largest fall of all states and territories. South Australia was adversely impacted by the COVID-19 pandemic and related containment measures like the rest of Australia. 

Household spending fell a record 3.1% with reduced spending on hotels, cafes and restaurants, transport, and recreation and culture as a result of COVID-19 related restrictions. This was reflected in falls in gross value added (GVA) for Accommodation and Food Services, Transport, Postal and Warehousing and Arts and Recreation Services. 

Agriculture, Forestry and Fishing GVA fell 6.7%, driven by continued drought conditions. The decline in Agriculture, Forestry and Fishing was not as pronounced other jurisdictions as South Australia experienced more favourable growing conditions compared to the eastern states. 

Health Care and Social Assistance GVA rose 3.8%, driven by the public sector response to COVID-19 and continued demand for disability services. 

Western Australia

Western Australia GSP grew 1.4%. Mining was the main contributor to growth, driven by Iron Ore Mining and Oil and Gas Extraction. Western Australia exhibited the strongest growth in nominal GSP with growth of 9.7%, reflecting the rise in iron ore prices and increase in production volumes.

The transition of large mining projects from the construction to production phases continued to impact on segments of the Western Australian economy, resulting in prolonged weakness in Dwelling Construction and Construction Services. As a result, Construction GVA declined (-4.6%) for the 6th consecutive year. 

Agriculture, Forestry and Fishing GVA declined (-10.4%) in Western Australia following the bumper crops and increased domestic demand in the previous year. 

As experienced across the nation, COVID-19 related restrictions resulted in strong declines in Accommodation and Food Services (-9.1%) and Transport, Postal and Warehousing (-4.9%) GVA. 

Tasmania

Tasmania GSP grew 0.3%, driven by moderate growth in the public sector. Health Care and Social Assistance and Public Administration and Safety GVA increased strongly reflecting ongoing national and state expenditure on hospital, disability and aged care related services as well as the additional services required in response to the COVID-19 pandemic. 

High demand for tourism in Tasmania prior to the COVID-19 pandemic, drove continued growth in non-dwelling investment through the construction of accommodation buildings. Tasmania’s high exposure to tourism resulted in significant falls in Accommodation and Food Services, as well as Transport, Postal and Warehousing GVA as COVID-19 restrictions impacted the state.

Northern Territory

Northern Territory GSP grew 5.3% recording the strongest growth in GSP of all states and territories.

Mining GVA increased 39.7% driven by Oil and Gas Extraction, reflecting the transition from construction to production of LNG in the territory. Health Care and Social Assistance and Public Administration and Safety contributed to growth, driven by increased territory expenditure on frontline services.

Restrictions in response to the COVID-19 pandemic in addition to underlying weakness in both business and consumer sentiment, as well as continued declines in the Northern Territory population, resulted in falls in GVA across 14 of the 19 industries.  

Australian Capital Territory

Australian Capital Territory GSP grew 2.4%, recording 30 years of continuous growth.

Growth in the Australian Capital Territory was driven by strength in the public sector, with rises from both national and territory expenditure in Health Care and Social Assistance and Public Administration and Safety. Services industries supporting the public sector also exhibited growth including Professional, Scientific and Technical Services, Wholesale Trade and Administrative and Support Services. 

Closures and restrictions as a consequence of bushfires and the COVID-19 pandemic resulted in declines in selected services industries. The largest detractor from growth was Accommodation and Food Services GVA (-13.2%).

Real Gross State Income

Half of all states and territories record lower Real Gross State Income (RGSI) in 2019-20

While GSP measures domestic production, the real purchasing power of income generated from that production is affected by changes in the prices of international and interstate imports and exports. RGSI adjusts GSP for changes in a state's terms of trade. 

Strong movements in commodity prices resulted in large variations in RGSI across the states and territories.  The largest increase was recorded in WA (8.0%) reflecting strong growth in iron ore prices and WA dominance in iron ore production and exports compared to other states and territories. Growth in LNG production contributed to the rise in NT RGSI (3.7%).

Changes in this issue

The estimates in this issue incorporates new and revised national estimates as published in the 2019-20 Australian System of National Accounts (cat. no. 5204.0). This includes the incorporation of the 2018-19 annual supply and use tables. For more information on the role of the supply and use tables in the national accounts and the major revisions please see the '2018-19 supply and use tables' section within the Australian System of National Accounts publication. These revisions, spanning the entire time series, are necessary in order to reflect changes in methods, concepts, classifications and data sources and to maintain consistent time series.

The national revisions impact all states, although the extent varies across states. This is due to differing state weights of estimates affected by revisions. For example, if a certain state has a large proportion of an industry, then revisions to that industry's national total will have a greater impact upon the predominate state's result compared to the other states and territories. Estimates in recent years have also been revised based on the addition of new and updated data sources that have become available throughout the year.

The estimates in this issue incorporate improvements to the measurement of income from gross state product and related components in the state household income accounts. Further details can be found in the Improvements to state income measures article. 

Inquiries

For further information about these and related statistics, contact the National Information and Referral Service on 1300 135 070. The ABS Privacy Policy outlines how the ABS will handle any personal information that you provide to us.

Data downloads

Table 1. Gross state product, chain volume measures and current prices

Table 2. Expenditure, income and industry components of gross state product, New South Wales, chain volume measures and current prices

Table 3. Expenditure, income and industry components of gross state product, Victoria, chain volume measures and current prices

Table 4. Expenditure, income and industry components of gross state product, Queensland, chain volume measures and current prices

Table 5. Expenditure, income and industry components of gross state product, South Australia, chain volume measures and current prices

Table 6. Expenditure, income and industry components of gross state product, Western Australia, chain volume measures and current prices

Table 7. Expenditure, income and industry components of gross state product, Tasmania, chain volume measures and current prices

Table 8. Expenditure, income and industry components of gross state product, Northern Territory, chain volume measures and current prices

Table 9. Expenditure, income and industry components of gross state product, Australian Capital Territory, chain volume measures and current prices

Table 10. Expenditure, income and industry components of gross domestic product, Australia, chain volume measures and current prices

Table 11. Agricultural income, all states: current prices

Table 12. Household income account and per capita, New South Wales: current prices

Table 13. Household income account and per capita, Victoria: current prices

Table 14. Household income account and per capita, Queensland: current prices

Table 15. Household income account and per capita, South Australia: current prices

Table 16. Household income account and per capita, Western Australia: current prices

Table 17. Household income account and per capita, Tasmania: current prices

Table 18. Household income account and per capita, Northern Territory: current prices

Table 19. Household income account and per capita, Australian Capital Territory: current prices

Table 20. Household income account and per capita, Australia: current prices

Table 21. New South Wales capital stock by type of asset, institutional sector and industry

Table 22. Victoria capital stock by type of asset, institutional sector and industry

Table 23. Queensland capital stock by type of asset, institutional sector and industry

Table 24. South Australia capital stock by type of asset, institutional sector and industry

Table 25. Western Australia capital stock by type of asset, institutional sector and industry

Table 26. Tasmania capital stock by type of asset, institutional sector and industry

Table 27. Northern Territory capital stock by type of asset, institutional sector and industry

Table 28. Australian Capital Territory capital stock by type of asset, institutional sector and industry

All time series spreadsheets

Previous catalogue number

This release previously used catalogue number 5220.0.
 

Back to top of the page