The ABS will be closed from 12.00pm, 24 December 2024 and will reopen at 9.00am, 2 January 2025. During this time there will be no statistical releases and our support functions will be unavailable. The ABS wishes you a safe and happy Christmas.

Australian National Accounts: National Income, Expenditure and Product

This is not the latest release View the latest release

Quarterly estimates of key economic flows in Australia, including gross domestic product (GDP), consumption, investment, income and saving

Reference period
March 2020
Released
3/06/2020

Key statistics

  • The Australian economy contracted by 0.3% in seasonally adjusted chain volume terms.
  • Through the year GDP was up 1.4%.
  • The terms of trade rose 2.9%.
  • Household saving ratio increased to 5.5% from 3.5%.

Main features

March key figures

  Seasonally adjusted, percentage change (a)
  Dec 18 to Mar 19Mar 19 to Jun 19Jun 19 to Sep 19Sep 19 to Dec 19Dec 19 to Mar 20Mar 19 to Mar 20
Chain volume GDP and related measures (b)      
 GDP0.50.60.60.5-0.31.4
 GDP per capita (c)0.10.30.20.2-0.7-
 Gross value added market sector (d)0.70.30.30.4-0.60.3
 Real net national disposable income1.01.70.9-0.70.52.4
Productivity      
 GDP per hour worked-0.40.7-0.2 0.30.51.4
 Real unit labour costs-0.70.30.11.4-1.00.7
Prices      
 GDP chain price index (original)1.21.10.7-1.21.11.7
 Terms of trade3.21.50.1-5.22.9-0.9
Current price measures      
 GDP1.61.41.2-0.20.83.1
 Household saving ratio3.42.64.83.55.5 na

na not available
a. Change on preceding quarter, except for the last column which shows the change between the current quarter and the corresponding quarter of the previous year. Excludes Household saving ratio.
b. Reference year for chain volume measures and real income measures is 2017-18.
c. Population estimates are as published in the Australian Demographic Statistics (cat. no. 3101.0) and ABS projections.
d. ANZSIC divisions A to N, R and S. See Glossary - Market sector.
 

Revisions in this issue

There are revisions in this issue due to the incorporation of more up-to-date data and concurrent seasonal adjustment.

Suspension of trend estimates

Due to the impacts of COVID-19 on the economy, trend estimates for all series in the National Accounts have been suspended from June 2019 (inclusive). In the short term, this measurement will be significantly affected by changes to regular patterns in economic activity. If trend estimates were to be calculated without fully accounting for this unusual event, they would likely provide a misleading view of the underlying trend in the economy.

Changes in the seasonal adjustment process

Series with significant and prolonged impacts from COVID-19 will use forward seasonal factors to produce seasonally adjusted estimates instead of the standard concurrent seasonal factors method. The forward factors approach is better suited to managing large movements at the end of a series and will ensure that large movements do not have a disproportionate influence on the seasonal factors. A number of series across all measures have been moved to forward factors this quarter.

Changes to hours worked

National Accounts has incorporated hours worked from the Labour Accounts as of March quarter 2020. Labour Accounts are produced within the same framework used by National Accounts and are consistent in concept and scope.

Privacy

The ABS Privacy Policy outlines how the ABS will handle any personal information that you provide to the ABS.

Key tables

Show all

Analysis

Australian economy contracted 0.3%

Gross Domestic Product (GDP) fell 0.3%. The through the year growth was 1.4%, the lowest result since the Global Financial Crisis in September 2009, well below the long-term average of 3.4%. The through the year growth reflects a strong contribution from net trade and subdued growth in domestic final demand.

Private demand drives the fall in domestic final demand

Domestic final demand detracted 0.5 percentage points from GDP, with household final consumption expenditure and private investment contributing to the fall. Government final consumption expenditure partly offset the fall, contributing 0.3 percentage points, as government increased spending in response to bushfires and COVID-19.

Weakest household spending result since the global financial crisis

Household final consumption expenditure fell 1.1%, the first decline since December 2008, detracting 0.6 percentage points from GDP. The through the year result was -0.2%, the weakest since March 2009.

Unprecedented decline in household spending on services

Spending on services fell 2.4% with the introduction of social distancing restrictions and travel bans. Spending on goods rose 1.0% driven by food, alcohol, pharmaceutical products and home office equipment as households prepared for lockdown measures.

Dwelling investment continues to decline

Investment in new and used dwellings fell 2.9% in the quarter and 15.5% through the year, reflecting continued weakness in dwelling approvals. Both houses (-1.4%) and other residential dwellings (-5.2%) contributed to the decline this quarter.

Non-mining drives the fall in private business investment

Non-mining business investment fell 1.7% this quarter and 6.6% through the year, reflecting weakness across both non-dwelling construction and machinery and equipment purchases. Mining business investment rose 3.6% this quarter and increased 10.3% through the year as miners continued investment in new technologies and automation.

Net exports contributed 0.5 percentage points to GDP

The fall in imports (-6.2%) was greater than the fall in exports (-3.5%). Imports of goods fell 3.9%, reflecting reduced imports of consumption and intermediate goods. Imports of services fell 13.6% with travel services falling significantly in response to travel bans. Exports of goods fell 0.7%, driven by a fall in rural goods, particularly meat and cereal products. Exports of services fell 12.8%, reflecting the travel ban impacts on education related travel and tourism.

COVID-19 impacts selected industries

Gross value added fell 0.3% in the quarter but remained up 1.3% through the year. Many service industries recorded falls as a result of COVID-19 related lockdown and social distancing measures. The largest falls were seen in Accommodation and Food Services, Transport, Postal and Warehousing, Recreation and Culture. In contrast, Manufacturing, Wholesale Trade and Retail Trade recorded rises with increased demand for food, chemical products and home office equipment.

Health care services records a fall

Health care and social assistance value added has fallen for the first time since June quarter 2011, down 0.1% in March quarter 2020. This was driven by the postponement of elective surgeries and reduced face to face visits to medical practitioners in the wake of the COVID-19 pandemic.

Household saving ratio driven by non-labour income

The household saving to income ratio rose to 5.5%, up from 3.5% in the December quarter, reflecting a rise in gross disposable income and falls in consumption. Gross disposable income was driven by a 6.2% increase in social assistance benefits due to both an increase in the number of recipients and the introduction of new support packages in response to COVID-19 and bushfires. Non-life insurance claims increased 11.1% as a result of bushfires and hailstorms events in the quarter. Household saving is now at the highest rate since September 2016.

Expenditure chain volume measures

   Seasonally adjusted
   % Change% Change% points contribution to
   Dec 19 toMar 19 togrowth in GDP
   Mar 20Mar 20Dec 19 to Mar 20
Final consumption expenditure   
 General government1.86.20.3
 Households-1.1-0.2-0.6
 Total final consumption expenditure-0.41.4-0.3
Gross fixed capital formation   
 Private   
  Dwellings-1.7-9.7-0.1
  Ownership transfer costs-17.0-
  Non-dwelling construction0.3-5.7-
  Machinery and equipment-1.6-3.8-0.1
  Cultivated biological resources3.8-5.7-
  Intellectual property products-0.16.2-
 Public-0.72.1-
 Total gross fixed capital formation-0.8-2.4-0.2
Changes in inventories na na-0.2
Gross national expenditure-0.70.2-0.7
Exports of goods and services-3.5-2.0-0.8
Imports of goods and services-6.2-7.71.3
Statistical discrepancy (E) na na-0.1
Gross domestic product-0.31.4-0.3

- nil or rounded to zero (including null cells)
na not available
 

March quarter

Final consumption expenditure (FCE) -0.4%

Household FCE decreased 1.1%, this was driven by a:

  • 9.2% fall in hotels, cafes and restaurants
  • 12.0% decrease in transport services
  • 8.9% fall in clothing and footwear
     

General government FCE partly offset the decrease with a rise of 1.8%, driven by a:

  • 1.9% increase in state and local general government
  • 1.6% rise in national general government, with increases in both non-defence (1.7%) and defence expenditure (1.1%)
     

Gross fixed capital formation (GFCF) -0.8%

Private investment fell 0.8%, driven by a:

  • 1.7% decrease in dwellings
  • 1.6% decrease in machinery and equipment
     

Non-dwelling construction partly offset the fall, increasing 0.3%.

Public investment fell 0.7%, driven by a:

  • 3.1% decrease in general government
     

Public corporations GFCF partly offset the fall, increasing 7.5%.

Changes in inventories

Total inventories decreased $909m following a decrease of $7m last quarter. The largest contributors to the decrease were a:

  • $931m run down of Manufacturing inventories
  • $453m fall in Retail inventories
  • $376m decrease in Wholesale inventories
     

The increase was partly offset by a build up in Public authorities inventories of $1,153m.

Exports and imports of goods and services

Exports of goods and services fell 3.5%, driven by:

  • 19.9% fall in travel services
  • 10.0% fall in non-monetary gold
  • 1.8% fall in mineral ores
  • 6.0% fall in machinery
     

Imports of goods and services fell 6.2%, driven by:

  • 22.8% fall in travel services
  • 10.3% fall in capital goods

Income at current prices

  Seasonally adjusted
  % Change% Change% points contribution to
  Dec 19 toMar 19 togrowth in GDP
  Mar 20Mar 20Dec 19 to Mar 20
Compensation of employees0.54.20.3
Gross operating surplus   
 Private non-financial corporations0.73.90.1
 Other(a)1.12.50.1
Gross mixed income-0.6-4.1-
Taxes less subsidies on production and imports1.54.10.1
Statistical discrepancy (I)nana0.1
Gross domestic product0.83.10.8

- nil or rounded to zero (including null cells)
na not available
a. Includes Public non-financial corporations Financial corporations General government and Dwellings owned by persons.
 

March quarter

Gross operating surplus (GOS) +0.9%

Private non-financial corporations GOS increased 0.7%, driven by a:

  • rise in Mining, reflecting strength in key commodity prices
  • rise in Retail Trade reflecting the increase in household purchases of food, household items and home office equipment
     

Other sectors GOS rose 1.1%, driven by a:

  • 1.5% rise in financial corporations
  • 2.0% rise in public non-financial corporations
  • 1.4% rise in general government
     

Compensation of employees (COE) +0.5%

Twelve of the nineteen industries recorded growth, driven by a:

  • 1.6% rise in Professional, Scientific and Technical Services, due to increased demand for computer consultancy services
  • 1.7% rise in Public Administration and Safety, due to increased demand for front line services and bushfire recovery assistance
  • 0.9% rise in Health Care and Social Assistance as staffing levels were increased in preparedness for COVID-19
     

All states and territories recorded growth. The largest increases were:

  • 1.7% rise in the Australian Capital Territory
  • 0.7% rise in Queensland
     

Production chain volume measures

 Seasonally adjusted
 % Change% Change% points contribution to
 Dec 19 toMar 19 togrowth in GDP
 Mar 20Mar 20Dec 19 to Mar 20
Agriculture forestry and fishing-2.1-10.1-
Mining-1.04.1-0.1
Manufacturing2.12.60.1
Electricity gas water and waste services-1.7-2.4-
Construction-0.5-3.7-
Wholesale trade1.50.30.1
Retail trade1.71.70.1
Accommodation and food services-7.5-5.2-0.2
Transport postal and warehousing-4.9-3.3-0.2
Information media and telecommunications0.32.5-
Financial and insurance services1.22.20.1
Rental hiring and real estate services-1.72.3-0.1
Professional scientific and technical services1.54.80.1
Administrative and support services-3.7-3.2-0.1
Public administration and safety1.45.90.1
Education and training0.42.1-
Health care and social assistance-0.16.1-
Arts and recreation services-2.4-2.5-
Other services-4.2-3.2-0.1
Ownership of dwellings0.62.4-
Taxes less subsidies on products-0.50.3-
Statistical discrepancy (P)nana-
Gross domestic product-0.31.4-0.3

- nil or rounded to zero (including null cells)
na not available
 

March quarter

Agriculture, forestry and fishing -2.1%

This decrease was driven by a:

  • 2.4% fall in Agriculture driven by reduced livestock and grain crop output
  • 0.4% fall in Forestry and Fishing
     

The result was partly offset by a rise in other crops and a fall in input costs.

Mining -1.0%

This decrease was driven by a:

  • 4.7% fall in Coal Mining, with production disruptions from adverse weather conditions
     

Partly offset by a:

  • 2.6% rise in Iron Ore Mining
     

Manufacturing +2.1%

The rise was driven by a:

  • 8.1% rise in Petroleum, Coal, Chemical and Rubber Product Manufacturing driven by cleaning and disinfectant products
  • 5.2% rise in Metal Products Manufacturing driven by demand for primary metal products
  • 0.5% rise in Other Manufacturing driven by Pulp, Paper and Converted Paper products with increased production of toilet paper and hand towels
     

Construction -0.5%

The decline was driven by a:

  • 1.3% fall in Heavy and Civil Engineering Construction driven by weaker demand from the public sector
  • 1.0% fall in Building Construction, reflecting ongoing weaknesses in both residential and non-residential building construction
     

Wholesale trade +1.5%

The increase was driven by:

  • Machinery and Equipment Wholesaling, reflecting demand for home office equipment and electronic goods
  • Other goods wholesaling due to an increase in demand for pharmaceutical and toiletry products
     

Retail trade +1.7%

The increase was driven by:

  • Food Retailing due to households stockpiling non-perishable food products and alcoholic beverages
  • Other Retailing due to increase in demand for pharmaceutical and toiletry products
     

Accommodation and food services -7.5%

The decline was driven by:

  • a fall in Food and Beverage Services, reflecting impacts of bushfires, smoke haze and COVID-19
  • a fall in Accommodation due to a reduction in overseas and domestic travel as a result of the bushfires and COVID-19 related travel bans
     

Transport, postal and warehousing -4.9%

The decline was driven by a:

  • 14.6% fall in Air and Space Transport driven by reduced international and domestic travel
  • 5.3% fall in Transport, Postal and Storage Services driven by a large fall in transport support services, particularly in the operation of airports
  • 3.5% fall in Rail, Pipeline and Other Transport due to a fall in passenger rail patronage on both metro and suburban services.
     

Information media and telecommunications +0.3%

Telecommunication Services rose 0.9% driven by increased household consumption. A reduction in broadcasting, motion picture and sound recording activities partly offset the rise.

Financial and insurance services: +1.2%

The increase was driven by a:

  • 1.0% rise in Finance, reflecting strength in loan and deposit balances, largely from private non-financial corporations
  • 1.6% rise in Other financial and insurance services
     

Professional, scientific and technical services +1.5%

The increase was driven by a:

  • 2.0% rise in Computer System Design and Related Services, with increased demand for IT services
  • 1.3% rise in Other Professional, Scientific and Technical Services driven by increases in medical research and engineering services
     

Health care and social assistance -0.1%

Private health services drove the fall with postponement of elective surgeries and reduced face to face visits to medical practitioners in the wake of the COVID-19 pandemic. The industry remains up 6.1% through the year.

State final demand chain volume measures

  Seasonally adjusted, % change from Dec 19 to Mar 20
  NSWVic.QldSAWATas.NTACTAust.(a)
Final consumption expenditure         
 General government1.83.30.50.9-0.10.20.94.51.8
 Households-1.6-1.2-0.5-1.5-1.0-0.9-0.60.5-1.1
Gross fixed capital formation         
 Private-3.5-1.1-0.1-2.35.25.4-7.9-1.7-0.8
 Public-4.83.4-2.5-0.66.86.6-1.61.0-0.7
State final demand-1.5-0.1-0.3-1.00.90.6-1.22.1-0.5

- nil or rounded to zero (including null cells)
a. Australia estimates relate to Domestic final demand.
 

March quarter

State final demand, quarterly volume measures - seasonally adjusted

Image: State final demand, quarterly volume measures: seasonally adjusted
The image is a map of Australia by state/territory showing quarterly volume measures; New South Wales' state final demand decreased 1.5% for the quarter. Victoria's state final demand decreased 0.1% for the quarter. Queensland's state final demand decreased 0.3% for the quarter. South Australia's state final demand decreased 1.0% for the quarter. Western Australia's state final demand decreased 1.2% for the quarter. Tasmania's state final demand increased 0.6% for the quarter. Northern Territory's state final demand decreased 1.2% for the quarter. Australian Capital Territory's state final demand increased 2.1% for the quarter.

New South Wales -1.5%

Total final consumption expenditure decreased 0.8%, due to a:

  • 1.6% fall in household consumption reflecting decreased expenditure on transport services, hotels, cafes and restaurants, and clothing and footwear partly offset by an increase in food and alcoholic beverages
     

Partly offset by a:

  • 1.8% increase in government consumption reflecting increased expenditure in response to the bushfires and COVID-19 pandemic
     

Private gross fixed capital formation decreased 3.5%, driven by a:

  • 11.4% fall in new building construction following project completions, and subdued work on recently commenced projects
  • 12.0% fall in new engineering construction due to reduced work on major road projects
  • 4.5% fall in dwelling investment reflecting continued weakness in dwelling approvals
     

Public gross fixed capital formation decreased 4.8%, driven by a:

  • 4.4% fall in general government investment across all levels of government
  • 6.0% fall in public corporations reflecting reduced investment in telecommunications and transport
     

Victoria -0.1%

Private gross fixed capital formation decreased 1.1%, driven by a:

  • 4.8% fall in machinery and equipment reflecting aircraft and office equipment purchases last quarter
  • 1.2% fall in dwellings reflecting continued weakness in approvals
     

Household final consumption expenditure decreased 1.2%, driven by a:

  • 11.2% fall in clothing and footwear
  • 8.4% fall in hotels, cafes and restaurants due to lockdown related to COVID-19 and bushfires
     

Public gross fixed capital formation increased 3.4%, driven by a:

  • 5.9% rise in state and local general government reflecting ongoing investment in road infrastructure
  • 2.7% rise in state and local public non-financial corporations reflecting increased investment in sewerage infrastructure
     

Government final consumption expenditure increased 3.3%, driven by a:

  • 4.4% rise in state and local with spending on bushfire recovery and vocational education expenses
  • 1.8% increase in national non-defence consumption expenditure reflecting a decrease in sales of education services
     

Queensland -0.3%

Total final consumption expenditure decreased 0.2% due to a:

  • 0.5% fall in household consumption expenditure with decline in spending on services and partly offset by an increase in food
  • 0.5% rise in government consumption expenditure driven by increased Commonwealth spending in response to bushfires and the COVID-19 pandemic
     

Public gross fixed capital formation decreased 2.5%, driven by a:

  • 3.1% decrease in general government investment in buildings and state and local investment in infrastructure
     

Private gross fixed capital formation decreased 0.1%, due to a:

  • 4.4% fall in non-dwelling construction reflecting reduced investment in engineering construction and subdued new building commencements
     

Partly offset by a:

  • 3.2% rise in purchases of machinery and equipment
  • 2.2% rise in dwelling construction with increased spending on alterations and additions due to repair works related to hailstorms on the Sunshine Coast
     

South Australia -1.0%

Household final consumption expenditure decreased 1.5%, driven by a:

  • 10.1% fall in hotels, cafes and restaurants with falls across all components reflecting the impacts of COVID-19 on the industry
     

Private gross fixed capital formation decreased 2.3%, driven by a:

  • 14.1% fall in machinery and equipment with reduced purchases of trucks, aircrafts and other machinery
  • 1.8% fall in dwellings reflecting less work done on alterations and additions
     

Public gross fixed capital formation decreased 0.6%, driven by a:

  • 12.5% fall in commonwealth public non-financial corporations
  • 41.0% fall in state and local general government reflecting an asset sale which occurred last quarter. Without the impact of this sale, general government investment in new assets rose
     

Government final consumption expenditure increased 0.9%, driven by a:

  • 2.2% increase in state and local government in response to bushfires and subsequent local tourism campaigns to aid recovery
     

Western Australia 0.9%

Private gross fixed capital formation increased 5.2%, due to a:

  • 14.6% rise in non-dwelling construction reflecting increased mining investment
     

Partly offset by a:

  • 4.7% fall in dwelling construction led by a fall in alterations and additions
     

Public gross fixed capital formation increased 6.8%, driven by a:

  • 26.3% rise in state and local public non-financial corporations driven by vehicle purchases and investment in rail infrastructure
  • 6.4% rise in state and local general government
     

Total final consumption expenditure decreased 0.7%, driven by a:

  • 1.0% decrease in household consumption reflecting falls in hotels, cafes and restaurants, transport services, and clothing and footwear
  • 0.1% decrease in government consumption due to a 0.4% fall in state and local government consumption
     

Tasmania increased 0.6%

Private gross fixed capital formation increased 5.4%, driven by a:

  • 24.8% increase in machinery and equipment reflecting purchases of buses and trucks
  • 7.2% increase in dwelling investment reflecting continued demand for houses
     

Public gross fixed capital formation increased 6.6%, driven by a:

  • 18.1% rise in state and local public non-financial corporations reflecting increased investment in utilities
  • 7.1% rise in national general government reflecting increased investment in machinery and equipment
     

Government final consumption expenditure increased 0.2%, driven by a:

  • 1.0% increase in national non-defence reflecting additional commonwealth spending on COVID-19 and bushfire responses
     

Household final consumption expenditure decreased 0.9%, driven by a:

  • 7.6% fall in hotels, cafes and restaurants reflecting lockdown related to COVID-19
     

Northern Territory -1.2%

Private gross fixed capital formation decreased 7.9%, driven by a:

  • 20.1% fall in intellectual property products reflecting decreased petroleum exploration
  • 9.0% fall in non-dwelling construction reflecting reduced mining investment
  • 11.4% fall in machinery and equipment
     

Public gross fixed capital formation decreased 1.6%, driven by a:

  • 16.4% fall in state and local public corporations
     

Total final consumption expenditure was flat, due to a:

  • 0.9% rise in government consumption expenditure reflecting increased spending by Commonwealth and state and local governments
     

Offset by a:

  • 0.6% fall in household consumption expenditure driven by reduced spending on hotels, cafes and restaurants
     

Australian Capital Territory 2.1%

Government final consumption expenditure increased 4.5%, driven by a:

  • 4.5% increase in national non-defence consumption expenditure reflecting additional commonwealth spending on bushfire and COVID-19 responses
  • 5.0% increase in state and local reflecting increased transport and bushfire related spending
     

Household final consumption expenditure increased 0.5%, driven by a:

  • 53.4% rise in purchase of vehicles reflecting increased demand following a significant hail storm
  • 4.8% rise in food as households prepared for lockdown measures
     

Public gross fixed capital formation increased 1.0%, driven by a:

  • 31.3% rise in state and local public non-financial corporations investment in water infrastructure
     

Private gross fixed capital formation decreased 1.7%, driven by a:

  • 25.6% fall in machinery and equipment after extensive purchases of computer equipment in December quarter 2019
     

Partly offset by a:

  • 6.7% increase in non-dwelling construction reflecting increased investment in offices and telecommunications infrastructure

COVID-19 stringency measures impact the economy

The COVID-19 pandemic, combined with the imposition of restrictions on the free movement of people by governments around the world, has generated an unprecedented shock to the global economy. One way to quantify the stringency of governments' containment measures is via the Oxford COVID-19 Government Response Tracker, which aggregates each country's containment measures into a single stringency index.

As part of its March quarter GDP release, the UK’s Office of National Statistics published analysis on the relationship between the stringency index and growth in GDP. Figure 1 shows the resulting negative relationship, as countries with more stringent responses reported larger falls in GDP.

  1. relationship between stringency index and GDP growth

Note: Data current as at 28 May, 2020. GDP data from: https://data.oecd.org/gdp/quarterly-gdp.htm


The containment measures in Australia over the March quarter resulted in an average stringency index of 19.

Restrictions were placed on some international travel from the 1st February. As the pandemic progressed, containment measures expanded, eventually culminating at the end of the quarter with the closure of non-essential services, restrictions on gatherings, and several states declaring schools pupil-free.

The biggest impacts observed across the Australian economy were:

  • Household spending on transport services fell 12.0% and on hotels, cafes and restaurants fell 9.2%, detracting a combined 0.6 percentage points from domestic final demand (-0.5%)
  • Production of the accommodation and food services, and transport, postal and warehousing industries fell 7.5% and 4.9%, detracting 0.4 percentage points from GDP
  • Commensurate falls were seen in the gross operating surplus of these industries, falling 14.2% and 6.8%
     

Hours worked in the national accounts

The shutdown of non-essential services and trading restrictions due to COVID-19 occurred late in the March quarter. This economic shock affected the demand for goods and services of many businesses, resulting in changes to business practices and consequently a reduction in hours worked.

Hours worked is the key measure of labour input into the economy. A fall in average hours worked in a quarter may lead to lower production and therefore gross domestic product. The hours worked data presented in the National Accounts is collected in the ABS monthly Labour Force Survey.

Changes to the hours worked estimate

There was a sizeable fall in hours worked in the last week of March as strict COVID-19 restrictions were implemented. An estimate of hours worked in the final week of the March quarter was derived using the hours worked in both the March and April Labour Force Surveys, supplemented with industry information from Single Touch Payroll (STP) data. This estimate has been incorporated in the national accounts and will also be incorporated in the upcoming labour accounts release.

National accounts estimate of hours worked

Hours worked fell 0.8% in the March quarter, with significant impacts on key national accounts aggregates including GDP per hour worked and unit labour costs.

With the decline in hours worked greater than the decline in GDP, the result was 1.4% growth in GDP per hour worked through the year.

A rise in GDP per hour worked, equivalent to a rise in labour productivity, could be a consequence of an increased capital contribution or to a compositional change in activity. In this context, it is also of interest to examine unit labour costs, the average cost of labour per unit of output produced in the economy.

Unit labour costs

Unit labour costs (ULC) slowed to 2.4 per cent through the year, indicating growth in average labour productivity (GDP per hour worked) outpaced average cost of labour. Historically, a steep decline in hours worked and associated economic downturn (for example, in 1990-91 and 2008-09), tend to coincide with a decline in the ULC.

Bushfires in the national accounts

Australia recently experienced unprecedented bushfire disasters, both in duration and geographic spread. The bushfires and associated smoke haze affected many Australians over the past six months, with disruption of economic activity and demand for additional services most evident in the March quarter 2020.

Government spending on natural disaster relief

The Australian Defence Force were deployed to clear roads, repair damaged infrastructure, assist bushfire coordination and evacuate areas isolated by bushfires. The 1.1% increase in total spending on national defence is partly driven by this increase in defence activity.

The National bushfire recovery agency was established to coordinate bushfire relief and administer the initial $2 billion allocation for the bushfire recovery fund. The 1.7% increase in national non-defence government expenditure is partly driven by the activity of this recovery agency.

Total state and local government expenditure increased 1.9%, with contributions by Victoria and NSW to the bushfire response.

Regional food sales decline

Tourism-related activity such as domestic travel, accommodation and food services declined in the affected areas. The fall in the number of people visiting regional areas and supply chain disruptions due to the bushfires, are evident in the scanner data for food in regional areas.

Food sales were stronger in capital cities than they were in regional areas across all of the states and territories that have significant regional populations, particularly New South Wales and Victoria.

Insurance claims for loss of assets in the bushfire

Over 2,000 dwellings were destroyed in the fires. The economic activity associated with rebuilding destroyed or damaged dwellings as well as commercial buildings and infrastructure will be reflected in upcoming quarters. The most notable impact this quarter are the insurance claims attributed to the loss of assets, with a $1.4 billion increase paid to households, due to natural disasters.

Insights into household income

Household gross disposable income increased 3.8% through the year in the March quarter 2020, below the 20-year average of 5.8%, reflecting:

  • Sustained low wage growth over recent years that has been reflected in subdued compensation of employees (COE) which increased 4.4% through the year.
  • Steady growth in social assistance benefits, prior to the COVID-19 outbreak, due to the stable labour market, low unemployment and increased retirement income streams from superannuation accounts.
  • Individuals' tax payable driving a rise in income payable in recent years with tax outpacing income growth as a result of Australia’s progressive tax system. Growth in tax payable by individuals slowed through the year with the introduction of the low to middle income tax offset in September quarter 2019.
  • Other non-labour income (consisting of investment income and earnings from unincorporated businesses) experiencing weak growth in recent years.
     

Quarterly composition of household income

Household gross disposable income rose 1.4% in March quarter 2020. Social assistance benefits contributed 0.6 percentage points to growth, recording its largest contribution since June 2012. The increase in both the number of recipients and COVID-19 government support payments drove the rise.

At the same time, growth in compensation of employees slowed with reduced economic activity as economic restrictions were imposed to contain the COVID-19 pandemic.

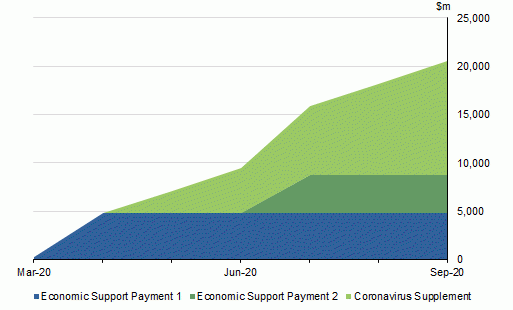
Social assistance benefits are expected to rise after the March quarter, with an increased number of recipients (figure 11) and further commitments by Government to provide support during the COVID-19 pandemic (figure 12).

Figure 12 - Government commitments to COVID-19 support

Figure 12 - Government commitments to COVID-19 support
Government support payments in response to the COVID-19 pandemic include Economic support payment 1, Economic support payment 2 and the Coronavirus supplement. Economic support payment 1 is estimated to total $4.8b with payments contributing to household income from March quarter. Economic support payment 2 is estimated to total $4.0b and will start to contribute to household income in September quarter. The coronavirus supplement payments will start to contribute in June quarter.

Government support payments in response to COVID-19 will contribute to household income beyond the March quarter with, for example, an additional 470,000 people received social benefit payments in April 2020.

COVID-19 impacts on health activity

There have been notable impacts on health activity from COVID-19 during the March quarter that can be seen across measures in the National Accounts.

Government response to managing health crisis

Australian governments worked to ensure that the health system could cope with the escalating COVID-19 outbreak. Additional funding was allocated to boost emergency response and intensive care capabilities, as well as shifting resources away from elective surgeries, to increase hospital capacity for a predicted surge in coronavirus cases.

The National Medical Stockpile was boosted significantly with purchases of medical supplies such as pharmaceuticals, personal protective equipment (PPE) and respirators.

Governments also expanded frontline services with additional call centres and helplines, pop-up testing clinics, as well as significant advertising and training programs. These were part of the Government’s $2.4 billion health package to protect Australians from COVID-19.

Total Government Final Consumption Expenditure (GFCE) increased 1.8%, with this spending across all levels of government in part reflecting the range of Government measures to manage COVID-19.

Household consumption behaviour in response to COVID-19

Total health spending by households fell 1.6% in the March quarter, with health services falling 5.3% partly offset by a 5.4% rise in spending on medicines, medical aids and therapeutic appliances.

Social distancing measures led to the reduction in demand for health services that involved face to face interactions, including general practice and allied services such as physiotherapy, dental and optical.

Conversely, spending on medicines, medical aids and therapeutic appliances surged as households prepared for the introduction of lockdown measures. Households stockpiled health goods such as pharmaceutical products and health supplements.

Output of the health industry

Health care and social assistance output fell 0.1% during the quarter, the weakest result since December 2011. Private health care fell due to the cancellation of elective surgeries and reduced demand in allied health. Public health care rose reflecting a range of government measures to increase frontline services and boost hospital capacity in response to COVID-19.

Household consumption behaviour in response to COVID-19

Household consumption decreased 1.1% in the March quarter and 0.2% through the year. These falls were last observed during the global financial crisis.

The decrease in household spending was driven by a 2.4% fall in services consumption for the March quarter, partly offset by an increase in goods consumption of 1.0%.

Changes in household spending behaviour

There were impacts on household consumption expenditure from both the bushfires and COVID-19. Early in the March quarter, bushfires and associated smoke haze led to disruptions to domestic travel and reduced retail foot traffic. This was followed by escalating concerns about the spread of COVID-19 that led to restrictions on overseas travel, bans on indoor and outdoor gatherings and domestic travel, increased work and leisure from home, and limits on business trading.

Household consumption of services

There were significant impacts on household spending on services due to COVID-19 social distancing measures.

  • Travel disruptions, reduced foot traffic and bushfires drove a large fall in hotels, cafes and restaurants, with falls across both catering services and accommodation services categories.
  • Reduced demand for travel and stay-at-home measures led to a decrease in transport services, particularly air passenger services.
  • Social distancing measures and the deferral of elective medical procedures resulted in a reduced demand for health services.
  • Restrictions on indoor and outdoor gatherings had a major impact on recreational and cultural services, particularly on gambling activity, sporting services and cinema admissions.
     

Household consumption of goods

Household expenditure on goods rose as people prepared for the possibility of an extended period at home.

  • Food spending increased significantly at both supermarkets and specialised food retailers, particularly in non-perishable food categories.
  • Households stocked up on pharmaceutical supplies, with increased spending on medicines, medical aids and therapeutic appliances.
  • Furnishings and household equipment purchases increased, led by tools and appliances as well as cleaning products.
  • Household purchases of recreation and culture goods increased with demand for audio-visual equipment, laptops and computers, as well as sporting equipment.
     

Recent and upcoming releases

Australian National Accounts: Input-Output Tables (cat. no. 5209.0.55.001)

The 2017-18 issue of Australian National Accounts: Input-Output Tables was released on 29 May 2020. This product provides detailed information about the supply and use of products in the Australian economy and the structure of, and inter-relationships between, Australian industries. It presents information on input by industry and output by product group, use of domestic production, imports by industry and final demand categories, taxes and margins on supply by product, and industry and product concordances.

Economic measurement during COVID-19: Selected issues in the Economic Accounts, May 2020 (cat. no. 5261.0)

A series of notes titled Economic measurement during COVID-19: Selected issues in the Economic Accounts was released on 18 May 2020. This publication describes economic measurement within National Accounts, Balance of Payments and International Investment Position and Government Finance Statistics.

Read more

Inquiries

For further information about these and related statistics, contact the National Information and Referral Service on 1300 135 070 or National Accounts by email national.accounts@abs.gov.au.

Data downloads

Table 1. Key national accounts aggregates

Table 2. Expenditure on gross domestic product (GDP), chain volume measures

Table 3. Expenditure on gross domestic product (GDP), current prices

Table 4. Expenditure on gross domestic product (GDP), chain price indexes

Table 5. Expenditure on gross domestic product (GDP), implicit price deflators

Table 6. Gross value added by industry, chain volume measures

Table 7. Income from gross domestic product (GDP), current prices

Table 8. Household Final Consumption Expenditure (HFCE)

Table 9. Changes in inventories

Table 10. Agricultural income, current prices

Table 11. National income account, current prices

Table 12. National capital account, current prices

Table 13. Non-financial corporations income account, current prices

Table 14. Private non-financial corporations income account, current prices

Table 15. Public non-financial corporations income account, current prices

Table 16. Financial corporations income account, current prices

Table 17. General government income account, current prices

Table 18. National general government income account, current prices

Table 19. State and local general government income account, current prices

Table 20. Household income account, current prices

Table 21. External account, current prices

Table 22. Taxes, current prices

Table 23. Social assistance benefits payments, current prices

Table 24. Selected analytical series

Table 25. State final demand, summary components by state: chain volume measures

Table 26. State final demand, detailed components: New South Wales

Table 27. State final demand, detailed components: Victoria

Table 28. State final demand, detailed components: Queensland

Table 29. State final demand, detailed components: South Australia

Table 30. State final demand, detailed components: Western Australia

Table 31. State final demand, detailed components: Tasmania

Table 32. State final demand, detailed components: Northern Territory

Table 33. State final demand, detailed components: Australian Capital Territory

Table 34. Key aggregates and analytical series, annual

Table 35. Income from GDP and changes in inventories, annual

Table 36. Expenditure on gross domestic product (GDP), chain volume measures and current prices, annual

Table 37. Industry gross value added, chain volume measures, annual

Table 38. National income account, current prices, annual

Table 39. National capital account, current prices, annual

Table 40. External account, current prices, annual

Table 41. Indexes of industrial production

Table 42. Unit labour costs

Table 43. Indexes of industrial production, annual

Table 44. Compensation of employees, state by sector: current prices

Table 45. Gross value added by industry, current prices

All time series workbooks

History of changes

Show all

Back to top of the page