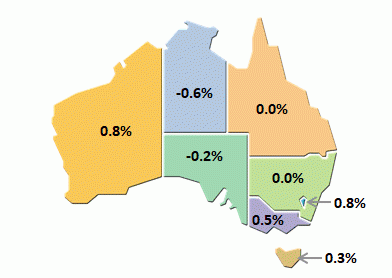
June key figures
| Seasonally adjusted, percentage change (a) | ||||||||
|---|---|---|---|---|---|---|---|---|
| Mar 18 to Jun 18 | Jun 18 to Sep 18 | Sep 18 to Dec 18 | Dec 18 to Mar 19 | Mar 19 to Jun 19 | Jun 18 to Jun 19 | |||
| Chain volume GDP and related measures (b) | ||||||||
| GDP | 0.7 | 0.3 | 0.1 | 0.5 | 0.5 | 1.4 | ||
| GDP per capita (c) | 0.3 | -0.1 | -0.2 | 0.1 | - | -0.2 | ||
| Gross value added market sector (d) | 0.9 | -0.2 | -0.2 | 0.7 | 0.3 | 0.6 | ||
| Real net national disposable income | 0.1 | 0.3 | 1.2 | 1.3 | 1.4 | 4.4 | ||
| Productivity | ||||||||
| GDP per hour worked | -0.5 | - | -0.3 | -0.3 | 0.4 | -0.2 | ||
| Real unit labour costs | -0.4 | 0.1 | 0.1 | -0.8 | 0.3 | -0.4 | ||
| Prices | ||||||||
| Terms of trade | -1.3 | 1.1 | 3.0 | 3.1 | 1.4 | 8.9 | ||
| Current price measures | ||||||||
| GDP | 1.0 | 1.2 | 1.2 | 1.6 | 1.2 | 5.4 | ||
| Household saving ratio | 3.2 | 2.5 | 2.7 | 3.0 | 2.3 | na | ||
na not available
a. Change on preceding quarter, except for the last column which shows the change between the current quarter and the corresponding quarter of the previous year. Excludes Household saving ratio.
b. Reference year for chain volume measures and real income measures is 2016-17.
c. Population estimates are as published in the Australian Demographic Statistics (cat. no. 3101.0) and ABS projections.
d. ANZSIC divisions A to N, R and S. See Glossary - Market sector.
Revisions in this issue
There are revisions in this issue due to the incorporation of more up-to-date data and concurrent seasonal adjustment.
