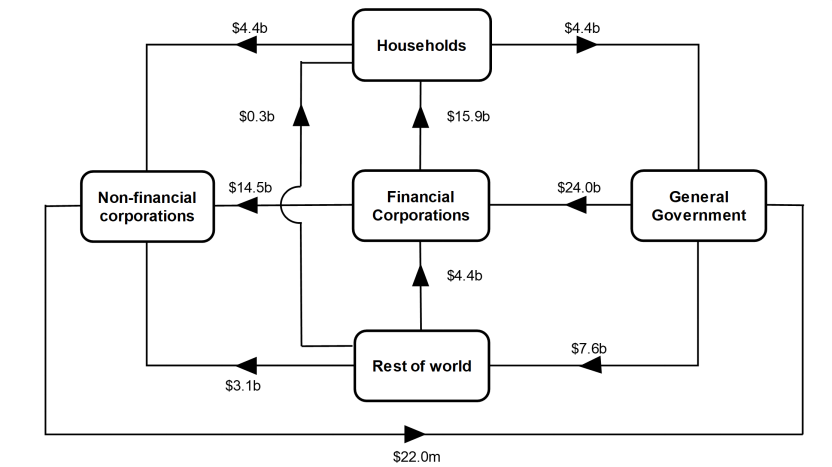
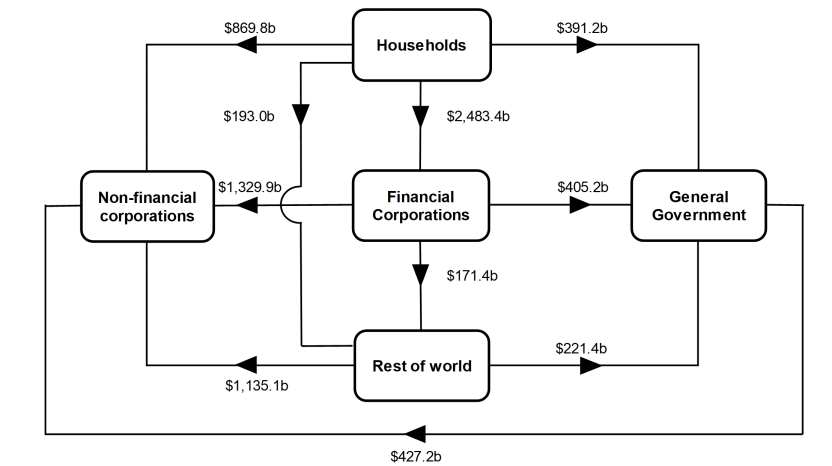
Change in authorised deposit taking institutions' liabilities
[["Jun-10","Sep-10","Dec-10","Mar-11","Jun-11","Sep-11","Dec-11","Mar-12","Jun-12","Sep-12","Dec-12","Mar-13","Jun-13","Sep-13","Dec-13","Mar-14","Jun-14","Sep-14","Dec-14","Mar-15","Jun-15","Sep-15","Dec-15","Mar-16","Jun-16","Sep-16","Dec-16","Mar-17","Jun-17","Sep-17","Dec-17","Mar-18","Jun-18","Sep-18","Dec-18","Mar-19","Jun-19","Sep-19","Dec-19","Mar-20","Jun-20","Sep-20","Dec-20","Mar-21","Jun-21","Sep-21","Dec-21","Mar-22","Jun-22","Sep-22","Dec-22","Mar-23","Jun-23"],[[7.2000000000000002],[34.700000000000003],[-2],[37.899999999999999],[0.10000000000000001],[75.700000000000003],[-19.199999999999999],[27.800000000000001],[57.299999999999997],[61.899999999999999],[31.199999999999999],[42.899999999999999],[92.700000000000003],[56],[101.7],[37.200000000000003],[59.700000000000003],[72.099999999999994],[146.30000000000001],[177.09999999999999],[-71.799999999999997],[114],[53.100000000000001],[-8.1999999999999993],[78.5],[2.2999999999999998],[120.2],[-24.399999999999999],[36.200000000000003],[-16.800000000000001],[47.399999999999999],[36.600000000000001],[55],[13.800000000000001],[10.6],[43.299999999999997],[127.09999999999999],[119.40000000000001],[-86.099999999999994],[338.5],[-100.5],[-77],[94.900000000000006],[6.9000000000000004],[58.700000000000003],[143.59999999999999],[90.799999999999997],[170.5],[206.19999999999999],[226.80000000000001],[7.5999999999999996],[-83.299999999999997],[86]],[[40.700000000000003],[49.200000000000003],[26.699999999999999],[39.100000000000001],[24.199999999999999],[63.600000000000001],[-1.6000000000000001],[2.5],[53.100000000000001],[48.299999999999997],[32.399999999999999],[0.90000000000000002],[13.9],[51.200000000000003],[41.299999999999997],[15.699999999999999],[34.899999999999999],[37.399999999999999],[38.5],[43.200000000000003],[8.1999999999999993],[66.900000000000006],[23.399999999999999],[9.5999999999999996],[51.5],[43.200000000000003],[68.400000000000006],[0.90000000000000002],[34.799999999999997],[-0.20000000000000001],[34.600000000000001],[10.199999999999999],[14.199999999999999],[32.5],[2.5],[7.5],[23.600000000000001],[49],[5.7000000000000002],[190.80000000000001],[9.5999999999999996],[68.900000000000006],[3.7000000000000002],[34.200000000000003],[42.100000000000001],[93.799999999999997],[64.599999999999994],[54.799999999999997],[98.599999999999994],[64.900000000000006],[21.100000000000001],[41.600000000000001],[-5.2000000000000002]],[[3.1000000000000001],[-29.300000000000001],[10.9],[6],[-5.7000000000000002],[7.9000000000000004],[3.8999999999999999],[6.2999999999999998],[-5.0999999999999996],[-20.5],[9.3000000000000007],[6.5],[30.699999999999999],[-17.800000000000001],[1.7],[13.699999999999999],[18],[-5.7000000000000002],[19.800000000000001],[11],[9.5],[-2.5],[5.7000000000000002],[-18.399999999999999],[0],[-11.1],[13.9],[1.1000000000000001],[17.100000000000001],[11.1],[-13.5],[11.1],[3.2000000000000002],[-28.899999999999999],[22],[-1.1000000000000001],[-24],[-6.2999999999999998],[21.800000000000001],[-13.1],[-24.800000000000001],[-24.199999999999999],[14.6],[19],[5.2999999999999998],[20.699999999999999],[48.600000000000001],[-11.5],[35.100000000000001],[-4.0999999999999996],[15.699999999999999],[-10],[-3.1000000000000001]],[[13.300000000000001],[-13],[-18.399999999999999],[-5.7000000000000002],[-4.0999999999999996],[24.399999999999999],[-22.800000000000001],[4.2000000000000002],[-2.6000000000000001],[6.5999999999999996],[-16.300000000000001],[-10],[14.6],[6.2000000000000002],[15.199999999999999],[-5],[2.7999999999999998],[16],[18.699999999999999],[11.4],[10.4],[29.699999999999999],[0.90000000000000002],[0.20000000000000001],[13.9],[-12.5],[-7.0999999999999996],[-15.800000000000001],[3.5],[0.69999999999999996],[6.5999999999999996],[26.399999999999999],[9.0999999999999996],[14.9],[4.7999999999999998],[-9.4000000000000004],[12.800000000000001],[6.7000000000000002],[-27.699999999999999],[36.600000000000001],[-38],[-31.399999999999999],[-22],[-29.5],[3.2999999999999998],[-3.6000000000000001],[-4.4000000000000004],[-14.1],[16.5],[5.0999999999999996],[20.699999999999999],[30.899999999999999],[9.5999999999999996]],[[8.6999999999999993],[17.699999999999999],[-17],[-6.2000000000000002],[-5.2000000000000002],[3.5],[4.2000000000000002],[-8.8000000000000007],[22.600000000000001],[-4.7999999999999998],[-10.5],[-5.7999999999999998],[31.899999999999999],[-18.100000000000001],[17.100000000000001],[-3.7999999999999998],[1.3],[37.700000000000003],[44.100000000000001],[40.200000000000003],[-55.799999999999997],[52.100000000000001],[-32],[55.5],[14.1],[-33.700000000000003],[-4.5],[-32.899999999999999],[11.9],[-28],[11.5],[6.5999999999999996],[18.699999999999999],[-9.0999999999999996],[20.600000000000001],[13.9],[58.600000000000001],[52.700000000000003],[-38.299999999999997],[205.90000000000001],[-70],[-54.899999999999999],[35.799999999999997],[-99.599999999999994],[-29.899999999999999],[-11.6],[0.80000000000000004],[95.299999999999997],[152.90000000000001],[151.90000000000001],[-73.5],[-126],[84.599999999999994]],[[-5],[-13.5],[2.1000000000000001],[-2.7999999999999998],[5.7000000000000002],[6.9000000000000004],[-15.1],[2.7999999999999998],[-5.2999999999999998],[0.59999999999999998],[-3.3999999999999999],[0.80000000000000004],[1.8999999999999999],[0.69999999999999996],[5.4000000000000004],[0.69999999999999996],[1.3999999999999999],[9.8000000000000007],[-7.2000000000000002],[1.3],[3.2000000000000002],[7.7999999999999998],[6],[1.1000000000000001],[-2],[-4.4000000000000004],[4.2999999999999998],[-3.7999999999999998],[5.4000000000000004],[-3.2999999999999998],[7.5999999999999996],[5.2999999999999998],[-0.20000000000000001],[5.9000000000000004],[-1.3],[14.1],[10.4],[9.8000000000000007],[-0.90000000000000002],[29.300000000000001],[-15.300000000000001],[-16.100000000000001],[-14.1],[16.800000000000001],[8.1999999999999993],[8.5],[16.399999999999999],[13.4],[-1.6000000000000001],[0.80000000000000004],[-13.5],[-11.5],[2.2000000000000002]],[[-53.5],[23.800000000000001],[-5],[6.5999999999999996],[-14.800000000000001],[-31],[13],[19.399999999999999],[-5.0999999999999996],[30.600000000000001],[19.100000000000001],[50],[-3.7999999999999998],[33],[21.600000000000001],[13.4],[0.69999999999999996],[-22.300000000000001],[31.399999999999999],[65.700000000000003],[-49.200000000000003],[-39.600000000000001],[49.200000000000003],[-58.399999999999999],[-0.69999999999999996],[20.5],[48.5],[26.800000000000001],[-38.700000000000003],[2.5],[4.7999999999999998],[-29.300000000000001],[13.6],[-6],[-33.200000000000003],[12.5],[39.899999999999999],[12.5],[-41.200000000000003],[-130.80000000000001],[44.299999999999997],[-19.899999999999999],[85],[60.200000000000003],[32.100000000000001],[25.300000000000001],[-16.800000000000001],[22.600000000000001],[-96.5],[11.1],[44.399999999999999],[-18.699999999999999],[1]],[[-0.10000000000000001],[-0.20000000000000001],[-1.3],[0.90000000000000002],[-0.10000000000000001],[0.29999999999999999],[-0.80000000000000004],[1.5],[-0.29999999999999999],[1.2],[0.69999999999999996],[0.5],[3.3999999999999999],[0.80000000000000004],[-0.69999999999999996],[2.6000000000000001],[0.59999999999999998],[-0.69999999999999996],[1.1000000000000001],[4.2000000000000002],[1.8],[-0.40000000000000002],[-0.10000000000000001],[2.1000000000000001],[1.7],[0.40000000000000002],[-3.2000000000000002],[-0.80000000000000004],[2.2999999999999998],[0.5],[-4.2000000000000002],[6.4000000000000004],[-3.6000000000000001],[4.5999999999999996],[-4.7999999999999998],[5.7999999999999998],[5.9000000000000004],[-5.0999999999999996],[-5.7000000000000002],[19.899999999999999],[-6.2999999999999998],[0.59999999999999998],[-8.0999999999999996],[5.7000000000000002],[-2.3999999999999999],[10.4],[-18.199999999999999],[9.9000000000000004],[1.2],[-2.8999999999999999],[-7.2000000000000002],[10.5],[-3]]]
[]
[{"value":"0","axis_id":"0","axis_title":"","axis_units":"","tooltip_units":"","table_units":"","axis_min":null,"axis_max":null,"tick_interval":"4","precision":"-1","data_unit_prefix":"","data_unit_suffix":"","reverse_axis":false}][{"value":"0","axis_id":"0","axis_title":"$b","axis_units":"","tooltip_units":"($b)","table_units":"($b)","axis_min":"-300","axis_max":"600","tick_interval":"100","precision":"-1","data_unit_prefix":"","data_unit_suffix":"","reverse_axis":false}]
