Modernising agricultural statistics: Update on achievements and remaining data gaps

An update on the modernisation program the ABS is undertaking on its Agricultural Statistics Program

Released
29/10/2024
ABS, DAFF and ABARES logos

This information paper is a joint publication between the Australian Bureau of Statistics (ABS) and the Australian Bureau of Agricultural and Resource Economics and Sciences (ABARES), a division of the Department of Agriculture, Fisheries and Forestry.

Introduction

Together the ABS and the Australian Bureau of Agricultural and Resource Economics and Sciences (ABARES) have made significant advances in modernising agricultural statistics.

In June this year the ABS released the first set of modernised agriculture statistics produced without running a large survey. 

These statistics were produced in partnership with industry experts through statistical working groups which ABARES played a key role in establishing and running. These working groups underpinned the establishment of data sharing partnerships for a wide range of existing public and private data sources and helped to develop the new methods used to create the modernised agriculture statistics. 

The release of statistics this year was a major milestone however it did not cover the full set of agriculture statistics previously published by the ABS. This paper sets out the current plans for ABS and ABARES to fill the remaining data gaps from past ABS agricultural surveys. 

It also highlights work that ABARES is leading to better understand the broader agricultural statistics ecosystem information needs and governance arrangements.

Background to modernising agricultural statistics

The need to change the way agricultural statistics are produced was first identified in the National Agricultural Statistics Review (NASR), which was jointly undertaken by the ABS and ABARES in 2015. This review identified the following goals:

  • Reduce burden on farmers.
  • Improve quality of statistics including loss of accuracy from declining response rates and reduced coherence with other available data.
  • Improve coordination of the agricultural statistics ecosystem to reduce duplication and better meet information needs.

In March 2023 the ABS released Modernising ABS Agriculture Statistics. This set out changes to the way the ABS would produce agriculture statistics to work within the changing agricultural data ecosystem. These changes included:

  • Ceasing the five yearly Agricultural Census, the annual Rural Environment and Agricultural Commodity Survey (REACS) and the Value of Agricultural Commodity Production (VACP) surveys, partly as a result of declining response rates.
  • Using a range of existing public and private data sources to produce agriculture statistics with greater regional detail and improved timeliness and coherence.
  • Utilising partnerships with government, academia and industry to identify and access data sources and refine new methods for producing statistics.
  • An incremental approach to replace the statistics previously produced from agricultural surveys by 2027, acknowledging that accessing data and developing new methods will take time.

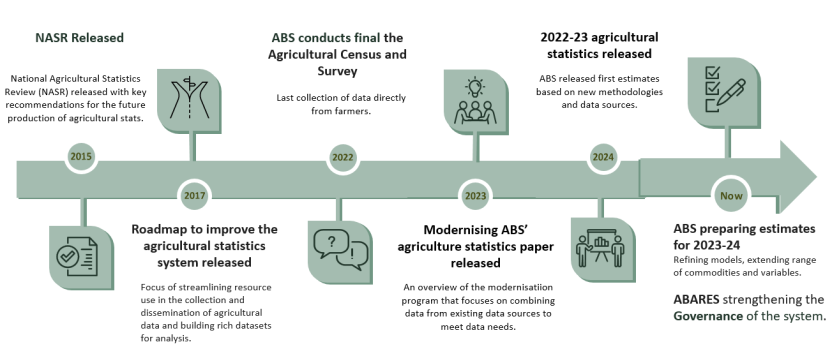
A summary of key developments in modernising agricultural statistics is shown in the diagram below:

Modernisation of agricultural statistics timeline

An infographic of the modernisation timeline from 2015 to the 2024

An infographic of a timeline with milestones for key events between 2015 and 2024. In 2015 the National Agricultural Statistics Review (NASR) was released with key recommendations for the future production of agricultural statistics. In 2017 the Roadmap to improve the agricultural statistics system was released. The roadmap focused on the streamlining of resource used in the collection and dissemination of agricultural data and building rich datasets for analysis. In 2022 the ABS conducted data directly from farmers for the last time. In 2023 the Modernising ABS’ agriculture statistics paper was released. This paper provided an overview of the modernisation program that focuses on combining data from existing data sources to meet data needs. In 2024 the ABS released the first set of estimates based on new methodologies and data sources. The final milestone is for 2024 with the ABS preparing estimates for the 2023-24 reference period, refining the methodology and extending the range of commodities available. ABARES addresses key Governance and Strategy recommendations from the NASR.

Key achievements and remaining data gaps to be filled

In June 2024 the ABS released the first set of modernised agriculture statistics produced without running a large survey. These statistics were released in three separate publications, each focussed on a major part of Australian agriculture:

Significant achievements

Broadacre Crops

The broadacre crop statistics included an improved level of regional detail, Statistical Area Level 2 (SA2), which was previously only available every 5 years. The method for producing these statistics used a combination of satellite crop mapping and levy payer register data that also enabled greater spatial accuracy. These statistics highlighted the importance of broadacre crops to specific regional communities. The ability to produce this detail on an annual basis will support better planning decisions as agriculture adapts to climate, biosecurity and trade challenges.

Horticulture

The horticulture statistics included the state level production and value statistics produced by Hort Innovation which cover the full spectrum of horticultural commodities. Importantly this partnership has removed the inconsistency that previously existed between ABS and Hort Innovation statistics for some commodities. The horticulture statistics also showcased an approach to produce additional statistics about area and business counts as well as regional detail (SA2) though a proof of concept for avocados and macadamias. The partnerships to create these statistics provide a basis for further improving horticulture statistics which are challenging because of the small size and diversity of commodities within the sector.

Livestock

The livestock statistics included value and production statistics for all the major livestock commodities except eggs. Most significantly the statistics also included updated cattle herd counts at the national and state levels using a new demographic model. This model addressed the past inconsistencies between cattle herd sizes and the annual slaughter statistics.

Remaining data gaps

The modernisation of agricultural statistics has always been planned to be addressed in an incremental way due to the diversity of agricultural commodities and the range of variables reported in the previous statistics.

ABS and ABARES are partnering to fill these remaining data gaps using existing data sources to develop new methods according to their areas of expertise. ABS is leading the production, value and business count statistics for agricultural commodities while ABARES is leading the agricultural land and water use statistics.

Remaining data gaps are summarised below. More detail about these including plans to address the gaps is provided in the Agricultural Statistics Modernisation Timetable.

Broadacre
  • Cotton statistics (production, value and business count).
  • Hay and silage statistics (production, value, area, and business count).
  • Other minor broadacre crop statistics (production, value, area, and business count).
  • Measures of yield and total production for crops where significant volumes are not sold through the levy system, for example, oats.
Horticulture
  • Regional detail (SA2), area and business count statistics for the most significant horticulture crops.
Livestock
  • Sheep, pig and poultry livestock counts.
  • Egg value and production statistics.
  • Regional statistics for livestock counts, value, and production.
  • Livestock business counts.
Agricultural Businesses
  • Total count of agricultural businesses.
Agricultural Land Use
  • Total area of agricultural holdings.
  • Breakups of agricultural land use types such as cropping, horticulture and grazing and non-agricultural uses.
Agricultural Water Use
  • Total agricultural water use (irrigated area, volume and value).
  • Breakups of water use by major irrigated commodities.

Partnerships and new data sources supporting agriculture statistics

Statistical Working Groups

An important component of the success in developing new methods that use existing data sources to produce agriculture statistics has been the development of statistical working groups.

ABARES in partnership with the ABS and the major industry research and development corporations has led the development of separate working groups for broadacre crops, livestock and horticulture.

The working groups are made up of representatives from industry groups, state/territory governments, grower representatives and academia and they have helped to:

  • Prioritise statistical outputs.
  • Identify the best available existing data sources.
  • Support negotiations to access data sources.
  • Support the development of new methods by using industry knowledge to provide advice on editing and combining data sources through an iterative development process.
  • Provide advice to ensure data is used and published in ways that protect the privacy of farms and agricultural businesses.

The iterative development process has helped to ensure coherence with other industry data and knowledge. This is important in developing trust in using new data sources and methods for producing official agriculture statistics.

Data Sharing Agreements

The ABS has developed partnerships and established data sharing agreements with a wide range of public and private organisations holding agricultural data. This includes many of the key data sources identified as being important in the original paper on Modernising ABS agriculture statistics such as satellite crop mapping data, National Livestock Identification System data on aggregate livestock movements as well as specific industry data. Other than the Levy Payer Register data ABS accesses data in regional aggregates. This provides enough detail to produce regional statistics but protects the privacy of individual farms and businesses.

By replacing surveys this data has reduced the time farmers spend completing ABS agricultural surveys by 97% or approximately 20,000 hours per year on average.

The ABS and ABARES would like to thank the organisations that have shared data and provided expertise to develop the new methods and reduce the reporting burden on farmers.

The following case study with DAS (Digital Agriculture Services), a technology company that delivers rural-specific location intelligence provides a more detailed example of the way in which data partnerships support improved official agriculture statistics. The case study is also available to downloaded in PDF format.

ABS and DAS providing more timely and detailed agricultural statistics

Downloadable version of the case study with DAS


Additional data sources required to fill data gaps

Key data sources still required to support the modernisation of agricultural statistics include:

  • Horticultural crop mapping for horticulture area and land use statistics. This is currently not available for a wide range of horticulture commodities and will require development possibly through partnerships between government and industry groups.
  • Horticultural commodity business count and production statistics from industry groups. There is significant variation in the data held by different horticulture industry bodies, but this data is important in expanding the detail of horticulture statistics to regional levels.
  • Broadacre crop yield data (regional averages) from farm machinery or software. This data is needed to better refine the regional allocation of broadacre Levy Payer Register data. It could also be used in conjunction with crop area data to estimate total production and value of crops which would complement the production sold through the levy system.
  • Data from eggs, pork and poultry industry groups to support development of statistics on egg production and value as well as pork and poultry livestock counts.
  • Valuer General data from state/territory governments. This could be used to identify total agricultural land holdings which is an important component of understanding the changing land uses on agricultural land.

Understanding the broader agriculture statistics information needs

While the ABS is changing the way it produces agricultural statistics, ABARES is leading work to establish better governance and stewardship for the agricultural statistical system. Current work includes:

  • Convening commodity specific working groups who assist in the development of new statistical methodologies, identifying existing data sources, and ensuring industry data needs are considered in the modernisation program.
  • Creating a vision and objectives for the modernised agricultural statistical system.
  • Providing clarity on the roles of the ABS and ABARES in the provision of official agricultural data and information.
  • Developing a ‘point of entry’ web page to provide easy access to agricultural statistical data and information. Phase one focusing on official statistics and information from the ABS and ABARES will be released later in 2024. The web page will be extended throughout the first half of 2025 to include a wider range of Australian and international agricultural data and information.

Future work will continue to involve stakeholders from across the agricultural statistical system. This approach will ensure the most efficient use of resources to provide data to inform decisions that enable the agricultural industry to continue to adapt to challenges such as climate change and evolving trade environments. Specific work over the next two to three years to improve stewardship and governance includes:

  • Engaging with industry and government to understand emerging data needs over a 5–10-year horizon.
  • Improving the visibility of agricultural data and information provided by agencies other than the ABS and ABARES.
  • Encouraging the use of common standards and definitions, including spatial information, to improve the ability to integrate data from a variety of sources.
  • Investigating the possibility of creating a synthetic agricultural dataset to provide regionally detailed data for the use of researchers and analysts. A synthetic dataset will ensure that very detailed regional data can be used without compromising the privacy and confidentiality of individuals farmers or businesses.
  • Increasing the amount of agricultural data available in the ABS’ microdata environment.

Agriculture statistics modernisation timetables

This timetable provides a more detailed view of the range of agricultural statistics previously published by the ABS. The timetable provides an indication of when different statistical variables are likely to be available. The schedule is based on the currently planned approach however the experimental nature of this work means that it is very difficult to plan this work with certainty and it is likely there will be some changes as work progresses. Changes could be driven by changing priorities of data users, unexpected findings in developing new methods using existing data sources or the availability of new data sources which simplifies an approach. The following terms are used to identify plans for agricultural commodities or data items:

  • Planned: Data sources and an established method exist to produce this variable.
  • Tentatively planned: There is some data access or experimental development required to produce this variable and there is a risk that it may not be published until a later time.
  • Requires experimental development: Extensive data access and method development will be required to produce this variable.
  • Not planned: This variable won’t be released for this year.

Broadacre Crops

ABS Leading

Planned publication dates for 2023-24 reference year statistics:

  • February 2025 - Australian Agriculture: Broadacre Crops (winter crops)
  • May 2025 - Australian Agriculture: Broadacre Crops (summer crops)
Table 1, Winter crops statistics
Commodity(a)2024-25 financial year
(2023-24 reference year)
2025-26 financial year
(2024-25 reference year)
Future years
WheatPlannedPlannedPlanned
BarleyPlannedPlannedPlanned
OatsPlannedPlannedPlanned
CanolaPlannedPlannedPlanned
ChickpeasPlannedPlannedPlanned
LentilsPlannedPlannedPlanned
LupinsPlannedPlannedPlanned
SugarcanePlanned(b)PlannedPlanned
Hay and silageTentatively planned(c)Tentatively plannedTentatively planned 
Field peasNot plannedTentatively plannedPlanned
VetchNot plannedTentatively plannedPlanned
Faba beansNot plannedTentatively plannedPlanned
Other pulsesNot plannedTentatively planned(d)Planned(d)
Other oilseedsNot plannedTentatively planned(d)Planned(d)
  1. Unless otherwise indicated output for each commodity will be for SA2 regions and will include: levied production; total crop area; local value of levied crop; and number of levy payers.
  2. Tentatively planning an approach to calculate value at a regional level in addition to state level.
  3. Area data only tentatively planned for hay and silage in 2024-25 (2023-24 reference year).
  4. Australia and state/territory level data only.
Table 2, Summer crops statistics
Commodity(a)2024-25 financial year
(2023-24 reference year)
2025-26 financial year
(2024-25 reference year)
Future years
MaizePlannedPlannedPlanned
SorghumPlannedPlannedPlanned
RicePlanned(b)(c)PlannedPlanned
CottonTentatively plannedPlannedPlanned
  1. Unless otherwise indicated output for each commodity will be for SA2 regions and will include: levied production; total crop area; local value of levied crop; and number of levy payers.
  2. Tentatively planning to include value at Australia and state/territory levels.
  3. Tentatively planning an approach to calculate value at a regional level in addition to state/territory levels.
Broadacre statistical development work during 2024-25

The key development areas for broadacre statistics in 2024-25 (2023-24 reference year) include developing statistics for cotton and hay and silage area. The ABS is also developing an approach that will allow broadacre crop production, value and business count statistics to be produced on other geographic boundaries such as Local Government Areas (LGA) and Natural Resource Management (NRM) areas. Additional work is focussed on improving the automation and efficiency of existing processes which will enable future work on data gaps.

ABARES is developing an approach to calculate the gross value of broadacre cropping which they will publish in addition to the local value published by the ABS.

Broadacre statistical development work during 2025-26

Plans for 2025-26 include producing broadacre crop statistics for the 2020-21 and 2021-22 reference years to create a data series using the new method back to the last Agricultural Census. Regional statistics will be developed for field peas, vetch and faba beans along with national and state estimates of other pulses and other oilseeds. Additional work will continue to produce hay and silage production and value statistics. Options to refine the method for future efficiency have been identified and will continue to be explored and implemented as time and resources allow.

Broadacre statistical development work during 2026-27 and beyond

The focus of statistical development work from 2026-27 onwards will be on producing estimates for total production of broadacre crops by incorporating crop yield data. Aggregated yield data from farm machinery or software could be used together with crop area data to create estimates of total production. This would enable estimates of the crop production and value not sold through the levy system to be calculated. The yield data could also be used to further refine the process for producing regional statistics.

Australian Agriculture: Horticulture

ABS Leading

Planned publication dates for 2023-24 reference year statistics:

  • May 2025 - Australian Agriculture: Horticulture
Table 3, Horticultural crop statistics
Commodity(a)2024-25 financial year
(2023-24 reference year)
2025-26 financial year
(2024-25 reference year)
Future years
All commodities from the
Australian Horticulture
Statistics Handbook(b)
PlannedPlannedPlanned
Wine grapes(b)PlannedPlannedPlanned
Avocados(c)PlannedPlannedPlanned
MacadamiaPlannedPlannedPlanned
AlmondsTentatively plannedTentatively plannedTentatively planned
BananasTentatively plannedTentatively plannedTentatively planned
CitrusTentatively plannedTentatively plannedTentatively planned
MangoesTentatively plannedTentatively plannedTentatively planned
ApplesNot plannedTentatively plannedTentatively planned
PearsNot plannedTentatively plannedTentatively planned
Table grapesNot plannedTentatively plannedTentatively planned
PotatoesNot plannedTentatively plannedTentatively planned
BerriesNot plannedTentatively plannedTentatively planned
TomatoesNot plannedTentatively plannedTentatively planned
CherriesNot plannedTentatively plannedTentatively planned
Leafy greensNot plannedTentatively plannedTentatively planned
CapsicumNot plannedTentatively plannedTentatively planned
BeansNot plannedTentatively plannedTentatively planned
BroccoliNot plannedTentatively plannedTentatively planned
Other priority horticulture
commodities(d)
Not plannedNot plannedTentatively planned
  1. Unless otherwise indicated output for each horticultural commodity will be for SA2 regions and include: production; total crop area; area of bearing crop; value of crop sold.
  2. Estimates of production and value of crop sold for Australia and state/territory levels only.
  3. Australia and state/territory level business counts.
  4. As identified by the Horticulture Statistics Working Group.
Horticulture statistical development work during 2024-25

For horticulture statistics the main areas of focus in 2024-25 (2023-24 reference year) will be working to produce area, business count and regional statistics for bananas, citrus, almonds and mangoes. This work is heavily dependent on the availability of crop mapping and industry data for these commodities.

Statistics for 2020-21 and 2021-22 reference years are being produced for commodities where additional data is available to produce regional statistics (avocados and macadamias). This will provide a comparison point to the last Agricultural Census.

Statistics for Local Government Areas (LGA) and Natural Resource Management (NRM) areas in addition to SA2 regions are being produced for the commodities where data exists to produce regional statistics (avocados and macadamias). 

ABARES is developing an approach to calculate the gross value of horticulture crops at national and state level which they will publish in addition to the local value published by the ABS.

Horticulture statistical development work during 2025-26

The key focus will be on developing area, business count and regional statistics for the remaining horticulture commodities identified as priorities by the Horticulture Statistics Working Group. Developing partnerships with industry groups to access data as well as the development of more extensive horticulture crop mapping is essential to the ABS’ ability to produce statistics for these additional commodities. Opportunities to further improve and automate existing processes will continue to be explored to improve accuracy and efficiency.

Horticulture statistical development work during 2026-27 and beyond

From 2026-27 and beyond the focus will be on continuing to expand the number of horticulture commodities for which area, business count and regional statistics are available using the established process.

Australian Agriculture: Livestock

ABS Leading

Planned publication dates for 2023-24 reference year statistics:

  • May 2025 - Australian Agriculture: Livestock
Table 4, Livestock population and business counts
Commodity(a)2024-25 financial year
(2023-24 reference year)
2025-26 financial year
(2024-25 reference year)
Future years
Cattle herd - Full herd
structure
PlannedPlannedPlanned(b)
Sheep Flock - Full flock
structure
Tentatively plannedPlannedPlanned(b)
PigsNot plannedNot plannedTentatively planned
PoultryNot plannedNot plannedTentatively planned
Livestock business countsNot plannedTentatively plannedPlanned
  1. Livestock population counts on 30 June, Australia and state/territory levels.
  2. Tentatively planning to release regional data for 2025-26 reference year and beyond.
Table 5, Livestock businesses and value
Commodity(a)2024-25 financial year
(2023-24 reference year)
2025-26 financial year
(2024-25 reference year)
Future years
Cattle and calvesPlannedPlannedPlanned(b)
Sheep and lambs PlannedPlannedPlanned(b)
Pigs PlannedPlannedPlanned
PoultryPlannedPlannedPlanned
Other livestockPlannedPlannedPlanned
Wool PlannedPlannedPlanned
MilkPlannedPlannedPlanned
Eggs Not plannedNot plannedTentatively planned
  1. Local value and production at the Australia and state/territory levels.
  2. Tentatively planning to release regional data for 2025-26 reference year and beyond.
Livestock statistical development work during 2024-25

The primary focus during the 2024-25 financial year, will be to develop a method for estimating sheep populations, adopting similar stock/flow modelling principles used in the experimental herd estimates. There are a number of complexities that an experimental solution needs to account for, including:

  • Very different fertility factors between sheep breeds.
  • Lack of breed information from abattoirs.
  • Lack of data on sex at slaughter from abattoirs.
  • Shorter gestation periods for sheep relative to cattle.

In combination, these factors render sheep modelling a more complex task compared with cattle population modelling. However, the quality assurance metrics used to assess the experimental cattle estimates, will be used to assess the quality of experimental sheep flock estimates. This will provide 'safeguards' around the assessment of the consistency of the size, structure and population growth patterns of the flock, for given environmental conditions. We will look to publish a number of consecutive years on the new method, demonstrating and explaining any revisions to previously published estimates, compiled from previous directly collected surveys.

Work is also planned to develop methods for generating regional population inflows and outflows. These will be inputs to both sheep and cattle population estimates. If successful, this approach is likely to improve data quality of modelled populations for all livestock commodities.

The ongoing publication of experimental herd estimates; the quarterly livestock products series; and livestock value will continue as per our ongoing program of livestock statistics.

ABARES is developing an approach to calculate the gross value of livestock at national and state level which they will publish in addition to the local value published by the ABS.

Livestock statistical development work during 2025-26

The 2025-26 year will have a focus on implementing and publishing an update to the initial experimental sheep flock and cattle herd estimates through any refinements that can be made to the initial modelling approach.

Work to publish estimates of livestock business counts by business type will be undertaken.

In addition, work will start to investigate producing sub-state estimates for sheep and cattle, where data quality allows. Preliminary investigations into producing pig and poultry counts will occur during the first half of the 2026 calendar year.

Investigation will begin on a strategy for benchmarking the modelling approach for experimental livestock populations.

The ongoing publication of experimental livestock estimates; the quarterly livestock products series; and livestock value will continue as per our ongoing program of livestock statistics.

Livestock statistical development work during 2026-27 and beyond

Livestock development work in the 2026-27 financial year is likely to focus on refining existing modelling techniques and producing regional livestock statistics.

Approaches to produce pig and poultry population counts and egg production and value statistics will also be worked on.

It is anticipated that considerable work will be devoted to a population benchmarking exercise that will add additional rigour to the modelling approach used to estimate cattle and sheep populations. The benchmarking exercise is not likely to look like the original agriculture census for livestock, however it may incorporate some components of directly collected data and may potentially utilise existing collection activity by other organisations or existing livestock business systems to minimise any reporting burden on farmers.

The ongoing publication of experimental livestock estimates; livestock businesses; the quarterly livestock products series; and livestock value will continue as per our ongoing program of livestock statistics.

Agricultural Business Statistics and Microdata

ABS Leading
Table 6, Agricultural business statistics
Agricultural Business variables2024-25 financial year
(2023-24 reference year)
2025-26 financial year
(2024-25 reference year)
Future years
Total count of agricultural businessesNot plannedTentatively planned(a)Planned
Additional breakups of agricultural business characteristics such
as commodities and size (to be determined)
Not plannedNot plannedTentatively planned
  1. Initial release of agricultural business counts may not extend to all horticulture businesses.

The ABS is investigating options to use a combination of existing data sources, including leveraging the ABS Business Register to compile a picture of Australian agricultural businesses.

Initially it is envisaged that this would enable statistics to be produced on the number of agricultural businesses. This could be expanded to produce statistics on additional business characteristics such as the types and combinations of commodities produced as well as groupings of business size.

This business dataset would have potential to be used for further research into agricultural production in Australia through the ABS’ data integration environment, in a similar way to past agricultural data. An example of the benefits of this would be a better understanding of agricultural labour requirements.

Initial work being undertaken in 2024-25 is consultation on the development of agricultural business statistics and drafting a proposal to support further work in this area.

Agricultural Land Area and Usage

ABARES Leading
Table 7, Agricultural business statistics
Land Use variable
(area)
2024-25 financial year
(2023-24 reference year)
2025-26 financial year
(2024-25 reference year)
Future years
Total area of agricultural holdingsNot plannedNot plannedRequires experimental
development 
Agricultural land used for croppingNot plannedNot plannedRequires experimental
development
Agricultural land used for horticultureNot plannedNot plannedRequires experimental
development
Agricultural land used for grazingNot plannedNot plannedRequires experimental
development
Agricultural land with improved pastureNot plannedNot plannedRequires experimental
development
Agricultural land used for forestry
(plantation and native forest)
Not plannedNot plannedRequires experimental
development
Agricultural land used for conservationNot plannedNot plannedRequires experimental
development
Agricultural land used for
non-agricultural purposes
Not plannedNot plannedRequires experimental
development

ABARES is leading the development of agricultural land use statistics as they are currently responsible for producing national land use maps under the National Committee for Land Use and Management Information (NCLUMI). NCLUMI is a consortium of Commonwealth and state/territory government partners which promotes the development of nationally consistent land use information for Australia. It oversees the Australian Collaborative Land Use and Management Program (ACLUMP) coordinated by ABARES. NCLUMI is ideally placed to support the development of agricultural land use mapping and statistics in a similar way that other statistical working groups have supported broadacre crop, horticulture and livestock statistics.

Agricultural land use is the largest and most dynamic component of land use in Australia. Timely, regionally detailed land use data is essential for Australian agriculture to monitor changes in land use over time, demonstrate sustainability requirements for access to international markets and support the measurement of carbon emissions and abatement.

The 2021 Agricultural Census was the last time that extensive agricultural land ownership and use data was collected across Australia, this underpinned past land use mapping. However, there are a wide variety of existing land use, land ownership, and crop mapping datasets that could support regular, national land use mapping and the production of annual agricultural land use statistics.

Accessing and integrating these existing datasets into nationally consistent, timely and detailed land use mapping to support decision making will require extensive collaboration across the agricultural, environmental and spatial data ecosystems in Australia. ABARES has commenced this work, and more detailed plans are being formulated. ABARES will provide further updates on this work as it progresses.

In collaboration with Australian Climate Services, ABARES conducted workshops with data users in May 2024 to identify gaps in the availability of national land use data that is needed for information and decision making. Findings from this engagement are supporting further planning on the development of land use mapping within ABARES and through NCLUMI.

Agricultural Water

ABARES Leading
Table 8, Agricultural water sources
Agricultural Water Sources
(Volume)
2024-25 financial year
(2023-24 reference year)
2025-26 financial year
(2024-25 reference year)
Future years
Total volume of water from all sourcesNot plannedTentatively plannedTentatively planned
Water from irrigation channels or pipelinesNot plannedTentatively plannedTentatively planned
Water from on-farm dams or tanksNot plannedTentatively plannedTentatively planned
Water from rivers, creeks, lakes Not plannedTentatively plannedTentatively planned
Water from groundwaterNot plannedTentatively plannedTentatively planned
Water recycled from off-farm sourcesNot plannedTentatively plannedTentatively planned
Water from Town or mains supplyNot plannedTentatively plannedTentatively planned
Other sources of water (excluding rainfall)Not PlannedTentatively PlannedTentatively Planned

The ABS is working towards publishing statistics on agricultural water sources through a future Water Account publication. Statistics on water sources are tentatively planned for release in the 2025-26 financial year. The Water Account publication will incorporate agricultural water use statistics as they become available through ABARES.

Table 9, Agricultural water usage
Agricultural Water Sources
(Irrigated area, volume and value)
2024-25 financial year
(2023-24 reference year)
2025-26 financial year
(2024-25 reference year)
Future years
Total agricultural water useNot plannedNot plannedRequires experimental
development
Water use for pasturesNot plannedNot plannedRequires experimental
development
Water use for hay and silageNot plannedNot plannedRequires experimental
development
Water use for vegetablesNot plannedNot plannedRequires experimental
development
Water use for fruit, nuts and berriesNot plannedNot plannedRequires experimental
development
Water use for grapevinesNot plannedNot plannedRequires experimental
development
Water use for nurseries, cut flowers and turfNot plannedNot plannedRequires experimental
development
Water use for riceNot PlannedNot plannedRequires experimental
development
Water use for cerealsNot PlannedNot plannedRequires experimental
development
Water use for cottonNot PlannedNot plannedRequires experimental
development
Water use for sugarcaneNot PlannedNot plannedRequires experimental
development
Water use for other cropsNot PlannedNot plannedRequires experimental
development

ABARES is leading the development of agricultural water use statistics as agriculture is the largest user of water in Australia. Timely, regionally detailed data is required to inform decisions about water use in agriculture and the impacts of this on the wider environment. 

Data on agricultural water use was last collected in the 2021 Agricultural Census. There are some existing agricultural water use data sources that could support regular, national agricultural water use statistics. Accessing and integrating these existing datasets into nationally consistent, timely and detailed agricultural water use statistics to support decision making will require extensive collaboration across the agricultural, environmental and spatial data ecosystems in Australia. 

Water use and irrigated area statistics by commodity type are required to be developed to enable integration with ABS value statistics to calculate the gross value of irrigated agricultural production (GVIAP).

As a first step, ABARES is working with stakeholders across the agricultural statistical system to develop a detailed understanding of current and emerging data needs in relation to agricultural water use. Consultation will continue this year and will take a variety of forms including individual meetings with key stakeholders and a Have Your Say consultation page on the Department of Agriculture, Fisheries, and Forestry website. The Have Your Say is designed to reach a wide variety of interested parties and you are encouraged to complete this survey when it becomes available so that your views can be considered in the development of plans.

Work will commence early in 2025 to prioritise and develop data and information to meet these needs.

ABARES will update stakeholders as information requirements and publication plans become known.

Back to top of the page