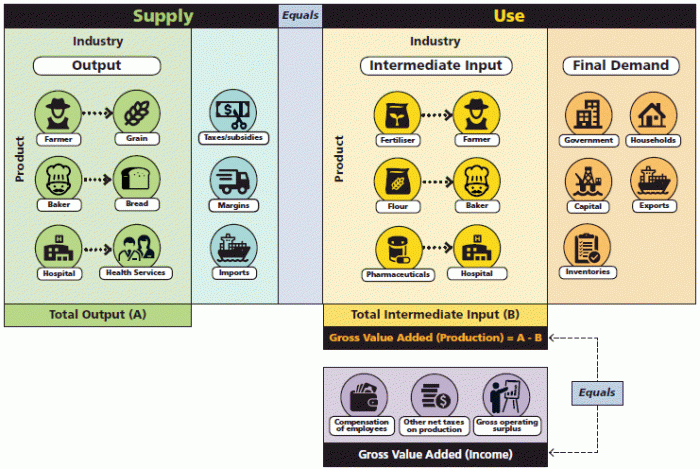
The Input-Output (I-O) tables present a comprehensive picture of the supply and use of all products in the economy, and the incomes generated from production.
They provide a framework for checking the consistency of statistics on flows of goods and services obtained from quite different kinds of statistical sources - industrial surveys, household expenditure inquiries, investment surveys, foreign trade statistics, etc. The Australian System of National Accounts (ASNA), and the I-O tables in particular, serves as a coordinating framework for economic statistics, both conceptually for ensuring the consistency of the definitions and classifications used and as an accounting framework for ensuring the numerical consistency of data drawn from different sources. The I-O framework is also appropriate for data estimation purposes, and for detecting weaknesses in data quality and estimation. By providing information on the structure of, and the nature of product flows through the economy, the I-O tables assist in the decomposition of transactions into prices and volumes for the calculation of an integrated set of price and volume measures. As an analytical tool, input-output data are conveniently integrated into macroeconomic models in order to analyse the link between final demand and industrial output levels.
Input-Output tables can be presented in either basic prices or purchasers’ prices, and the valuation basis for products is an important factor dependent upon which section of the supply-use framework the products are situated.
If users are looking at a use matrix within an I-O table, for the intermediate inputs matrix, industries appear across columns and products across rows. In the intermediate inputs matrix, each cell indicates the amount of a product purchased by each industry as an intermediate input into the industry’s production process. Within the final demand matrix, products are presented in the rows, and final demand categories (rather than industries) valued at purchasers' prices appear across the columns. The tables below are valued at basic and purchasers’ prices with Output indexes I-O framework at basic prices (Table 2.2) and Input indexes I-O framework at purchasers’ prices (Table 2.3).
The 'Supply' table of the Input-Output tables
If looking at a supply matrix within an Input-Output table, the domestic output matrix forms the main body of the table. In this matrix, industries appear across columns and products across rows, and each cell indicates the amount of each product that is produced domestically by each industry at basic prices. Total domestic supply by commodity (valued at basic prices) presents the sum of the domestic output and imports. Imports are valued at domestic port value, that is, free on board, which is equivalent to the importer’s customs frontier price. An example of the supply 'output' table is demonstrated in Table 2.2 below.
The 'Use' table of the Input-Output tables
Table 2.3 is an industry-level use table in the supply-use framework. This table comprises the intermediate inputs matrix, final demand matrix, and value-added matrix. The structure of the use table shows the use of products by industries and by final users as well as the value added by industry at purchasers’ prices. Valuation in purchasers’ prices shows inputs to industries and final uses at values that reflect the actual cost to the user of the product. These costs include the costs of transporting the product to the user in addition to any wholesale and retail mark-ups incurred while bringing the product to market.
The intermediate inputs matrix forms the central part of the use table. This represents expenditure of products by industry that are used as an intermediate input into the industry’s production process. These products are valued at purchasers’ prices, meaning that taxes, transportation costs, and wholesale and retail trade margins are embedded in the total along with the underlying value of the product purchased. No distinction is made in the use table between imports and domestically produced output.
The final demand matrix within the ‘Use’ table presents expenditure-side components of GDP, including household and government final consumption expenditures, gross final capital formation, change in inventories and exports.
