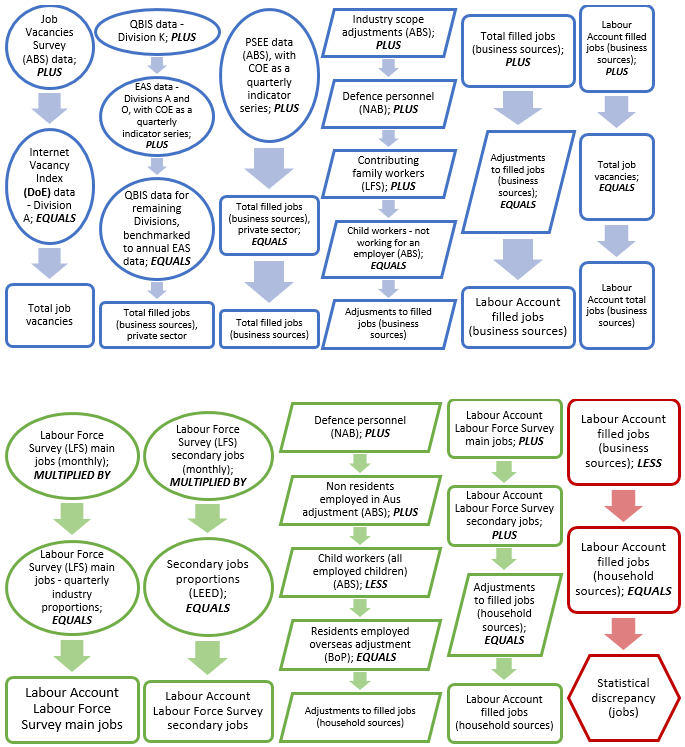
Non-residents are filtered into five groups based on their visa class: student visa holders, sponsored visa holders, 444 visa holders, working holiday visa holders, and other non-student visa holders.
Non-residents: main jobs
To estimate the number of main jobs held by non-resident student visa holders, an employment rate for holders of student visas is sourced from the Survey of Education and Work (SEW). The SEW data used in this calculation is limited to those student visa holders who arrived in Australia within the past two years. The method assumes that similar rates of employment apply to non-resident students as for resident students who recently arrived from overseas. SEW data is available annually from 2013 to the current year. The annual dataset is converted into a quarterly series using employment estimates (for the domestic student population) from the Labour Force Survey. Movements in the Labour Force Survey series are also applied to the level in 2013 to produce estimates prior to 2013. The quarterly employment rate series is then multiplied by the number of student visa holders to estimate the number of main jobs held by non-resident student visa holders.
To estimate the number of main jobs held by non-resident sponsored visa holders, an employment rate of 100% is assumed to apply for primary visa holders, while the secondary visa holders (that have working rights) are grouped with other non-student visa holders. This is because the skilled migration visas require that the primary applicant is employed for the duration of their presence while holding the visa.
To estimate the number of main jobs held by non-resident working holiday visa holders (working holiday makers), an equivalent method as for students is applied. For working holiday makers, the SEW data is restricted to non-student visa holders (excluding NZ citizens), and the LFS data is restricted to non-students.
To estimate the number of main jobs held by non-resident holders of a 444 visa (New Zealand citizens), an equivalent method as for students is applied. For 444 visa holders, the SEW data is restricted to New Zealand (NZ) citizens, and the LFS data is restricted to non-students.
To estimate the number of main jobs held by non-resident other non-student visa holders, an equivalent method as for working holiday makers is applied.
Non-residents: secondary jobs
To estimate the number of secondary jobs held by non-resident student visa holders, the estimated number of employed non-resident student visa holders is multiplied by the proportion of employed resident students who hold multiple jobs, which is sourced from the Labour Force Survey. This method assumes the same proportion of multiple job holding for non-resident students as for the domestic student population.
Sponsored visa holders are assumed to hold no secondary jobs due to the restrictions associated with their visa.
To estimate the number of secondary jobs held by non-resident non-student visa holders (excluding sponsored visa holders), the estimated number of employed non-resident non-student visa holders (excluding sponsored visa holders) is multiplied by the proportion of employed resident non-students who hold multiple jobs, which is sourced from the Labour Force Survey. This method assumes the same proportion of multiple job holding for non-resident non-students as for the domestic non-student population.
There is a time lag in the estimation of Net Overseas Migration (NOM) data. Consequently, estimates of short term visitors for the latest quarters are extrapolated by applying movements in Overseas Arrivals and Departures (OAD) data to estimates of NOM. The movements are applied after matching visa codes and reasons for journey between the NOM and OAD series.
Time periods from September 1994 to December 2005
OAD and NOM data with both visa type and reason for journey are not available for the entire time series of the Australian Labour Account. For earlier time periods, the following data are available:
- NOM data classified by reason for journey by visa type is available from March 2006
- OAD data classified by reason for journey by visa type is available from September 2004
- OAD data classified by reason for journey only is available from September 1993.
As with the current end of the NOM series, estimates for the periods prior to March 2006 are modelled from OAD data by applying movements with matching visa codes and reasons for journey category to the estimates of March 2006.
The resulting series are aggregated to students, non-students and sponsored visa holders in the same way as for the rest of the time series.
Disaggregation to industry
Jobs held by non-residents are apportioned across industry subdivisions in the following ways:
- Main jobs held by student visa holders are classified to industry subdivision using proportions derived from the Survey of Education and Work for employed student visa holders. The SEW data are converted to quarterly series and extrapolated using LFS data in a similar manner as outlined above for determining the rate of employment.
- Main jobs held by sponsored visa holders are classified to industry division using proportions derived from data on the industry of sponsoring businesses published by the Department of Home Affairs for 2016-17 and 2017-18. Division estimates are extrapolated where not available, and apportioned to industry subdivision, using LFS data restricted to non-students employed full-time.
- Main jobs held by working holiday visa holders are classified to industry division using proportions derived from data on the industry of businesses employing working holiday makers published by the Australian Taxation Office. Division estimates are extrapolated where not available, and apportioned to industry subdivision, using LFS data restricted to employed non-students.
- Main jobs held by holders of a 444 visa (New Zealand citizens) are classified to industry subdivision using proportions derived from the Survey of Education and Work for employed New Zealand citizens. The SEW data are converted to quarterly series and extrapolated using LFS data in a similar manner as outlined above for determining the rate of employment.
- Main jobs held by other non-student visa holders are classified to industry subdivision using proportions derived from the Survey of Education and Work for employed non-student visa holders. The SEW data are converted to quarterly series and extrapolated using LFS data in a similar manner as outlined above for determining the rate of employment.
- Secondary jobs held by student visa holders are classified to industry subdivision based on the LFS rate of multiple job holding of resident students with a main job in that subdivision.
- Secondary jobs held by non-student visa holders are classified to industry subdivision based on the LFS rate of multiple job holding of resident non-students with a main job in that subdivision.
Calculation of filled jobs (household sources) by industry
The Labour Force Survey collects quarterly data on the industry of the main job held by employed people. For each employed person, it also collects the number of secondary jobs held (second, third, fourth or more). The Labour Force Survey does not record the industry of secondary jobs. To calculate the number of filled jobs and people employed at an industry level requires the allocation of each secondary job to an industry.
This is done in the Australian Labour Account by first obtaining the total number of multiple job holders and the number of second, third and fourth jobs from the Labour Force Survey. Employed people who indicate they hold more than four jobs are assumed to hold only four jobs, as no further information on the number of jobs actually held is available. At this stage of compilation, multiple job holders and second, third and fourth jobs are classified by the industry of main job for each employed person.
Data from the ABS Linked Employer Employee Dataset (LEED) are then used to determine the proportions of the industry of employment of second, third and fourth jobs for multiple job holders, and applied to industry of main job Labour Force Survey data. These proportions are extracted as at the end date for each quarter from the LEED, and are updated as new data points become available. Industry proportions from the earliest available LEED are applied to earlier time periods in the Australian Labour Account, and similarly the latest available proportions are applied to subsequent time periods where necessary.
Where relevant, data are sourced from information collected in the Labour Force Survey in the last month of the relevant quarter, and apportioned across industry divisions and subdivisions using the related quarterly labour force industry data. For example, estimates in the September quarter Australian Labour Account are sourced from September month Labour Force data, which are then distributed across industry divisions and subdivisions from the industry distribution of quarterly data captured in the August Labour Force Survey published in Labour Force, Australia, Detailed, Quarterly.
Sector of Filled Jobs
One commonly used sector classification in labour statistics is the public and private sector classification. In this classification, the public sector includes all government units, such as government departments, non-market non-profit institutions that are controlled and mainly financed by government, and corporations and quasi-corporations that are controlled by government. The private sector refers to enterprises that are not controlled by Commonwealth, state/territory or local governments (that is, any enterprise that is not part of the public sector).
The Australian Labour Account publishes estimates of private and public sector filled jobs. These are compiled by applying proportions from business sources (with data from the Economic Activity Survey representing the private sector, and data from the Public Sector Employment and Earnings representing the public sector) to balanced numbers of filled jobs for each industry.
Job sharing
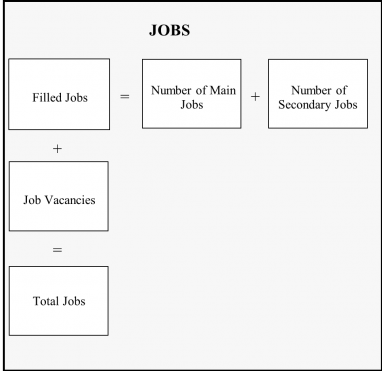
There is currently no household side information available on the number of jobs with job sharing arrangements. As a result, the total number of filled jobs is equivalent to the sum of reported main jobs and secondary jobs, plus scope adjustments. As with the business side, shared jobs on the household side would be counted as many times as there are people engaged in such arrangements.
Annual jobs methods
The Jobs quadrant contains stock data, which are data that measure certain attributes at a point in time. To determine an annual estimate of jobs in this quadrant, an average level is derived using a simple arithmetic average of the four quarterly estimates. Refer to Labour Account Methods for an example of this method.
The annual estimate of jobs is an approximate estimate of the number of jobs at any point in time during the year.

