The ABS will be closed from 12.00pm, 24 December 2024 and will reopen at 9.00am, 2 January 2025. During this time there will be no statistical releases and our support functions will be unavailable. The ABS wishes you a safe and happy Christmas.

Provisional Mortality Statistics methodology

This is not the latest release View the latest release
Reference period
Jan - Feb 2022
Released
25/05/2022

Introduction

This publication contains preliminary death counts by date of occurrence for Australia.

This series was introduced in June 2020 in response to the COVID-19 pandemic in Australia. The report provides an early indication of the pattern of mortality. There are many factors that may influence counts of deaths on a week to week basis, so deviations from baseline counts for individual weeks should be treated with caution.

The results for all past publications can be accessed by selecting ‘View all releases’ in the header of this publication.

Complete analysis of mortality data is only possible when all death records (both coroner and doctor) are received and processed. Death counts in this report will not be comparable with those reported in Deaths, Australia or Causes of Death, Australia. Differences are explained in more detail throughout the methodology.

For more complete analysis of 2020 mortality statistics, please refer to the Deaths and Causes of Death reports linked above. 
Data collection

Scope for all ABS mortality statistics

The scope includes:

  • deaths occurring and registered in Australia, including those persons with an overseas usual residence
  • deaths occurring within Australian Territorial waters
  • deaths occurring in Australian Antarctic Territories or other external territories (including Norfolk Island)
  • deaths occurring in transit (i.e. on ships or planes) if registered in the State of 'next port of call'
  • deaths of Australian Nationals overseas and employed at Australian legations and consular offices (i.e. deaths of Australian diplomats while overseas) when identified. 

The scope excludes:

  • deaths of Australian residents occurring outside Australia when registered by individual Registrars
  • repatriation of human remains where the death occurred overseas
  • deaths of foreign diplomatic staff in Australia (when identified)
  • stillbirths (fetal deaths). 

Registration process

The registration of deaths is the responsibility of the eight individual state and territory Registrars of Births, Deaths and Marriages.

When a death occurs, the cause of that death is either certified by a doctor using a Medical Certificate of Cause of Death (MCCD), or the death is referred to a coroner for further investigation. For doctor certified deaths, information about the cause of death is supplied by the medical practitioner certifying the death via the MCCD (or MCCPD for perinatal deaths). Other information about the deceased is supplied via the Death Registration Form (DRF), which is informed by a relative or other person acquainted with the deceased, or by an official of the institution where the death occurred. Registrars require information from both sources to complete a death registration. It should be noted that legislative requirements for registering a death differ across jurisdictions and this can impact on the timeliness of registration and reporting.

Information is provided to the Australian Bureau of Statistics (ABS) by individual Registrars for processing, coding and compilation into aggregate statistics. Registrars report all deaths that were registered in a month at the start of the following month.

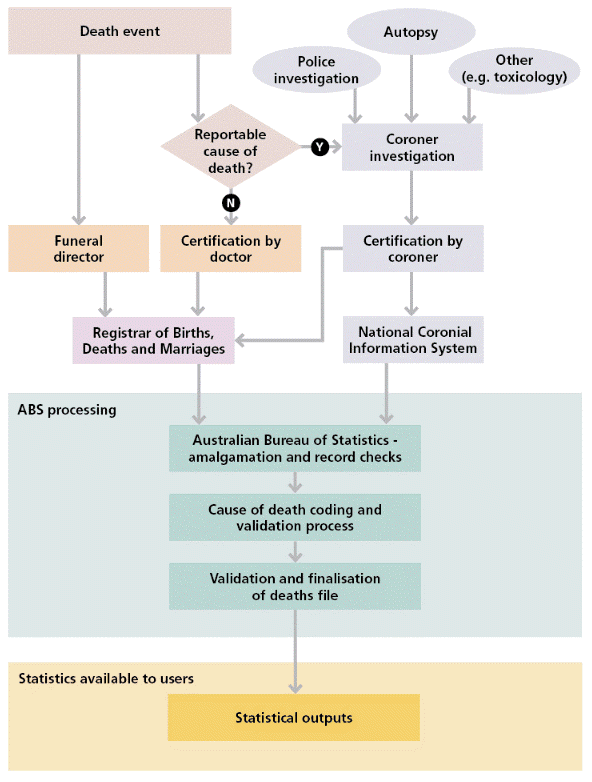
The following diagram shows the process undertaken in producing causes of death statistics in Australia. The path showing certification by a coroner and registration through the National Coronial Information System (NCIS) is out of scope of this report.

Australian causes of death statistics system

Flow chart showing the process for generating causes of death statistics
The flow chart begins with a death event. A death event has two options, a funeral director or reportable cause of death. The funeral director registers the death with the Registrar of Births, Deaths and Marriages. A reportable death has two options, yes or no. No, a Not reportable death, will be certified by a doctor then registered with the Registrar of Births, Deaths and Marriages. Yes, a Reportable death, goes to a coroner investigation. Coroner investigation contains three fields, police investigation, autopsy, and other (e.g. toxicology). Coroner investigation goes to certification by coroner. There are two options from certification by coroner, the Registrar of Births, Deaths and Marriages and National Coronial Information System. The path of coronial investigation and coroner certification is out of scope of this report. The next section of the flow chart is called ABS processing. The flow chart continues from the Registrar of Births, Deaths and Marriages and National Coronial Information System to Australian Bureau of Statistics amalgamation and record checks. This flows to cause of death coding and validation process, then to validation and finalisation of deaths file. The flow chart ends at the next section called statistics available to users, where the statistical outputs are produced.

Acknowledgments

This publication draws extensively on information collected from the state and territory Registries of Births, Deaths and Marriages. Their continued cooperation is very much appreciated. Without it, the wide range of vitals statistics published by the ABS would not be available. 

Timeliness and completeness of data

Data in this report includes all deaths registered by the end of a given month, by date of occurrence. When looking to measure change over time, the completeness of data for the most recent reported period is important.

When data is received each month by the ABS, the lag between the date of death and the date of registration means that approximately 40-50% of reported registrations are of deaths that occurred in the month being reported. The remainder are deaths that occurred in earlier months.  

For deaths which are doctor certified, approximately 95% of registrations are received after a second month of reporting. This is considered sufficiently complete to enable meaningful comparison with historical counts, noting that the level of completeness will be higher for the start of any given month than the end of that month. 

For coroner certified deaths, the proportion of registrations reported after a second month is lower, as it takes longer for coroners to certify deaths due to the complexity of investigations. Coroner certified deaths are included in the all-cause data and this may lower the completeness rate for more recently published weeks (see Data Release section of the methodology for more information on what data is available based on certification type).

Processing the data

Coding concepts: Underlying causes of death

Conditions on the medical certificate of cause of death are coded to the International Classifications of Diseases, 10th revision (ICD-10) (see Classifications section of the methodology for more information). ICD-10 codes are assigned to all conditions on a MCCD and rules applied to select an underlying cause of death. The World Health Organization (WHO) defines the underlying cause of death as the disease or injury that initiated the train of morbid events leading directly to death. Accidental and violent deaths are classified according to the external cause, that is, to the circumstances of the accident or violence which produced the fatal injury rather than to the nature of the injury. Data presented in this publication is tabulated according to the underlying cause of death.

Coding of COVID-19

In response to the COVID-19 pandemic, the WHO issued the ICD emergency codes U07.1 COVID-19, virus identified and U07.2 COVID-19 virus not identified. These codes are used when assigning causes to confirmed or suspected COVID-19 deaths.

Due to the public health importance of COVID-19, the WHO directed that the new coronavirus strain be recorded as the underlying cause of death, i.e. the disease or condition that initiated the train of morbid events, when it is recorded as having caused death.

Deaths due to COVID-19 are included in the total for all deaths certified by a doctor. They are not included in deaths due to respiratory diseases or any of the other specified causes included in this report.

COVID-19 infections

The number of weekly COVID-19 infections (not deaths) shown in Graph 1 of this report reflects the number of newly confirmed COVID-19 cases reported and updated daily by the Australian Department of Health. Information on newly identified COVID-19 infections is sourced from State and Territory Departments of Health and collated into a national figure by the Department of Health.

Measuring excess deaths

Excess mortality is an epidemiological concept typically defined as the difference between the observed number of deaths in a specified time period and the expected numbers of deaths in that same time period. During the COVID-19 pandemic estimates of excess death measurements have been used to provide information about the burden of mortality potentially related to the COVID-19 pandemic, including deaths that are directly or indirectly attributed to COVID-19. The expected number of deaths in a given year is best measured through statistical models that use historical counts of deaths to estimate an expected number of deaths for a given year. The ABS has applied a Serfling model to produce official excess mortality estimates in previous articles. 

Throughout the Provisional Mortality Statistics reports counts of deaths for 2020 and 2021 have been compared to an average of deaths over the 2015-2019 period. For 2022 counts of deaths are compared to an average number of deaths recorded over the 4 years (2017-19, 2021). As mortality during 2020 had prolonged periods where deaths were significantly lower than expected, 2020 has not been included in the baseline average. The inclusion of 2020 in the baseline lowered the average and could artificially indicate higher than expected mortality  These average or baseline counts serve as a proxy for the expected number of deaths, so comparisons against baseline counts can provide an indication of whether mortality was higher or lower than expected. The minimum and maximum counts from 2017-19 and 2021 are also included to provide an indication of the range of previous counts. Minimums and maximums for any given week can be from any of the four years from 2017-19 and 2021.

As 2021 is also a "pandemic year" the baseline average is providing an indication of higher or lower than expected mortality based on historical patterns of mortality that would most closely represent the expected mortality number in 2022. It is not measuring excess mortality in the absence of the COVID-19 pandemic. Other estimates of excess mortality should be used for this purpose. 

Age-standardised death rates (SDRs) and population data

Age-standardised death rates (SDRs) enable the comparison of death rates over time and between populations of different age-structures. The ABS uses the direct method of age-standardisation which allows for valid comparisons of mortality rates between different study populations and across time. This method was agreed to by the ABS, Australian Institute of Health and Welfare (AIHW) and other stakeholders. For further information see: AIHW (2011) Principles on the use of direct age-standardisation in administrative data collections: for measuring the gap between Indigenous and non-Indigenous Australians. Cat. no. CSI 12. Canberra: AIHW.

SDRs for specific causes of death with fewer than a total of 20 deaths have not been published due to issues of robustness. For further information, see Appendix: Principles on the use of direct age-standardisation, from Deaths, Australia, 2010.

SDRs in this publication have been calculated using quarterly population estimates and short-term population projections. SDRs for baseline years (2017-2019 and January 2021 to September 2021) have been calculated using quarterly estimated resident population (ERP) published in National, state and territory population, September 2021 released on 17 March 2022. See 'Revision status' in the Methodology section of that release for details of the status of quarterly population data used for calculating baseline rates. The quarterly estimates used for calculating weekly rates for the relevant year are as follows:

  • weeks 1-13 - Mar quarter ERP
  • weeks 14-26 - Jun quarter ERP
  • weeks 27-39 - Sep quarter ERP
  • weeks 40-53 - Dec quarter ERP.

Age-standardised death rates for October 2021 onward are based on short-term population projections. Since the most recently released population estimates lag the provisional mortality data by several months, short-term population projections have been used for calculating rates for some weeks. The population projections are based on the most recently available population estimate plus projected components of population growth. Projected births, deaths and interstate migration are based on previously observed data published in 'National, state and territory population'. Projected overseas migration is based on the latest overseas arrivals and departures data, as well as previously observed overseas migration published in 'National, state and territory population'. See the relevant footnotes in the data cubes of this publication for specific details of the ERP/projections used for the calculation of SDRs for weeks from October 2021 onward.

Confidence intervals

Mortality rates derived from administrative data counts may be subject to natural random variation, especially for small counts. Confidence intervals (CIs) for an SDR can help quantify this variability. CIs in this publication indicate a 95% probability that the 'true' SDR is contained within the lower and upper limits of the confidence interval. CIs have been calculated using the standard method and formulae can be sourced from Breslow and Day (1987) in the 'Statistical methods in cancer research' publication. Further information on the calculation of CIs can also be found on the METeOR website (see National Indigenous Reform Agreement: PI 08 - Tobacco smoking during pregnancy, 2016).

Data release

Differences compared with Deaths, Australia and Causes of Death, Australia

This report contains statistics compiled using different methods to those used when compiling annual data on deaths and causes of death.

Key differences include:

  1. Data for cause-specific mortality includes only doctor certified deaths (as with previous reports) due to the additional time taken to complete complex coronial investigations. Data for all-cause mortality includes deaths certified by both a doctor and a coroner as do the annual datasets. This is a change from monthly mortality publications prior to April 2022 release, for which all-cause mortality only included deaths certified by a doctor.
  2. This report is based on the date the death occurred. Annual reports are based on the date of registration.
  3. This report is based on the state or territory of registration. Annual reports are based on the state or territory of usual residence of the deceased.
  4. Data in this report is provisional. Data released in annual reports is final (except for revisions for coroner referred deaths). 

Data for the current reference period and data used to derive baseline counts (maximum, minimum and average) is based on the same methods, enabling strong comparison over time.

Doctor certified deaths and coroner certified deaths

Causes of death are either certified by a doctor or a coroner. In Australia approximately 86-89% of deaths are certified by a doctor.

Almost all external causes of death (e.g. suicides, accidents and assaults) are referred to a coroner.

Although there is variation across jurisdictions, deaths are generally reportable to a coroner in circumstances such as:

  • where the person died unexpectedly and the cause of death is unknown
  • where the person died in a violent or unnatural manner
  • where the person died during, or as a result of, an anaesthetic
  • where the person was 'held in care' or in custody immediately before they died
  • where the identity of the person who died is unknown. 

Any changes in coroner referral patterns can affect counts of doctor certified deaths. Some conditions have higher coroner referral rates (ischaemic heart disease, cerebrovascular diseases and to a lesser extent, respiratory diseases and diabetes) so counts for those conditions would be more likely to be affected by such changes.

Date of death versus date of registration

Each death registration in the national mortality dataset has 3 dates:

  • when the death occurred
  • when the death was registered with the jurisdictional Registry of Births, Deaths and Marriages (RBDM)
  • when the death was lodged with the ABS.

Data in this report is based on date of occurrence.

Date of occurrence and date of registration will differ for all deaths, and the length of time by which they differ can vary considerably. Deaths are not reported to the ABS until they are registered, so the length of time between death and registration affects:

  • the timeliness of information reported
  • the ability to measure true change in mortality over time. 

The average time lag between death and registration can vary, although in general, deaths certified by a doctor are registered sooner. Coroner certified deaths undergo extensive investigative processes which can delay registration times. For this reason, cause-specific deaths reported will only be those which are doctor certified. However, all-cause deaths will include both doctor and coroner certified deaths.

State or territory of registration versus usual residence

Data in this release are compiled by state or territory in which the death was registered. In most cases, the death is registered in the state in which it occurred. Data in Deaths, Australia and Causes of Death, Australia is compiled by the state or territory of usual residence of the deceased, regardless of where in Australia the death occurred and was registered.

Deaths of persons usually resident overseas which occur in Australia are included in the state/territory in which their death was registered. They are also included in counts of deaths based on usual residence of the deceased.

Provisional data versus final data

Statistics in this release are provisional and will be subject to additional processes prior to being released as part of the annual Deaths and Causes of Death datasets. Changes may occur in:

  • the number of deaths
  • demographic variables
  • causes of death. 

Counts of deaths in the annual Deaths, Australia and Causes of Death, Australia are considered final. Causes of death for coroner referred deaths are subject to a revisions process. Further information on this revisions process can be found in the Methodology for Causes of Death, Australia.

As registrations for deaths that occurred in previous reference periods are sent to the ABS, these will be counted against their date of occurrence. Therefore, each release will represent a more complete count of the number of deaths that occurred in that reference period.

Data can be impacted by changes within one or more of the Registries of Births, Deaths and Marriages and therefore caution should be exercised when assessing week to week movements.

Leading causes of death

The causes of death selected in this publication for further analysis were based on their status as leading causes of death in Australia, and the proportion of doctor certified deaths. The selected causes include:

  • Ischaemic heart disease (I20-I25)
  • Cerebrovascular diseases (I60-I69)
  • Respiratory diseases (J00-J99), which are further broken down into:
    • Chronic lower respiratory diseases (J40-J47)
    • Influenza and pneumonia (J09-J18)
    • Pneumonia (J12-J18)
  • Cancer (C00-C97, D45, D46, D47.1 or D47.3-D47.5)
  • Diabetes (E10-E14)
  • Dementia, including Alzheimer Disease (F01, F03 or G30).

Data cubes also include COVID-19 deaths where the underlying cause of death is assigned an ICD-10 code of U071 and U072.

Ranking causes of death is a useful method of describing patterns of mortality in a population and allows comparison over time and between populations. Different methods of grouping causes of death can result in a vastly different list of leading causes for any given population. A ranking of leading causes of death based on broad cause groupings such as 'cancers' or 'heart disease' does not identify the leading causes within these groups, which is needed to inform policy on interventions and health advocacy. Similarly, a ranking based on very narrow cause groupings or including diseases that have a low frequency, can be meaningless in informing policy.

Tabulations of leading causes presented in this publication are based on research presented in the Bulletin of the World Health Organization, Volume 84, Number 4, April 2006, 297-304. The determination of groupings in this list is primarily driven by data from individual countries representing different regions of the world. Other groupings are based on prevention strategies, or to maintain homogeneity within the groups of cause categories.

Baselines and average numbers

Mortality data for 2022 is compared to an average baseline. The baseline is an arithmetic average of the previous 4 years of deaths from 2017-19 and 2021 based on year and week of occurrence. Minimum and maximum counts from 2017-19, 2021 are also included to provide an indication of the range of previous counts. Mortality data for 2021 is compared to a baseline derived from deaths that occurred between 2015-19.

Baselines are compiled based on weekly death counts from all causes and for specified causes of death. Weekly baseline information strengthens comparability by accounting for seasonal patterns of mortality. While baselines provide a point for comparison, they do not provide an indication of the statistical significance of any deviation from that baseline.

Weekly comparisons

In line with the ISO (International Organization for Standardisation) week date system, weeks are defined as seven-day periods which start on a Monday. Week 1 of any given year is the week which starts on the Monday closest to 1 January, and for which most of its days fall in January (i.e. four days or more). Week 1 therefore always contains the 4th of January and always contains the first Thursday of the year. Using the ISO structure, some years (e.g. 2015 and 2020) contain 53 weeks.

Confidentiality

The Census and Statistics Act 1905 provides the authority for the ABS to collect statistical information, and requires that statistical output shall not be published or disseminated in a manner that is likely to enable the identification of a particular person or organisation. This requirement may restrict access to data at a very detailed level.

Standards and classifications

International Classification of Diseases (ICD)

The International Classification of Diseases (ICD) is the international standard classification for epidemiological purposes and is designed to promote international comparability in the collection, processing, classification, and presentation of causes of death statistics. The classification is used to classify diseases and causes of disease or injury as recorded on many types of medical records as well as death records.

The ICD is revised periodically to incorporate changes in the medical field. Currently the ICD 10th revision is used for Australian causes of death statistics.

The ICD-10 is a variable-axis classification meaning that the classification does not group diseases only based on anatomical sites, but also on the type of disease. Epidemiological data and statistical data are grouped according to:

  • epidemic diseases
  • constitutional or general diseases
  • local diseases arranged by site
  • developmental diseases
  • injuries. 

For example, a systemic disease such as sepsis is grouped with infectious diseases; a disease primarily affecting one body system, such as a myocardial infarction, is grouped with circulatory diseases; and a congenital condition, such as spina bifida, is grouped with congenital conditions.

For further information about the ICD refer to WHO International Classification of Diseases (ICD).

The versions of the ICD 10th Revision are available online.

Updates to ICD-10

The Update and Revision Committee (URC), a WHO advisory group on updates to ICD-10, maintains the cumulative and annual lists of approved updates to the ICD-10 classification. The updates to ICD-10 are of numerous types including the addition and deletion of codes, changes to coding instructions and modification and clarification of terms.

From the 2013 reference year, the ABS implemented a new automated coding system called Iris.

The 2013-2020 data coded in the Iris system applied updated versions of the ICD-10 when coding multiple causes of death, and when selecting the underlying cause of death. The 2022 reference year causes of death data presented in this publication was coded using version 5.8.0 of Iris software. Version 5.8.0 applied the WHO ICD-10 updates (2021 version) which have resulted in minor changes to output. More information on Iris and ICD-10 versioning can be found in the table below. For details of further impacts of this change from 2013 data onwards, see the ABS Implementation of the Iris Software: Understanding Coding and Process Improvements Technical note, in the Causes of Death, Australia, 2013 publication and Updates to Iris coding software: Implementing WHO updates and improvements in coding processes Technical note, in the Causes of Death, Australia, 2018 publication.

The cumulative list of ICD-10 updates can be found online.

ICD-10 versioning by reference year
Reference yearIris versionICD-10 coding year
2013-20174.4.12013
20185.4.02016
20195.6.02019
20205.8.02020
20215.8.02021  
20225.8.02021


Socio-Economic Indexes for Areas (SEIFA)

Socio-Economic Indexes for Areas (SEIFA) is an ABS product that ranks areas in Australia according to relative socio-economic advantage and disadvantage. The indexes are based on information from the five-yearly Census of Population and Housing. See www.abs.gov.au/ausstats/abs@.nsf/mf/2033.0.55.001 for further information.

The COVID-19 articles use the Index of Relative Socio-economic Disadvantage (IRSD) to measure socio-economic status. A low score indicates relatively greater disadvantage in general, for example many households with low income, or many people with no qualifications or who work in low skilled occupations. A high score will reflect fewer households and people with these characteristics. A high score is not an indicator of advantage; rather it is an indicator of the absence of disadvantage. 


Glossary

Show all

Back to top of the page