Australian Agriculture: Broadacre Crops methodology

Latest release
Reference period
2022-23 financial year
Released
14/06/2024
Next release Unknown
First release

Overview

Scope

Includes crop production, value, cropping area and counts of businesses for key summer and winter broadacre crops and sugarcane. 

Excludes hay and silage.

Geography

Data is available for

  • Australia
  • States and territories
  • Australian Statistical Geography Standard Statistical Area Level 2.

Source

Source data includes:

  • Agricultural levy payer register transaction records
  • Satellite crop map imagery
  • Industry harvest information.

Collection method

Agricultural levy payer register records from 12 months after the crop harvest are combined with satellite derived crop mapping that relates to the growing period.

Concepts, sources and methods

Production and value refers to the amount and local value of levied (sold) production. Crop area refers to total growing area. Business counts relate to number of businesses paying levies.

History of changes

Not applicable for this release.

Introduction

The Australian Bureau of Statistics (ABS) is modernising the way official agricultural statistics are produced to better support Australian agriculture. These changes were outlined in early 2023 in Modernising ABS Agriculture Statistics which explained why the ABS is modernising its Agriculture Statistics Program and the guiding principles being followed.

A key part of the modernisation has been the development of partnerships with industry and government to identify new data sources and develop new statistical methods. This has reduced respondent burden on farmers, and created greater consistency between existing data sources which helps to build trust in the statistics.

The broadacre crop statistics have been developed in partnership with the Grains statistics working group which is led by the Grains Research and Development Corporation and includes a mix of industry and government experts.

The methods presented below have been refined with input from this group to produce broadacre crop statistics on the production and local value of broadacre crops sold through the levy system, the area of crops grown, and the number of businesses paying levies on broadacre crops.
Data sources

A summary of the key data sources used to produce the broadacre crop statistics contained in this publication is presented below.

Levy Payer Registers

Satellite derived crop mapping

Industry data

Concepts

Estimates of broadacre crop production, value and business counts are calculated using information reported in DAFF levy returns. Sugarcane estimates also utilise information from ASMC.

Production and local value estimates relate to the tonnage and value of crops sold which are subject to a levy.

Local value is also known as farm-gate price and is the value of the commodity at the place of production.

Business count estimates relate to the number of unique ABNs associated with levy returns for each crop.

Crop areas are calculated using satellite imagery derived crop mapping to estimate the area of broadacre crops grown at the paddock level. This data is aggregated to the SA2 level. The estimated area of crop includes all land identified as growing a particular crop regardless of it is final use: harvested and sold, harvested for on farm use or grazed off.

Scope and coverage

Estimates presented in this publication are based on information extracted from the Levy Payer Register for crops produced (grown for sale) in the year end 30 June. Sale of the crop may have occurred in the following financial year.

Statistics relate to crop produced for commercial purposes and exclude crops produced for hay and silage or domestic purposes (e.g. on-farm animal feed and grain held for future crops). The Levy Payer Register also excludes reporting of very small production amounts which are not leviable (where the total levy payable is less than $25 a year).

Value information contained in the DAFF Levy Payer Registers is based on local value, also known as farm-gate value.

The DAFF Levy Payer Register for broadacre crops contains records at the business (ABN) level.

The satellite imagery derived crop tables provide an estimate of actively growing crop areas within its coverage, including those not harvested for commercial purposes:

  • Crop map data for sugarcane supplied by the Queensland Department of Environment and Sciences relates to the actively growing sugarcane crop in Queensland and northern New South Wales
  • Crop map data supplied by DAS covers all of Australia’s major broadacre cropping regions but excluded some cropping activity undertaken beyond those regions. Crop area estimates outside of the DAS coverage are made using the Levy Payer Register production amounts.

How the data is produced

The levy payer register, satellite derived crop mapping, and industry data that support the broadacre estimates are produced for a range of purposes and a number of data editing, adjustment and data transformation steps take place to produce statistics from these sources. These steps include:

  • Levy record data repair, editing and geo-coding 
  • Levy record allocation to crop regions
  • Reallocation and benchmark processes to ensure data coherency and confidentiality.

Levy record data repair, editing and geo-coding

Levy record allocation to crop regions

Reallocation and benchmark processes to ensure data coherency and confidentiality

Reliability of estimates

The satellite derived crop map data is used to improve the location reliability of levy record data. The crop map enables identification of records that lie outside of crop map areas. Its use reduces the impact of data appearing in metropolitan and other urban areas. As a consequence, it improves reliability and coherence between production and growing location supporting annual production of statistics at fine geographic levels.

Where levies are based upon sales value, reported tonnage data in the levy records were in some cases inconsistent with the corresponding sale value, such that a price of $0.02 per tonne sold could be found. This typically results from tonnage data being reported in kilograms. Using such unrealistic data would undermine the quality of statistics produced from it. To address these issues, break-even price data provided by the Grains Research and Development Corporation (GRDC) and wider analysis were used to outlier unrealistic prices and adjust the tonnage in line with the median price for non-outlier records for the crop.

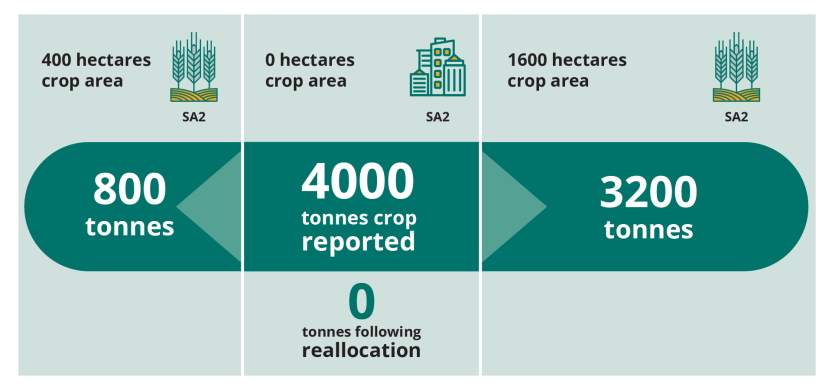
Yield testing identifies where levy record tonnages have created unusually high ratios of tonnage to satellite crop map data in an SA2. Data is reallocated to nearby cropping areas to bring the ratio into more realistic magnitudes, improving quality and utility.

Confidentiality and rounding

Some detailed estimates in this publication may have been confidentialised to avoid potential identification of agricultural holdings in accordance with the Census and Statistics Act 1905 and the Census and Statistics Determination 2018.

Where detailed estimates have been suppressed for reasons of confidentiality, they have been included in relevant aggregated totals.

Where figures have been rounded, discrepancies may occur between sums of the component items and totals.

Data limitations

These statistics are produced through the integration of multiple data sources. This integration of multiple data sources can help to manage the strengths and weaknesses of different data sources some of which are developed for a range of purposes that are not purely statistical. A number of assumptions have been made in the use of these data sources and these are highlighted below: 

  • Crop mapping data is assumed to be correct in identifying the accuracy of crop area and crop type. There are potential errors associated with each of these that are not measured.
  • Yield limits are applied consistently for each crop within each region when reallocating levy data, these yield limits do not consider localised factors like soil condition or irrigation.
  • A small percentage of crops are grown outside of the satellite derived crop mapping coverage. Yields from similar climatic areas are used to calculate area from the production amounts.
  • Production amounts relate to tonnes sold through the levy system. For some crops this will closely reflect total production but for others like oats it will be significantly less than the total production. For these crops it is not sensible to calculate yields by comparing with the total crop area.
  • Address information on levy returns may not accurately reflect the location of actual crop production. Where this can be identified, the production and value amounts are reapportioned according to the crop map distribution because no other data was available to inform this. There is error associated with this that cannot be measured.
  • Where errors are identified in levy payer register records through analysis of the price per tonne, corrections are made to the estimated tonnes using a median price per tonne on the assumption that the dollar amount is correctly reported.
  • Levy payer register records from the 12 months after the harvest are assumed to represent the harvest total but some crops may be stored for more than 12 months before sale, meaning they will be represented in the following years data. Industry input suggests such long-term storage is uncommon.

Revisions

Revisions are a change in the value of a published value and may arise due to a variety of reasons. 

Revisions may be applied to broadacre crop estimates due to:

  • Revisions to source data
  • Refinements to decisions made around the treatment of data anomalies in the series
  • Implementation of methodological and process improvements

Methodological enhancements

The methods and data sources used to produce these estimates will be subject to ongoing review to improve the accuracy and timeliness of outputs.

Comparability with previous Agricultural Census and survey estimates

The are conceptual differences between the data produced by ABS' Agricultural Census and agricultural surveys and the data produced using the new data sources appearing in this publication. These include:

  • the scope of the survey based estimates was businesses with an estimated value of agricultural output (EVAO) of $40,000 or more. Non-survey data sources do not have the EVAO restriction and measure the full extent of Australian agriculture sold and leviable through the DAFF Agricultural levies registers.
  • survey based estimates were subject to sampling variability and may have differed from the estimates that would have been produced if information had been obtained from all businesses. In comparison, it is compulsory to report any leviable amounts of crops sold to DAFF under government legislation.
  • survey based estimates for broadacre crops included production amounts not sold and those used on farm (for example for stock feed or silage). DAFF Levy Payer registers capture leviable amounts of crops sold only. For some crops such as Oats and Sorghum there is a significant difference between total production and what is sold and captured by the levy system.

For more information on the historical survey-based estimates see Agricultural Commodities, Australia.

How the data is released

Geographic classifications

National, state and territory statistics for the levied production, local value of levied crops, area and the count of businesses paying levies for broadacre crops are available in this publication.

Sub-state SA2 broadacre statistics are available via the ABS' Data Explorer.

National, state and territory, and SA2 estimates have been produced using the Australian Statistical Geography Standard (ASGS) (Edition 3).

Related publications

Other ABS publications containing agricultural data are listed on the ABS’ Agricultural Statistics page. The ABS also issues a daily Release Advice on the website which details products to be released in the week ahead.

Privacy

The ABS Privacy Policy outlines how the ABS will handle any personal information provided to us.

Abbreviations

Show all

Back to top of the page