Administrative data snapshot of housing, methodology

Latest release
Reference period
30 June 2021
Released
29/08/2023
Next release Unknown
First release

What is the Administrative data snapshot of population and housing?

The Administrative data snapshot of population and housing (ADS) is a new, experimental release of population and housing data built from administrative data sources.  

Like the Census, the ADS provides a snapshot of Australian people and houses at a point in time but for a smaller and different set of person and housing characteristics. 

The ADS is made up of two parts: a population snapshot dataset and a housing snapshot dataset. These datasets were first created to support the 2021 Census and are now being released as an integrated, stand-alone product. 

The ADS has a reference date of 30 June 2021, which is close to Census night (10 August 2021). This enables the best comparison with Census data and official population and housing statistics. 

This article explains the methodology used to create the housing part of the ADS, referred to as the ‘housing snapshot’. It shows: 

  • How the housing snapshot is created from administrative data sources 
  • How the housing snapshot compares to and differs from the Census and Estimated dwelling stock

What is administrative data?

Creating the housing snapshot from administrative data

Data used to create the housing snapshot

The housing snapshot is created using administrative data integrated at a dwelling level. The three data sources used are the ABS Address register, the Multi-agency data integration project (MADIP) and electricity consumption data from electricity distributors and networks. 

ABS Address register 

The ABS Address register is an up-to-date, comprehensive list of all known physical addresses within Australia, compiled using geospatial administrative data. The Address register is used as the basis for residential dwelling units on the housing snapshot. 

The ABS Address register was established ahead of the 2016 Census to support mailing out Census forms. It has developed and improved over time and now supports operations for Censuses. It also supports the linkage of datasets by allowing addresses to be coded to a unique, anonymised identifier for analysis about de-identified dwellings.

The Address register does not contain any information about the people or businesses associated with an address. 

Multi-agency data integration project (MADIP), including the population snapshot 

MADIP is a secure data asset combining information on health, education, government payments, income and taxation, employment, and population demographics (including the Census) over time. 

Administrative data from MADIP is used to create the population snapshot, which provides information about the people living in the dwellings in the housing snapshot. MADIP data was also used to derive signs of dwelling activity for the housing snapshot.  

Electricity consumption data from electricity distributors and networks 

ABS collected information from electricity distributors to help determine whether non-responding dwellings in the 2021 Census were occupied. The electricity data provides information about dwellings in the snapshot, including electricity consumption and signs of activity. 

Electricity consumption data was collected for residential electricity meters across Australia, including basic and smart meters. No information on other energy use, such as gas, was collected. 

Basic meters usually require manual reads, which occur approximately every 3 months. Basic meter reads (actual and estimated) were requested for the reference period of 1 May 2021 to 17 August 2021.  

Smart meters send information directly to the energy distributor throughout the day and do not rely on manual meter reads to report electricity consumption. Smart meter reads were requested for the reference period of 17 July 2021 to 17 August 2021.  

Involvement of each data source

There are three distinct steps to creating the housing snapshot from integrated administrative data: 

  1. Capturing residential dwellings at a point in time (scoping)
  2. Deriving information about those dwellings 
  3. Deriving Information about the people living in those dwellings. 

Table 1 lists the specific datasets used and their involvement in each of the three steps. 

Table 1. Datasets used to create the housing snapshot and their involvement at each step
  Involvement at each step 
Dataset1. Capturing residential dwellings at a point in time (scoping)2. Deriving information about those dwellings3. Deriving information about the people living in those dwellings
ABS Address registerYesYes 
MADIP and the population snapshotYesYesYes
Electricity consumption data Yes 


Step 1 – Capturing residential dwellings at a point in time (scoping)

The first step to creating the housing snapshot is to define a set of Australian residential dwellings at the reference point of interest (30 June 2021). This is achieved by selecting a subset of anonymised address identifiers on the ABS Address register to represent Australian residential dwellings. 

The Address register is updated each quarter to include new addresses and to remove addresses that no longer exist. Its coverage and quality change during the 5-yearly Census cycle as new information discovered in conducting the Census is fed back into the register over time. The housing snapshot was based on the Address register at May 2021, the last quarterly update not to use information from the 2021 Census. This included addresses that were under construction as of May.

Using the Address register to count residential dwellings is a new area of research in the ABS.  Because of conceptual differences between dwellings and addresses, and because the quality and coverage of the register changes over time, it is expected this methodology will continue to evolve.

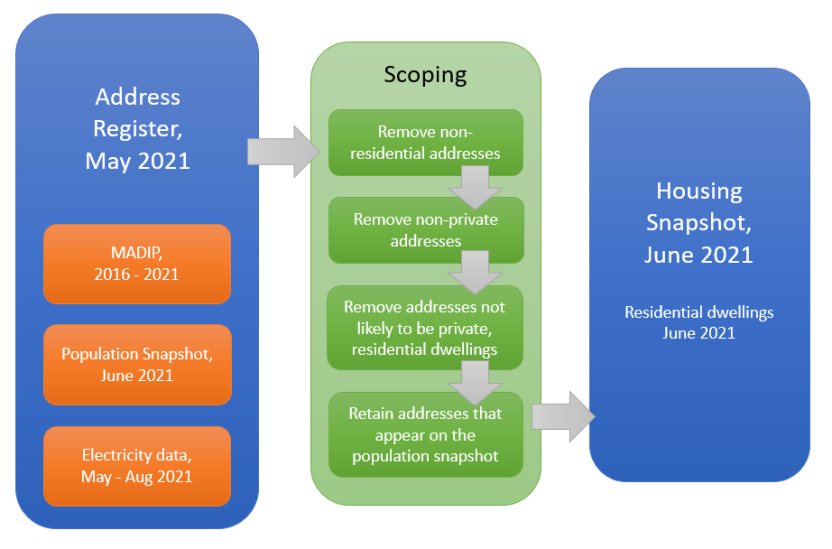
The following rules, referred to as ‘scoping’ rules, are used to select a set of addresses from the register that represent Australian residential dwellings at a point in time: 

  1. Remove addresses that are listed as non-residential 
  2. Remove addresses that are listed as non-private 
  3. Remove addresses that are less likely to represent private, residential dwellings 
  4. Retain addresses that appeared on the population snapshot. 

Scoping rules 1 and 2 remove all addresses that are listed as non-residential (e.g. commercial) or non-private (e.g. nursing home, residential college). Non-private dwellings are currently excluded, as information about people living at these dwellings is incomplete in the population snapshot.

Scoping rule 3 removes anonymised addresses that are less likely to represent private, residential dwellings. These tend be present on the register outside of capital cities and are identified using information from the Geocoded National Address File (G-NAF) © Geoscape Australia Copyright and Disclaimer Notice, one of the administrative data sources that the Address register is based on. G-NAF is built from three national address datasets and, for each address, indicates how many source datasets contain the address. 

Scoping rule 3 removes all addresses outside of urban areas where G-NAF indicates only one source contains the address. Addresses in urban areas with only one G-NAF source and no reliable dwelling structure on the Address register are also removed. This rule is not applied in Very remote areas or the Northern Territory, as it is more difficult to match addresses from different G-NAF sources in these areas.

Scoping rule 4 retains all addresses that appear on the population snapshot. These addresses were listed as someone’s residence in one of the government datasets in MADIP at 30 June 2021 and are deemed to represent valid residential dwellings at this time point. 

Figure 1 shows a diagram of the scoping process. Henceforth these scoped, anonymised addresses are referred to as ‘dwellings’. 

Table 2. Rules used to scope the Address register to represent residential dwellings at 30 June 2021
Scoping ruleMeasured byNumber of addresses removed/retained
1. Remove addresses listed as non-residentialAddress use indicator- 3.3 million
2. Remove addresses listed as non-privateAddress use indicator- 61,000
3. Remove addresses that are less likely to represent private, residential dwellings

Quality of dwelling structure information
Number of address sources indicated in G-NAF
Remoteness and state/territory

- 196,000
4. Retain addresses that appear on the population snapshotAddresses that would otherwise have been removed in rules 1-3 are retained if they appear on the population snapshot + 20,000


Figure 1. Scoping the Address register and Population snapshot to dwellings at a point in time

Scoping the Address register and Population snapshot to dwellings at a point in time

The image is a flow diagram of how the Address register frame is filtered to produce the dwellings at a point in time. There are three main boxes.

The first box on the left represents all the addresses in Australia at May 2021. It also combines data from the Population snapshot, MADIP and electricity data.

Data from the left hand box feed into the centre box, which represents the rules used to scope the address register. The first scoping rule is to remove all non-residential addresses. The next scoping rule is to remove non-private addresses and address not likely to be private, residential dwellings. The final scoping rule is to retain addresses that appear on the population snapshot.

The third box on the right represents the housing snapshot at 30 June 2021. It contains records for all residential dwellings in Australia as determined by the scoping rules.

Step 2 – Deriving information about dwellings in the housing snapshot

The second step is to derive information about dwellings in the snapshot. The housing snapshot includes three main types of dwelling information: 

  1. The structure of the dwelling 
  2. An indication of recent person activity at a dwelling 
  3. The level of electricity consumption at a dwelling. 

Coverage of data sources

The three data sources used to derive information for dwellings and people on the housing snapshot are MADIP, electricity data and the population snapshot (derived from MADIP). The coverage of these data sources is an important factor to consider when using measures derived from them.

Dwellings on the snapshot covered by MADIP are those where there is any record of the address being used within MADIP over the last 5 years.  Dwellings covered by electricity data are any addresses with an electricity connection over the electricity data reference period and where an anonymised identifier could be assigned. Dwellings covered by the population snapshot are those assigned as the usual residence of at least one person in the population snapshot at 30 June 2021.

Chart 1 shows the coverage of each source for Greater capital city statistical areas. Nationally, MADIP data has higher coverage of dwellings in the snapshot (94%) than electricity data (79%).  The population snapshot (83%) covers a subset of the dwellings covered by MADIP. The Northern Territory outside of Darwin has the lowest coverage rates, reflecting the difficulty of capturing accurate address information from administrative sources in more remote areas. 

Caution is needed when using measures for areas with low source data coverage (e.g. less than 50%), as they may not be representative of all dwellings in that area. Types of dwellings in the snapshot that tend to be under-represented by these sources (and therefore under-represented in dwelling activity measures) include: 

  • secondary residences (e.g. holiday homes or short-term rentals) 
  • dwellings with poorly recorded source addresses, for example dwellings in remote areas.

Dwelling structure 

Information on dwelling structure was sourced from the Address register. There are four main categories of dwelling structure: separate houses, townhouses, flats or apartments, and other dwellings (caravans, cabins, flats attached to shops, etc.).  

Dwelling activity 

Dwelling activity is an indication of how recently a dwelling may have been in use by someone.

Dwellings covered by MADIP (where there is a record of the address being used within the last 5 years) are broken down into 3 categories of activity:

  1. Dwellings in use as a primary residence
  2. Dwellings in use, but not as a primary residence
  3. Inactive dwellings with no sign of recent use

Table 3 shows the number of dwellings covered by MADIP at a national level, and the proportion of dwellings in each category. Dwellings in use as a primary residence (89%) are those assigned as the usual residence of at least one person in the population snapshot at 30 June 2021.

Dwellings in use, but not as a primary residence (9.7%) are those with an active address in MADIP at 30 June 2021 but are not assigned as the usual residence of any person on the population snapshot. These could include secondary residences, short-term rentals and dwellings on the market where primary residents are in the process of moving in.

The remainder of dwellings covered by MADIP are classed as inactive (1.3%). These dwellings are not active in any MADIP source at 30 June 2021.

A second measure of inactive dwellings is derived from electricity data. Dwellings with zero electricity consumption over the whole electricity data reference period are classed as inactive. Table 3 shows the number dwellings covered by electricity data at a national level and the proportion of inactive dwellings (1.3%). This aligns with the proportion of inactive dwellings determined from MADIP.

Table 3. Dwelling Activity by MADIP and Electricity
 MADIPElectricity
Dwellings covered by source 10,136,086 8,487,504 
Activity measure 1 - Dwellings in use as a primary residence9,005,028 (89.0%) N/A
Activity measure 2 - Dwellings in use, but not as a primary residence994,780 (9.7%)N/A
Activity measure 3 - Inactive dwellings with no sign of recent use136,278 (1.3%) 107,136 (1.3%) 


Electricity consumption 

Electricity consumption was reported as average daily use (ADU), that is the total electricity (kWh) used in the reference period divided by the total number of days over which the consumption occurred.

Electricity consumption included in the housing snapshot measured electricity drawn from the grid and did not take electricity generated from solar panels into account. This means that dwellings with low consumption as measured by electricity drawn from the grid may have higher consumption than recorded due to electricity generated from solar panels.  

Measures of ADU were grouped by the number of persons in the dwelling, as the energy use for a dwelling with four people will generally be greater than for a dwelling with one or two people. 

Step 3 – Deriving information about the people living in dwellings – the population snapshot

The third step is to derive information about people likely to be living in dwellings on the housing snapshot, using information about the people on the population snapshot associated with a dwelling.  This includes the number, age, sex and income of people assigned to a dwelling from the population snapshot. 

Of the 25.7 million persons on the population snapshot, 23.4 million (91%) were associated with a dwelling on the housing snapshot. The remaining 2.3 million (9%) could not be associated with a dwelling, as their location information could only be coded to an area, not an anonymised address.

Generally, persons who could be linked to a dwelling had higher median age (39 compared with 33 years) and higher median income ($536 compared with $458 per week) than persons who could not be linked to a dwelling. 

Several dwelling income measures are reported. Total dwelling income was calculated by adding the income for the 2020-21 financial year for each person listed as living in the dwelling and converting this to an average weekly income.  

Equivalised dwelling income allows direct comparison of income for dwellings by adjusting for the number of people in the dwelling (refer to glossary for more information).  

The main source of income (for example, salary/wages, government benefit, superannuation, etc.) was calculated as the largest component of total dwelling income recorded for the 2020-21 financial year. 

Comparing the housing snapshot with Census and official housing statistics

The housing snapshot is an experimental product that uses integrated administrative data to provide a snapshot of Australia’s housing at a point in time. It does not replace Estimated Dwelling Stock (EDS) or provide as much detail as the Census of Population and Housing. 

Scope 

The Census defines a dwelling as a structure which is intended to have people live in it, and which is habitable on Census Night. Examples of dwellings are houses, motels, flats, caravans, prisons, tents, humpies and houseboats.

EDS is based on adjusted counts from Census, and includes all dwellings defined in the Functional Classification of Buildings. This excludes all non-private dwellings and temporary dwellings such as short-stay caravans or houseboats that are recorded in the Census.

Conceptually, the housing snapshot aims to capture a similar scope as EDS, all permanent and fixed structures intended for long-term residential use. Like EDS, the scope of the housing snapshot is private, residential dwellings. Non-private dwellings are currently excluded, as information about people living at these dwellings is incomplete in the population snapshot.

Coverage 

Coverage refers to the extent to which a concept has been accurately captured according to the defined scope. For example, the Census aims to count every dwelling in Australia on Census night. If the Census misses some dwellings or counts some dwellings more than once then this would constitute coverage error in the count. 

Comparisons between the housing snapshot and EDS below (Chart 2) show very similar counts of dwellings at the national and state/territory level, with slightly higher counts in the housing snapshot.

Differences at the SA2 and LGA level are more substantial and indicate some trends of over- and under-coverage in the snapshot. Chart 6 in the comparisons further below shows that this over- and under-coverage tends to occur in some outback and inner-city areas.

There is an apparent misclassification of dwellings on the housing snapshot (Chart 3) where the housing snapshot has an under-count of townhouses and an over-count of houses and apartments compared with EDS.

Timeliness 

Updates to administrative records continue to occur over time, and hence the quality and completeness of a housing snapshot improves as the time between the reference date and the derivation of the snapshot increases. 

To support the 2021 Census, a housing snapshot for 30 June 2021 was created around September 2021, approximately three months after the snapshot date. While this snapshot was suitable for supporting the Census, the information available was less up to date and complete, particularly for people from the population snapshot where updates can be lagged by several months. The population snapshot used for this release was extracted 12-18 months after the Census, so its quality and completeness is greater. 

There are similar trade-offs between timeliness and completeness with Census data outputs. The earliest results from the Census are released 9 months after the reference date, and more enriched data is released 15 months after the Census. 

Statistical comparisons

1. Comparing aggregate dwelling counts

The national count of private, residential dwellings from the housing snapshot, Census, and EDS are listed in Table 4. 

Table 4. Number of dwellings in the Housing snapshot, Census and Estimated dwelling stock, 2021
Data sourceNumber of dwellings
Housing snapshot (30 June 2021)10,815,891
Census (10 August 2021)10,852,208
Estimated dwelling stock (30 June 2021)10,732,418


The count of dwellings is higher for Census than for the housing snapshot or for EDS. This is mostly because Census includes temporary dwellings (caravans and cabins used for short-stay accommodation, improvised homes etc., together about 131,000 dwellings) that are not included in EDS or the snapshot. The slightly later reference point for the Census also accounts for a small portion of the higher count compared to Estimated dwelling stock (about 17,000 dwellings).

As the housing snapshot is conceptually closer to EDS than Census, comparisons are made to EDS as the most appropriate indication of quality.  The count of the housing snapshot is about 80,000 dwellings higher than EDS, or about 0.8% at the national level.

National and state/territory 

Chart 2 shows that the differences between dwelling counts in the snapshot compared with EDS are generally small (within 1.5%) for all states/territories. The Northern Territory is the only state/territory where the snapshot has fewer dwellings than EDS. 

Looking at differences by dwelling structure, Chart 3 shows that at the national level, the counts of houses and apartments in the snapshot are within 0.8% of EDS, while the count of townhouses is 2.1% lower than EDS.

The map shows the percentage differences between the housing snapshot and Estimated dwelling stock for Statistical areas level 4. The under-coverage in Northern Territory – Outback and over-coverage in Queensland – Outback are explored further in Counts for small areas (SA2s) below.

Chart 4. Comparing dwelling counts across regions

Loading map...

Map of SA4-level differences (%) between the housing snapshot and Estimated dwelling stock, June 2021

Counts for small areas (SA2s) 

SA2 dwelling counts in the snapshot generally aligned well with EDS (Chart 5). About 82% of SA2s have differences within 5% of EDS, and about 90% within 10%. 

There are more areas with counts higher than EDS than those with lower counts. More areas have significant over-coverage than significant under-coverage: only 8 areas have counts more than 20% under EDS, while 30 areas have counts more than 20% over EDS. 

(a) Excludes SA2s with dwelling counts under 100

Chart 6 shows SA4s where more than 10% of their component SA2s had dwelling counts 10% higher or lower than EDS counts. This shows that outback areas and inner-city areas are the most likely to have SA2s affected by over- and under-coverage.

Far West and Orana in NSW and Queensland – Outback had a high proportion of SA2s (33% and 56% respectively) with greater than 10% over-coverage. Northern Territory – Outback had the highest proportion of SA2s (38%) with greater than 10% under-coverage. Administrative address information in remote areas is often less complete and may explain some of these differences. 

(a) Excludes SA2s with dwelling counts under 100

2. Comparing primary residences with Census occupancy

The proportion of dwellings in use as primary residences in the housing snapshot is expected to be similar to the proportion of occupied dwellings in the Census. This is because both the housing snapshot and the Census assign people to a single dwelling at a point in time.

At a national level, 89% percent of dwellings covered by MADIP were assigned as primary residences, compared with 90% of Census dwellings being occupied on Census night. The proportion of dwellings in use as primary residences varied from 79% in the rest of Northern Territory to 92% in Greater Hobart. Chart 7 shows there is reasonable alignment with Census occupancy rates at a state/territory level. 

3. Comparing dwelling characteristics with Census

Persons per dwelling

The average number of persons per dwelling in the housing snapshot was higher than recorded in Census (2.6 across Australia in the housing snapshot compared with 2.5 in Census).  The largest difference was in the Northern Territory, where the housing snapshot recorded fewer persons per dwelling than the Census.  Rest of NT also has the lowest coverage of persons from the population snapshot assigned to a dwelling (83%, see chart 1).

Dwelling income

The median, weekly income (gross) per dwelling in the housing snapshot was higher than recorded in Census ($1,842 in the housing snapshot compared with $1,746 in Census). The difference was greatest for the Northern Territory ($437 or 21%). As with persons per dwelling, this difference is also likely due to the lower dwelling coverage of people from the population snapshot in the Northern Territory outside of Darwin.

Glossary

Show all

Back to top of the page