Use of constrained optimisation in the production of supply-use tables

Introduction to constrained optimisation, and the benefits to both the ABS and users of the supply-use tables from incorporating this technique.

Released
30/10/2020

Introduction

Supply-use tables are a vital component of the Australian System of National Accounts. They are used to balance gross domestic product (GDP) for all three approaches (production, expenditure and income), and provide the annual benchmarks from which the quarterly GDP estimates are compiled.

By their design, supply-use tables reconcile the supply of products from domestic and foreign producers available for use in the Australian economy, with the use of these products, either as intermediate inputs in domestic production, or as final use. Additionally, supply and intermediate use by domestic producers are disaggregated by industry, providing a rich dataset for analysis of the Australian economy.

For the supply-use tables to perform their role, the tables must be balanced; that is supply must equal use for all products. Given the size of the tables, this task requires considerable resources to complete each year.

Since 2016-17, the ABS has supplemented the manual balancing process with an automated balancing technique known as constrained optimisation. This article describes the method behind constrained optimisation, and the benefits to both the ABS and users of the supply-use tables from incorporating this technique.

The ABS has also applied this technique in the production of the input-output tables. While this article refers only to the supply-use tables, the method is applied in the same way in producing the input-output tables.
Supply use tables

The supply-use framework

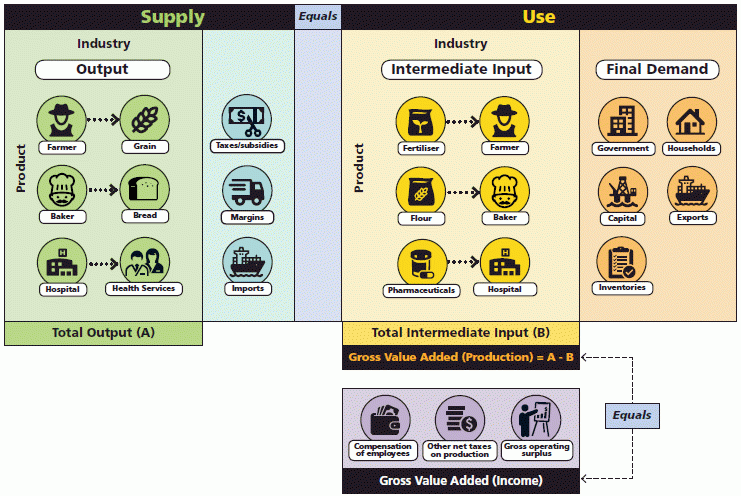
The supply-use framework comprises two tables as shown in Figure 1. The supply table shows the total supply of products from domestic and foreign producers that are available for use in the domestic economy. The use table presents the use of this supply by industries as intermediate inputs and by final users. Once both sides are equal (i.e. supply = use) for all products, the supply-use tables are said to be balanced.

Figure 1 - supply-use tables - framework for the economy

Figure: Supply - use tables - framework for the economy
Within supply is industry, and beneath this is output. Products under output are farmer to grain, baker to bread, and hospital to health services. These all make up total output (A). Also under supply are taxes/subsidies, margins and imports. Supply equals use. Within use is industry, and beneath this is intermediate input. Products under intermediate input are fertiliser to farmer, flour to baker, and pharmaceuticals to hospital. These all make up total intermediate input (B). Also under use is final demand. Beneath final demand are government, households, capital, exports, and inventories. Gross value added (production) equals total output minus total intermediate input, or A minus B. A minus B equals gross value added income. This includes compensation of employees, other net taxes on production, and gross operating surplus.

Products in the supply-use framework are classified using the Supply-Use Product Classification, into 114 product groups, while industries are classified using the Supply-Use Industry Classification, into 67 industries. This means that for domestic output on the supply table, and industry intermediate use on the use table, there are 114 x 67 = 7,638 cells, which must balance.

While many products are produced by only a small number of industries, many products are used by a large number of industries as intermediate input. Some products, such as electricity generation or professional, scientific and technical services, are used as intermediate input by all industries. Of the 7,638 intermediate input cells on the use table, 4,555 were greater than zero in the 2018-19 tables.

Constrained optimisation

Constrained optimisation is a mathematical approach that involves finding the ‘best’ solution to a problem, while meeting a number of conditions or constraints.

In the compilation of supply-use tables in the ABS, constrained optimisation is used to find a set of balanced and economically logical tables that are as close as possible to the unbalanced tables described earlier.

Constrained optimisation requires two main components:

  • A set of mathematical constraints that define how the values in the final balanced table must relate to each other, and how they must relate to their original unbalanced values. This relates to the ‘constrained’ term, rules that define what solutions to the problem are permissible.
  • The objective function, which calculates how different the values in each solution relate to their original unbalanced values, weighted according to factors. This relates to the ‘optimised’ term, a function that defines how bad (or good) each solution is, as well as a process that finds the lowest (or highest) value for that function.

Finally, a mathematical process is used to find the smallest result for the objective function, while still fulfilling all of the constraints.

Constraints

Constraints are used in the application of constrained optimisation to ensure that balanced tables output meet the specific logic and requirements of the supply-use tables. Many constraints are used, some of the key ones include:

  • Aggregate constraints – for each product, the sum of Australian production by each industry must equal total Australian production of that product. Similar constraints exist for all aggregates within the tables.
  • Supply must equal use - for each product, the balanced value for total supply at purchaser’s prices must equal the final balanced value for total use at purchaser’s prices. That is, each row must be balanced in the tables.
  • Economic impossibilities – there are a number of constraints to ensure that the balancing process doesn’t introduce any such economic impossibilities during the balancing process. For example, for each product, balanced re-exports cannot be greater than balanced imports. Re-exports are exports of goods that are imported and exported in the same financial year, so by definition re-exports can’t exceed imports.
  • Change in sign – for example, for each product, the balanced change in inventories values must have the same sign as the unbalanced change in inventories value.

Objective function

Mathematically, there are many possible balanced versions of the supply-use table that would meet the constraints set out. To determine which of these ‘solutions’ is the optimal one, an objective function is used to provide a measure of how good the fit is.

The ABS use a weighted least squares (WLS) objective function. For each (non-aggregate) current price value (or cell in the supply-use table), the following value is derived to determine the ‘cost’ of the balancing adjustment:

\({(Balanced\ Value - Input\ Value)^2 \over |Input\ Value|\ *\ Adjustability\ Rating}\)

The adjustability rating is a score determined by the ABS for each value, that defines how much we allow each value to be adjusted related to each other value. Cells or values where we have more confidence in the source data (such as merchandise trade imports and exports) are given a lower adjustability rating.

A similar cost value is derived for each deflator as well as for some other elements of the table. These are then all summed together to create the objective function for the supply-use balancing problem. The solver then minimises the value of this objective function while still fulfilling all of the constraints.

Interpreting how the objective function ensures the optimal solution:

  • (Balanced Value – Input Value)\(^2\) means that doubling the difference between a balanced value and its unbalanced equivalent will make its ‘cost’ four times larger. This says, all else being equal, it’s best to adjust all values by the same amount during balancing since two adjustments of $1m are better than one adjustment of $2m. It also shows that adjustment up and adjustments down are of equal ‘cost’.
  • Dividing by |Input Value| means that a larger value (in absolute terms) can be adjusted more than a smaller value, but still share the same ‘cost’. This says, all else being equal, it’s better to adjust larger values more than smaller values when determining the best solution.
  • Dividing by the adjustability rating means a value with a larger adjustability rating can be adjusted more than a value with a smaller adjustability rating, but still share the same ‘cost’. This says, all else being equal, it’s better to adjust entries in proportion to their adjustability ratings when determining the best solution.

More information

This paper only discusses constrained optimisation and the supply use tables in broad terms. 

Balancing using constrained optimisation

Data sources

Supply-use tables are compiled from many different data sources. Some of the main inputs to the supply-use tables include:

In addition, considerable numbers of other small administrative datasets, surveys and models are used to compile the supply-use tables.

ABS approach to balancing

The large number of data sources, each with their own limitations and quality constraints, mean that when first compiled, the supply-use tables do not balance – they are said to be unbalanced. The large number of cells, combined with the common use of many intermediate products, balancing the tables is a time-consuming task.

Previously the balancing process was an entirely manual process undertaken by staff, who would systematically work through each industry to balance the tables. This would be done in stages – first producing a balanced set of tables in current price, then after price deflating, compiling a second set in previous years prices required for calculating chain volume measures of GDP.

Constrained optimisation in practice

The ABS employ a combination of manual balancing, along with constrained optimisation, to produce balanced supply-use tables.

Before constrained optimisation is used, statistical analysts undertake manual balancing to remove all of the large imbalances in the supply-use table, and ensure that the tables best reflect the economic conditions for that particular year. Only when this process is complete is constrained optimisation employed to finalise the balancing process, after which results are quality assured by ABS analysts.

This approach ensures that:

  • Reflecting the correct economic situation in the supply-use tables is undertaken by statistical analysts, making use of the most accurate information available to them;
  • The results of constrained optimisation cannot impact on the economic accuracy of the tables;
  • Resources are not wasted undertaking tedious manual balancing on small cells that do not impact on the economic story in the data.
Back to top of the page