Understanding ABS data to support the net zero transition

9 data presentations to help narrate the net zero story

Released
28/11/2024

Introduction

The transition to net zero is a broad reaching global challenge, impacting the economy, society and environment. In Australia a range of policies have been introduced to help us progress towards net zero goals and support transition planning. 

Wide ranging data is needed to support this transition requiring analysis across many themes. The ABS environmental economic accounts program provides data opportunities. This article explores some of the ABS energy related data that can support information needs for Australia’s Net Zero transition.

What is Net Zero?

The Australian government defines Net Zero as the broad policy plan to reduce emissions to a net result of zero by 2050 (Net Zero - DCCEEW). Net zero will be achieved when the level of greenhouse gas emissions removed from the atmosphere offset those produced by human activities. 

A net zero plan has been established by the Australian Government setting out emission reduction targets and establishing sector specific plans to support investment in low emissions and renewable technologies. Legislative instruments exist to guide businesses towards net zero as well as targeted subsidies to encourage investment.

Measuring Net Zero

Net zero data requirements include greenhouse gas emissions, energy production and consumption, infrastructure investment, and household and business transition impacts, including prices. 

Net zero macro-economic analysis is best served when both physical and monetary measures of the environment are on a consistent basis. The System of Environmental Economic Accounts (SEEA) (System of Environmental Economic Accounting |) is the international standard that brings both dimensions together. The SEEA uses the same concepts and classifications as the System of National Accounts (SNA), enabling the linkages with macro-economic accounts. In Australia, the SNA and SEEA guide the collection of key economic and environmental data.

Energy Accounts capture the supply and use of energy products. Energy Accounts Australia tracks the allocation of physical energy as it passes through the economy and is distributed to other businesses, households and exports. An advantage of this format is that it is consistent with the laws of thermodynamics where all energy and heat are accounted for and can thus be related to macroeconomic transactions. Energy Account Australia includes supply and use tables for all sources of energy as well as asset accounts for non-renewables.

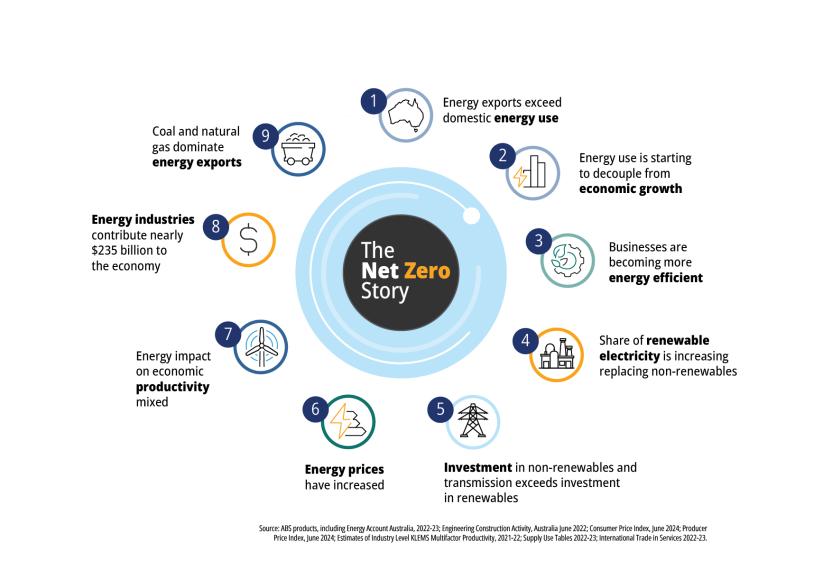
The remainder of this article uses recent ABS data to show 9 energy related presentations that help narrate the net zero story.

The Net Zero Story

Infographic showing 9 energy insights related to Australia's net zero transition

Energy use

Energy exports exceed domestic energy use

The energy accounts balance the supply and use of energy. This is meaningful when considered in the three stages of energy consumption: natural inputs, transformation into energy products, and energy end uses. For example, the amount of energy supplied by the environment matches the energy extracted (used) by industry for natural inputs. 

From the ABS energy accounts we can see that in 2022-23, natural inputs from non-renewable sources (20,475 petajoules (PJ)) exceeded renewable sources (522 PJ);  and energy exports (17,434 PJ) exceeded  industry end use (3,140 PJ), energy consumed in transformation processes (1,484 PJ), and household use (1,009 PJ). Energy from renewable sources was 2.5% of outputs from the environment in 2022-23.

Energy supply (PJ)

Energy supply (PJ)
YearEnergy from the environment - Non-Renewable sourcesEnergy from the environment - Renewable sourcesEnergy importsTotal energy supply
2010-1117,1522562,11519,523
2011-1217,5972582,14319,997
2012-1319,0732962,25821,627
2013-1418,4092992,24020,947
2014-1519,0983082,20621,612
2015-1620,0513222,25822,631
2016-1720,4823392,32223,143
2017-1821,7703442,45324,567
2018-1922,8563642,45125,671
2019-2022,7993852,27425,458
2020-2121,1274332,14323,703
2021-2220,1664752,17022,811
2022-2320,4755222,29823,294

Source: Energy Account Australia, 2022-23

Energy use (PJ)

Energy use (PJ)
YearIndustry useHousehold useChange in energy inventoriesEnergy exportsEnergy consumed by transformationTotal energy use
2010-112,7671,04451413,2901,90719,523
2011-122,8001,03062313,6501,89419,997
2012-132,8281,03647815,4911,79521,627
2013-142,8511,014-34015,6861,73720,947
2014-152,7521,03124315,7571,82821,612
2015-162,8831,017-64317,6371,73722,631
2016-172,9351,044-12217,5181,76823,143
2017-183,0261,04051018,2691,72124,567
2018-193,0771,03731419,5301,71325,671
2019-203,0571,0219419,6491,63725,458
2020-212,9251,013-6018,2221,60323,703
2021-223,009977-56117,8751,51122,811
2022-233,1401,00922717,4341,48423,294

Source: Energy Account Australia, 2022-23

Energy decoupling

Energy use is starting to decouple from economic growth

A key strategy in the net zero transition is continuing to grow the economy while reducing the economy’s reliance on energy as an input to that growth. Using 2010-11 as the base year, Australia’s real GDP growth was 31% through to 2022-23, while net energy use grew by 19%. The energy growth was driven by trade in fossil fuels, with extraction capability growing between 2010-11 and 2018-19. Post COVID-19, energy use has begun to exhibit some relative decoupling from economic growth. 

Decoupling of energy from economic growth (index year=2010-11)

Decoupling of energy from economic growth (index year=2010-11)

Line chart with 2 lines.
The chart has 1 X axis displaying Year.
The chart has 1 Y axis displaying Index number. Data ranges from 100 to 131.5.
End of interactive chart.

Source: Derived from Energy Account Australia, 2022-23

Energy intensity

Businesses are becoming more energy efficient

Energy intensity reflects the amount of energy used to produce output. Energy intensity across the Australian economy decreased by over 17% between 2010-11 and 2022-23, led by commercial services (-29%), manufacturing (-16%), electricity, gas, water and waste industry (-8%) and transport (-1%). These were offset by mining (+14%) and construction (+6%), as these industries increased their energy intensity over the timeseries.

Energy intensity (index year = 2010-11)

Energy intensity (index year = 2010-11)

Line chart with 7 lines.
The chart has 1 X axis displaying Year.
The chart has 1 Y axis displaying Index number. Data ranges from 68.6 to 114.1.
End of interactive chart.

Source: Energy Account Australia, 2022-23

Energy mix

Share of renewable electricity is increasing

Electricity is a key factor of production for Australian economic growth. Electricity accounted for 24% of net energy end use (or what drives the non-energy generation part of the economy) in 2022-23, second only behind diesel and petrol use (44%). While electricity demand has continued to grow in line with population growth, renewables started accelerating from 2010-11 and are increasingly replacing non-renewables.

Electricity generation by source

Electricity generation by source

Line chart with 3 lines.
The chart has 1 X axis displaying Year.
The chart has 1 Y axis displaying PJ. Data ranges from 75 to 991.
End of interactive chart.

Source: Energy Account Australia, 2022-23

Electricity infrastructure investment

Investment in non-renewables and transmission exceeds investment in renewables

Investment in renewables is accelerating, however the investment in other electricity i.e. non-renewable generation, transmission wires and poles,  remains higher. The value of work completed for renewables ($1.6 billion for June 2022), quarter on quarter, was still lower than non-renewables and transmission ($2.7 billion for June 2022).

Construction work on electricity, work completed by quarter

Construction work on electricity, work completed by quarter

Line chart with 2 lines.
The chart has 1 X axis displaying Quarter.
The chart has 1 Y axis displaying $ Million. Data ranges from 97 to 2740.
End of interactive chart.

Source: Derived from Engineering Construction Activity, Australia, special article "Value of renewable energy construction", June 2022. This article will be updated in December 2024. 

Note: Renewables include generation and storage investment based on hydro-electric generating plants, wind farms, utility scale solar farms and pumped hydro generation as well as battery storage. Rooftop photovoltaic systems are out of scope of the Engineering Construction Survey though they are recognised as a notable contributor to renewable energy. Other electricity investment includes generation, transmission and distribution data so the information presented is broader than just new generation projects. Other electricity assets include non-generation investment such as maintaining and expanding existing transmission networks, connecting new renewable projects to existing networks and non-renewable generation assets ie. coal and gas power plants. 

The cumulative value of new energy investment highlights this difference, with $51 billion of infrastructure for wires and poles between March quarter 2016 and June quarter 2022, outpacing renewables ($26 billion). Over the same time period, the change in non-renewable electricity generation decreased by 14% (-108 PJ), while renewable electricity generation doubled (up 108% to 157 PJ). 

Cumulative value of new energy stock, by quarter

Cumulative value of new energy stock, by quarter

Line chart with 2 lines.
The chart has 1 X axis displaying Quarter.
The chart has 1 Y axis displaying $ Million. Data ranges from 97 to 51445.
End of interactive chart.

Source: Derived from Engineering Construction Activity, Australia, special article "Value of renewable energy construction", June 2022. This article will be updated in December 2024. 

Energy prices

Energy prices have increased

Energy prices respond to pressures from supply, infrastructure, global events and other costs. Using June quarter 2012 as the baseline price for a household electricity package, the price of electricity increased 53 points by June quarter 2024. Over the same period the CPI grew by 38.2 points.

Household price of electricity, average of 8 capital cities, quarterly

Household price of electricity, average of 8 capital cities, quarterly

Line chart with 121 data points.
The chart has 1 X axis displaying Quarter.
The chart has 1 Y axis displaying Index number. Data ranges from 42.4 to 152.9.
End of interactive chart.

Source: Consumer price index, June quarter 2024

For industry, the input costs of electricity increased by 41.9 points from a 2012 baseline. Gross operating surplus (related to gross company profits) and gross mixed income (profits of small and non-employing businesses) increased by 77% over the same time period.

Inputs into manufacturing, electricity price index, quarterly

Inputs into manufacturing, electricity price index, quarterly

Line chart with 121 data points.
The chart has 1 X axis displaying Quarter.
The chart has 1 Y axis displaying Index number. Data ranges from 53.4 to 167.7.
End of interactive chart.

Source: Producer price index, June quarter 2024

The transition away from non-renewables is not just about electricity. Other energy sources such as petrol and diesel play a large role in domestic consumption and mining products are a major component of Australia’s trade with other countries. The prices of all inputs to the Manufacturing industry grew by 28.7 points between June 2004 and June 2014, then by 45 points between June 2014 and June 2024. 

Between June 2004 and June 2014, coal mining price inputs into manufacturing increased by 40.4 points and natural gas input prices by 55.1 points. Between June 2014 and June 2024 these increased further to 66.9 points for coal mining and 69.0 points for natural gas inputs. 

PPI, inputs into manufacturing, selected energy industry inputs, quarterly

PPI, inputs into manufacturing, selected energy industry inputs, quarterly

Line chart with 4 lines.
The chart has 1 X axis displaying Quarter.
The chart has 1 Y axis displaying Index number. Data ranges from 21.5 to 247.3.
End of interactive chart.

Source: Producer price index, June quarter 2024

Energy impact on productivity

Energy impact on productivity mixed

The KLEMS framework provides a detailed statistical decomposition on the contributions to output growth, represented by five input categories - capital (K), labour (L), energy (E), materials (M), and services (S). This enables analysis on input mix changes, such as the role energy intermediate inputs, observed in industry output growth. Other things being equal, lower cost share means higher energy efficiency

Energy contribution in productivity can demonstrate if there is an increase in consumption to drive growth. For example, in 2019-20 the contribution to growth from energy decreased, reducing growth by 1.6 points. Transport, postal and warehousing energy inputs contributed an increase to growth of 0.6 in 2021-22, following a reduction in activity during COVID 19.

Energy inputs, points contribution to growth, multifactor productivity estimates

Energy inputs, points contribution to growth, multifactor productivity estimates

Bar chart with 3 data series.
The chart has 1 X axis displaying Industry.
The chart has 1 Y axis displaying Points. Data ranges from -1.59 to 0.61.
End of interactive chart.

Source: Estimates of Industry Level KLEMS Multifactor Productivity, 2023

The cost of energy as a factor of growth can also be used to understand the impact of efficiency and innovation in industry groups. Other things being equal, lower cost shares mean higher energy efficiency. Between 2019-20 and 2021-22, Transport, postal and warehousing had the highest cost share of energy (declining between 8.5% to 7%) and the most variable contribution to growth from energy, while the Manufacturing cost of energy declined from 6.5% to 5.5%.

Energy inputs, two period cost shares, multifactor productivity analysis

Energy inputs, two period cost shares, multifactor productivity analysis

Bar chart with 3 data series.
The chart has 1 X axis displaying Industry.
The chart has 1 Y axis displaying %. Data ranges from 0.28 to 8.51.
End of interactive chart.

Source: Estimates of Industry Level KLEMS Multifactor Productivity, 2023

Energy industries contribution to national income

Energy industries contribute nearly $235 billion to the economy

Income generated from the economy can be split according to its distribution, into compensation of employees, gross operating surplus, and net taxes paid to government. These are close representations of gross national income (GNI) by industry. These indicators represent the contribution of income from energy businesses as a share of national income. 

The contribution to GNI by energy industries peaked at nearly 10% in 2022-23. This was largely driven by coal mining (4% of GNI or $103b) and oil and gas extraction (4% of GNI or $100b). Over the past 12 years, the contribution of electricity generation and supply diminished to 1% of GNI ($24b).

Energy industries, primary factor income as a percentage of gross national income

Energy industries, primary factor income as a percentage of gross national income

Line chart with 6 lines.
The chart has 1 X axis displaying Year.
The chart has 1 Y axis displaying %. Data ranges from 0.08 to 9.55.
End of interactive chart.

Source: Table builder, Supply Use Table, 2022-23, Extracted October 2024

Some of this income was distributed to households in the form of compensation of employees (including employee wages, salaries and supplements). The compensation of workers in the electricity generation and supply industry was $8.3b in 2022-23, while in coal mining it was $8.2b. 

Compensation of employees, by selected energy industry

Compensation of employees, by selected energy industry

Line chart with 5 lines.
The chart has 1 X axis displaying Year.
The chart has 1 Y axis displaying $ Million. Data ranges from 206 to 8262.
End of interactive chart.

Source: Table builder, Supply Use Table, 2022-23, Extracted October 2024

Energy trade

Coal and natural gas dominate energy exports

The value of energy net exports has increased substantially over the past 20 years. Exports of energy products was $179 billion in 2023-24, up from $20.5 billion in 2003-04. Imports rose at a more moderate pace, growing from $10.1 billion in 2003-04 to $62.1 billion in 2023-24. Fossil fuel exports of coal and natural gas accounted for 89% of Australia’s energy exports in 2023-24. Imports of energy were mainly crude oil, petrol and diesel (97%) in 2023-24.

Value of energy based trade (excluding non-energy products)

Value of energy based trade (excluding non-energy products)

Line chart with 2 lines.
The chart has 1 X axis displaying Year.
The chart has 1 Y axis displaying $ Million. Data ranges from 3433 to 237355.
End of interactive chart.

Source: Derived from International Trade in Goods, 2023-24

In aggregate, Australian production of energy exceeded domestic energy needs by close to 370% in 2022-23.

Degree of energy self-sufficiency

Degree of energy self-sufficiency

Line chart with 13 data points.
The chart has 1 X axis displaying Year.
The chart has 1 Y axis displaying %. Data ranges from 308.2127868 to 407.0341743.
End of interactive chart.

Source: Energy Account Australia, 2022-23

Future extensions

Energy related data are also available in other ABS datasets, and the ABS’ coverage of net zero could potentially be expanded in future releases to cover other characteristics. 

In relation to net zero, it is worth noting emissions reporting. The SEEA manual includes energy and air emissions accounting. ABS has compiled Energy Accounts since 1996 but currently does not produce SEEA-based Air Emissions Accounts. The current Australian National Greenhouse Gas Accounts (Home | ANGA (climatechange.gov.au)) are the Australian version of the UN Framework Convention on Climate Change (UNFCCC) reporting. While the UNFCCC reporting framework is used to report Australia’s emissions inventories internationally, it is not fully comparable with the SEEA / SNA. This is because the SEEA / SNA capture activity based on residency, while the UNFCCC uses the territory concept. Further adjustments are required to link the UNFCCC emissions data with economic data.