Cultural diversity of Australia

Information on country of birth, year of arrival, ancestry, language and religion

Released
20/09/2022

Measuring cultural and ethnic diversity

The Census collects a range of information that allows us to measure Australia’s cultural and ethnic diversity. Since the end of World War II, the proportion of overseas-born and second generation migrants in Australia has steadily increased. It is the suite of cultural diversity questions in the Census such as ancestry, country of birth, English proficiency, language spoken, Indigenous status and religious affiliation, which allow us to better understand the increasing complexity and growing ethnic diversity in Australia.

The terms ‘ethnicity’ and ‘ethnic’ can be associated with different meanings and there is no internationally agreed definition. The ABS has adopted a multidimensional approach to understand ethnicity in Australia. This approach was recommended by Borrie[1] and is consistent with the Law Lords definition of ‘ethnicity’ which refers to the shared identity or similarity of a group of people based on one or more distinguishing characteristics.

These characteristics include:

  • a long-shared history, the memory of which is kept alive
  • a cultural tradition, including family and social customs, sometimes religiously based
  • a common geographic origin
  • a common language (but not necessarily limited to that group)
  • a common literature (written or oral)
  • a common religion
  • being a minority (often with a sense of being oppressed)
  • being racially conspicuous.

This article presents key cultural and language diversity data and reflects on changes over time. For more information on religious affiliation see Religious affiliation in Australia. Two in-depth case studies have been included to show how information can be brought together to better understand ethnic populations in Australia.

For more information on measuring cultural and ethnic diversity see Standards for Statistics on Cultural and Language Diversity and Australian Standard Classification of Cultural and Ethnic Groups (ASCCEG).
Overseas-born in Australia

In 2021, just over 7 million people in Australia were born overseas, representing 27.6% of the population. This was an increase from 6.1 million, or 26.3%, in 2016.

First generation Australians are people living in Australia who were born overseas.

Second generation Australians are Australian-born people living in Australia, with at least one parent born overseas.

Third-plus generation Australians are Australian-born people whose parents were both born in Australia. One or more of their grandparents may have been born overseas or they may have many generations of ancestors born in Australia.

In the first Census in 1911, the proportion of people living in Australia who were born overseas was 17.7%. The graph below shows how this has changed over time as economic, political, and social factors – including wars and immigration policies – have influenced Australia’s migration patterns.

From 1911 to 1947, the proportion of people in Australia who were born overseas dropped to a low of 9.8% as migration was impacted by two World Wars and two major economic depressions[2]. From 1947, the proportion of overseas-born counted in the Census increased because of the post-war migration program, which included intakes of displaced persons and refugees from European countries.

Migration continued throughout the second half of the 20th century directed at population growth and economic development, and in response to humanitarian events in eastern Europe and Asia[3].

Since 2006, the proportion of people who were born overseas has increased more sharply, influenced by changes to Australia’s immigration policy including an increase in the intake of skilled migrants.

For further analysis of the characteristics of the 3 million permanent migrants who arrived in Australia since 2000 see Permanent migrants in Australia. The statistics in this article are from the Australian Census and Migrants Integrated Dataset (ACMID) which links data from the 2021 Census with the Department of Home Affairs Settlement Database.

For analysis of the characteristics of the 1.6 million temporary visa holders who were in Australia on Census Night see Temporary visa holders in Australia. The statistics in this article are from the Australian Census and Temporary Entrants Integrated Dataset (ACTEID) which links data from the 2021 Census with temporary visa holder data from the Department of Home Affairs.

(a) Overseas visitors are included from 1911-1966 and excluded from 1971-2021.

Overseas-born by state and territory

The proportion of the population who were born overseas has increased in all states and territories since 2006. In 2021, the states with the highest proportions of overseas-born were Western Australia (32.2%), Victoria (29.9%) and New South Wales (29.3%).

WA has had the highest proportion of overseas-born over the past 50 years. While the state only contained 10.5% of Australia’s population in 2021, it had high shares of the population who were born in a number of countries. For example, almost one third (32.1%) of Australia’s Zimbabwean-born population lived in WA. Other examples include Singapore (26.2%), South Africa (23.7%), and Ireland (22.4%).

The areas with the highest proportion of their population born overseas were in urban New South Wales and Victoria. The reason for this may be to settle with other migrant communities, or to access support services, employment or education.

The area with the highest proportion of overseas-born population in Australia was Auburn in western Sydney. In 2021, 61.7% of the population was born overseas, this was an increase from 60.0% in 2016.

Top 10 Statistical Areas Level 3 (SA3s)(a) – Highest proportion of population born overseas, 2021
Top 10 SA3sOverseas-born (count)Total population (count)Proportion of SA3 (%)
Auburn (NSW)63,835103,54461.7
Dandenong (Vic.)108,788193,64456.2
Fairfield (NSW)109,467195,17256.1
Parramatta (NSW)83,557152,12854.9
Melbourne City (Vic.)81,815149,60154.7
Sunnybank (Qld)26,61150,19053.0
Monash (Vic.)92,887182,83350.8
Canning (WA)49,86099,13950.3
Strathfield - Burwood - Ashfield (NSW)81,081161,66650.2
Canterbury (NSW)69,732141,09149.4

(a) SA3s are functional areas of regional towns and cities with a population of more than 20,000 or clusters of related suburbs around urban commercial and transport hubs within major urban areas. For more information see Statistical Area Level 3.  

In 2021, the SA3 with the highest number of countries of birth was Sydney Inner City. Almost half (47.9%) of the population of 218,000 was born overseas and came from 183 different countries.

Countries of birth

In 2021, the five most common overseas countries of birth were the same as those reported in 2016. While England remained the most common country of birth, its proportion of the population decreased from 3.9% to 3.6% of the population. The biggest change was the movement of India from fourth to the second highest overseas country of birth, an increase from 1.9% to 2.6% of the population.

Top 5 countries of birth in Australia by number, 2021
 Country of birthPersons (count)Proportion of population (%)
1England927,4903.6
2India673,3522.6
3China549,6182.2
4New Zealand530,4922.1
5Philippines293,8921.2

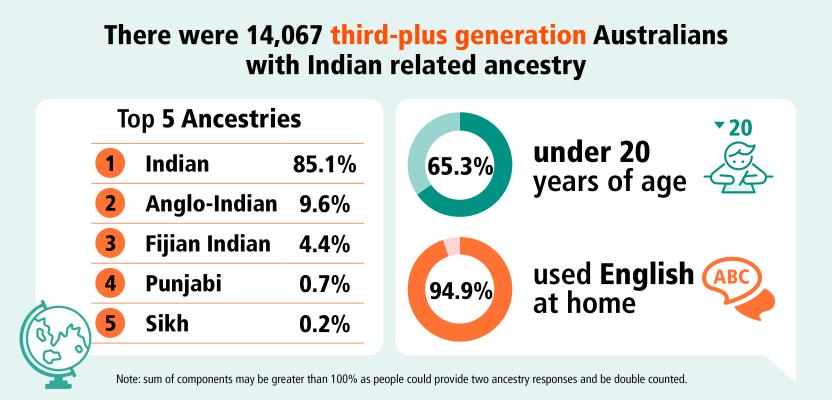
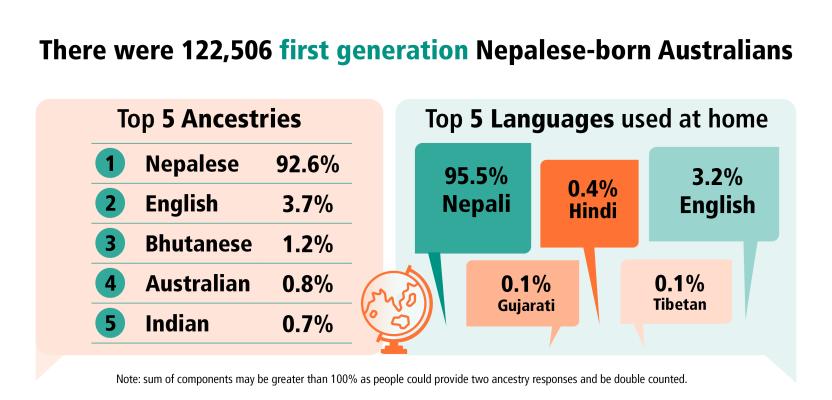
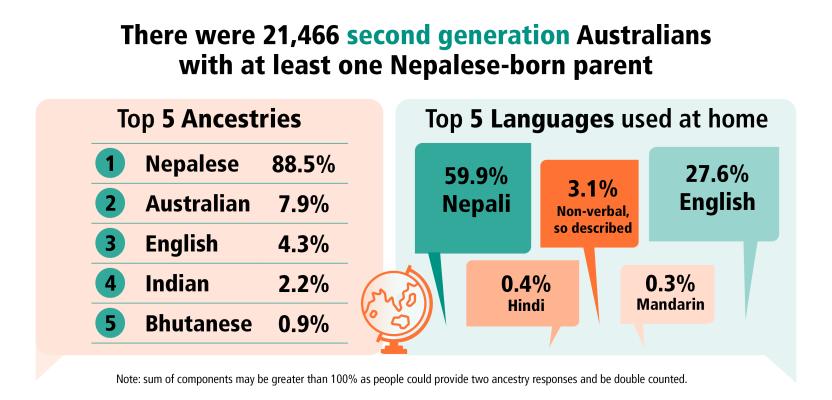
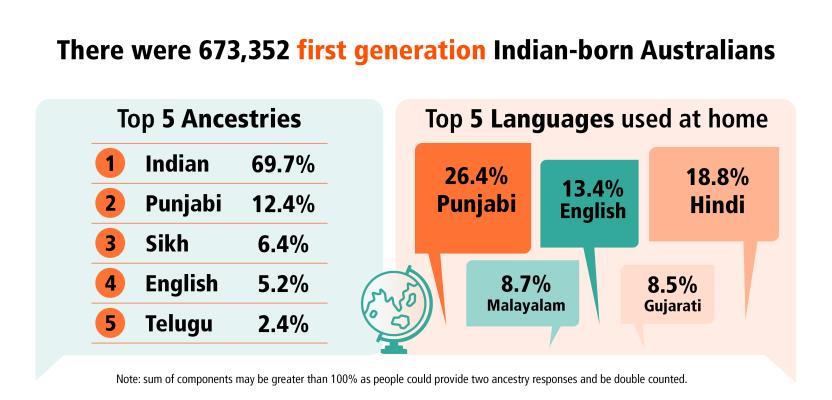
India was the country of birth that increased by the largest amount between 2016 and 2021, with an increase of 220,000 people. For more information see our case studies on India and Nepal.

Top 5 increases in country of birth by number from 2016 to 2021
 Country of birthIncreased by (count)Percentage increase (%)
1India217,96347.9
2Nepal67,752123.7
3Philippines61,50626.5
4China(a)40,0637.9
5Vietnam38,64217.6

(a) Excludes SARs and Taiwan

The most common countries of birth of the population were a result of Australia’s migration patterns over time.

In the first half of the 20th century, migrants to Australia were primarily from England, Ireland and Scotland. The influx of English-born migrants was maintained over the second half of the century by immigration policies aimed at increasing Australia’s population. Over 1 million migrants from the United Kingdom (UK) came to Australia between 1947 and 1981, mostly under the Assisted Passage Migration Scheme[3].

The graph below shows that since 1971, the number of people in Australian born in England has only slightly increased. Proportionately, the number of people in Australian born in England has decreased from 6.6% in 1971 to 3.6% of the population in 2021.

In the 1970s, the Chinese-born population in Australia increased after the Vietnam war by the arrival of asylum seekers who were Chinese-born residents of countries such as Vietnam and Cambodia[3]. From the late 1980s the increase in the Chinese-born population was largely a result of an increase in the number of Chinese students entering Australia[4]. Between 1986 and 1991, the Chinese-born population more than doubled, increasing from 37,000 to 79,000.

The number of Chinese-born people increased significantly in the 21st century with increases in intakes of skilled migrants and students. In 2011, China surpassed the UK as Australia’s primary source of permanent migrants[5].

The increase in the number of Chinese-born in Australia particularly occurred since 2006. Of the 3.3 million migrants who came to Australia between 2006 and 2021, over one quarter (27.1%) were born in China or India.

Change in Italian-born migrants

Fifty years ago, Italy was the second highest country of birth after England. In 2021 it had the biggest decrease of all countries of birth since 2016, dropping by almost 11,000 people.

Between 1947 and 1976, over 360,000 Italian migrants came to Australia to work in agriculture and major infrastructure projects. About one-fifth of these arrived under the 1951 Italian Assisted Migration scheme. By the early 1970s, as economic conditions in Italy improved, more Italian-born people were leaving Australia than entering[6].

In 1971, the number of the Italian-born population peaked at 290,000 but had declined to 163,000 in 2021. As most migrants from Italy arrived in the post-war migration wave, in 2021 the median age of the Italian-born population was 72 years and more than two thirds (69.4%) arrived in Australia more than 50 years ago.

Despite the decrease in the number of overseas-born Italians, the number of second generation Australians with one or both parents born in Italy increased from 322,000 in 2016 to 347,000 in 2021.

The number of Australians reporting an Italian ancestry also increased from 1 million in 2016 to over 1.1 million in 2021, making Italian the seventh largest ancestry in Australia. Italian was also the seventh largest non-English language used at home in Australia with 228,000 speakers.

From 2016 to 2021, the countries of birth with the largest decreases in number were European countries, mainly relating to those countries where high numbers migrated to Australia as part of Australia’s post-war migration program, including Italy, Malta and Greece.

Ancestry

The ancestry variables provide a self-assessed measure of ethnic and cultural backgrounds, which, when used in conjunction with the person’s and their parents' countries of birth, provides a good indication of the ethnic background of first and second generation Australians. Census respondents can report up to two ancestries in their response to the question on ancestry.

Most of Australia’s population are descendants of migrants and as a result, our most common ancestries align with the most common countries of birth of the population over time.

In 2021, Australia’s top five ancestries largely reflected earlier waves of British and European migration. While these were the same top five as reported in 2016, there were slight changes to the proportions.

The most common ancestry in Australia in 2021 was English which reflects the long history of English-born migrants settling in Australia. English was the most common ancestry for first and second generation Australians, and second most common for third-plus generation Australians.

Top 5 ancestries(a) in Australia as a proportion of the population, 2016 and 2021
 Ancestry20162021
1English33.6%33.0%
2Australian31.2%29.9%
3Irish10.2%9.5%
4Scottish8.6%8.6%
5Chinese5.2%5.5%

(a) Respondents can report up to two ancestries so percentages will add to greater than 100% as they are the number of responses as a proportion of the total population.

The only ancestry in the top five most common ancestries that increased in proportion was Chinese. From 2016 to 2021, the number of people with Chinese ancestry increased from 1.2 million to 1.4 million. This increase is partly attributed to the increase of Chinese-born over this time. In 2021, Chinese was the second most common ancestry for first generation Australians.

Top 5 ancestries(a) by generation, 2021
 First generationSecond generationThird+ generation
 AncestryProportion (%)AncestryProportion (%)AncestryProportion (%)
1English20.7English32.5Australian48.9
2Chinese14.0Australian30.9English44.2
3Indian8.3Italian7.9Irish14.6
4Scottish5.1Scottish7.6Scottish12.1
5Irish4.8Irish6.8Australian Aboriginal(b)5.8

(a) Respondents can report up to two ancestries so percentages will add to greater than 100% as they are the number of responses as a proportion of the total population. (b) Australian Aboriginal was added as a response category to the ancestry question on the 2021 Census form.

Australian ancestry was the second most common ancestry overall, and the most common ancestry for third-plus generation Australians. While respondents can report up to two ancestries, in 2021 almost half (49.6%) of all people who chose Australian ancestry, did not choose a second. For third-plus generation Australians, this proportion was higher at 59.8%. This may indicate that people choose Australian ancestry if multiple generations of their family have been born in Australia, or they do not know the cultural origins of their ancestors.

More information on ancestry data can be found in Understanding and using Ancestry data.

In 2021 Australian Aboriginal was in the top five most common ancestries for third-plus generation Australians, and in the top 10 ancestries of the total Australian population. The number of people who indicated that they had Australian Aboriginal ancestry increased from 144,000 in 2016 to 741,000 in 2021. This increase may have been a result of the addition of response categories to the ancestry question on the Census form.

More information on Aboriginal and Torres Strait Islander peoples including changes to the ancestry question is found in Aboriginal and Torres Strait Islander people: Census, 2021.

Language

Shared language is a component of understanding ethnicity. In 2021, 5.8 million people (22.8%) reported using a language other than English at home. This was an increase from 4.9 million people (21.6%) in 2016.

For those respondents who used another language at home, the Census asked how well they spoke English. A response of ‘not well’, or ‘not at all’ indicate a low proficiency in spoken English. In 2021, 3.4% of the population spoke English not well or not at all.

Top 5 most common languages other than English, 2021
 LanguagePersons who used language at home (count)Proportion of population (%)Proportion with low English proficiency (%)(a)
1Mandarin685,2742.725.9
2Arabic367,1591.415.3
3Vietnamese320,7581.330.5
4Cantonese295,2811.223.7
5Punjabi239,0330.98.8

(a) Uses other language and speaks English not well or not at all. As a proportion of people who use that language including those who did not state proficiency in spoken English.  

Use at home of languages other than English were more common in first generation Australians. In 2021, 71.8% of people who reported using a language other than English at home were a first generation Australian. Of the 1.6 million Australian-born people who spoke a language other than English, most (83%) had one or both parents born overseas, and almost half (48.4%) were children aged under 15 years.

In 2021, the language with the highest number of speakers was Mandarin. 62.7% of people who used Mandarin at home were first generation Australians, born in China. People who spoke Mandarin were also the largest group with low English proficiency (176,000). This represented over one quarter (25.9%) of all speakers of Mandarin and more than one in five of all people that had low English proficiency.

Arabic was the second most used non-English language in 2021. More than half (58.6%) of Arabic speakers were born overseas. The most common countries of birth were Lebanon (20.4%), Iraq (12.0%) and Egypt (7.6%).

Punjabi had the biggest increase in number, with 107,000 more speakers in 2021 than in 2016, an increase of 80.4%. This reflects the increase in migrants from India over the same period. In 2021 almost three quarters (74.3%) of people who used Punjabi at home were born in India.

In 2021, 872,000 people spoke English not well or not at all. This represented 15.1% of the 5.8 million people who used another language at home.

Of those who spoke English not well or not at all, 702,000 (80.4%) were born overseas, more than half of which (59.2%) arrived in Australia more than 10 years ago.

In 2021, almost one third of people who used Khmer at home spoke English not well or not at all, the highest proportion for any language group (32.5%). Most of this group (88.9%) was born in Cambodia.

Top 10(a) languages with the highest proportion of speakers with low English proficiency(b), 2021
 LanguagePersons who used language at home (count)Persons with low English proficiency (count)Proportion with low English proficiency (%) (c)
1Khmer40,03712,90932.5
2Vietnamese320,75897,17630.5
3Hazaraghi41,67812,47830.2
4Chaldean Neo-Aramaic21,6846,32229.3
5Korean115,53131,01827.0
6Assyrian Neo-Aramaic38,53410,18926.6
7Mandarin685,274175,71625.9
8Burmese18,8494,64424.8
9Dari29,8287,04823.8
10Cantonese295,28169,62523.7

(a) Out of 50 largest non-English languages in Australia. (b) Uses other language and speaks English not well or not at all. (c) Excludes people who did not state English language proficiency.

Other languages with the highest proportions of people with low English proficiency include those spoken by people who were born in Iraq, Afghanistan and Pakistan. The number of people born in these countries and living in Australia have increased substantially since 2016.

Of speakers of Hazaraghi with low English proficiency, over two thirds (71.0%) were born in Afghanistan. Hazaraghi was one of the fastest growing languages in 2021. The number of people who used this language at home almost doubled since 2016, increasing from 22,000 to 42,000 in 2021.

Top 10(a) languages with high proficiency in English(b)
 LanguagePersons who used language at home (count)Persons with high English proficiency (count)Proportion with high English proficiency (%)(c)
1Afrikaans49,10548,37498.5
2Dutch27,46926,87597.8
3German69,34267,42697.2
4Filipino90,03387,52297.2
5Tagalog130,266126,32997.0
6French69,84167,28396.3
7Marathi22,08021,25496.3
8Hindi195,658187,50095.8
9Telugu58,78156,27295.7
10Sinhalese85,18081,20795.3

(a) Out of 50 largest non-English languages in Australia. (b) Uses other language and speaks English well or very well. (c) Excludes people who did not state English language proficiency.

Speakers of languages with high English proficiency include those spoken in countries where English is widely spoken and taught (South Africa, the Netherlands and Philippines).

Case studies

India

Nepal

Sources

  1. The Measurement of Ethnicity in the Australian Census of Population and Housing, 1984 (Borrie report); accessed 22/08/2022.
  2. 2109.0 - Census of the Commonwealth of Australia, 1947, Volume III - Statistician's Report Census of Commonwealth of Australia, 1947; accessed 22/08/2022.
  3. Hammerton, J. and Thomson, A. (2005) Ten Pound Poms: Australia's Invisible Migrants, Manchester University Press: Manchester; accessed 22/08/2022.
  4. Immigration: Federation to Century’s end 1901-2000 www.immi.gov.au/media/publications/statistics/federation/federation.pdf; accessed 22/08/2022.
  5. Parliament of Australia (2017), Migration to Australia: a quick guide to the statistics, Migration to Australia; accessed 22/08/2022.
  6. Castles, S. (1994) Italians in Australia: The Impact of a Recent Migration on the Culture and Society of a Postcolonial Nation, University of Wollongong. Wiley Online Library; accessed 22/08/2022.
Back to top of the page