ABS time series spreadsheet user guide
User assistance for ABS time series spreadsheets
Introduction
ABS time series spreadsheets are generally found in the Data Downloads section of statistical releases (Topics) on the ABS website. They contain data from key topic tables in spreadsheet format with a longer time series of the data. In some cases, they provide additional data that has not been included in a topic table or commentary.
Time series data is a collection of well-defined data items obtained through repeated measurements over time and provide the user with;
- consistent and complete series metadata for every series displayed,
- a readily recognised file format (Excel .xlsx) that will 'auto launch' in most business IT environments, and
- a consistent structure and format, including named ranges, that allow clients to base reliable processing systems on.
A list of current Topics that include time series spreadsheets can be found in the ‘List of Time Series Topics 'latest-release' URLs’ section below.
For enquiries regarding ABS time series spreadsheets please contact us.
Structure of ABS time series spreadsheets
Time Series metadata
Metadata is 'data about data'. Time Series metadata items are consistent in both layout and format across all ABS Time Series Spreadsheet available on the ABS web site.
The metadata items describe each series in a consistent manner and facilitates navigation and interrogation of the data held in Time Series Spreadsheets.
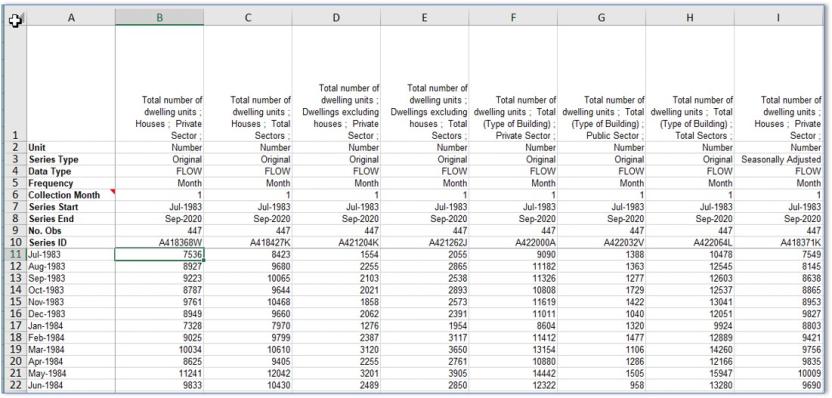
Each time series has 10 key metadata items associated with it:
- Series Description
- Series Type
- Series ID
- Series Start/Series End
- No. Obs (number of observations)
- Unit
- Data Type
- Frequency
- Collection Month
Series Description
Series' descriptions are comprised of one or more Classifications and Parameter Items that have been concatenated to form a meaningful, plain English descriptor for the series. For example, a Labour Force time series may contain three or four classifications relating to the group of data being displayed; eg, Sex (male or female), State (NSW, VIC etc), Status (employed, unemployed) etc.
Series Descriptions do not uniquely identify a Time Series, and must be used in conjunction with other Series metadata, including the title of the Time Series Spreadsheet, to differentiate between similar data items. Series' descriptions are not necessarily unique either across or within ABS Time Series outputs.
Series Type
ABS Time Series data is commonly presented in one or more of three distinct Series Types - Original, Seasonally Adjusted or Trend.
Series ID (Series Identifiers)
Each data series presented in a Time Series File has its own unique Series Identifier which can be used as a unique and stable "key" for selecting and describing a time series.
Two different time series will never share the same ID. In rare cases, the description of a particular time series in a Time Series Workbook may be updated (ie to make it clearer) but if it is conceptually the same series (ie the same data as previously released) then the Series ID will not change in such cases. If a Series ID does change in a Time Series Workbook then it means the series previously released has been replaced by a new series and the data may not be directly comparable.
These properties mean that Series IDs can be a very good way of locating data within a Workbook (or other time series output) either systematically (eg using a "macro") or manually (eg using a "go to" process). They are easier, shorter and more reliable to use than descriptions in this sense. They are also more reliable than "absolute" references (eg "look for the value in eleventh row of the sixth column") because the latter can be invalidated if extra information (eg more time series) are added to a Workbook in future.
Should you have questions about data within the Time Series Workbook, quoting the Series ID will help the ABS know exactly which time series you are seeking more information about. ABS Series IDs start with a letter (always "A"). This ensures they are suitable for use in various products (eg for naming ranges in Excel) where a purely numeric ID would not be suitable. This is followed by a number unique to each series. The ID is completed with a calculated "check character", which helps to identify whether a quoted ID is valid (eg to pick up cases where two digits may have been transposed by mistake).
Series Start/Series End
The reference period, ie, month and year, of the first and last observations available for the Series.
No. Obs.
The number of observations contained in the Series.
Unit
The unit of measure applicable to the Series (eg, '000, $m, Percent)
Data Type
Stock, Flow, Derived
Freq.
The frequency of the observations; usually monthly, quarterly or annual.
Collection Month
Refers to series collected at quarterly and lesser frequencies only. Indicates which month in the collection period the data refers to. For example, for a quarterly series the data may be collected in the first, second or third month in the quarter. The 'Collection Month' would therefore be '1', '2' or '3' respectively.
The 'Index' worksheet
Index Sheet Layout
The Index sheet has a consistent, fixed format across all 'publications' as follows:
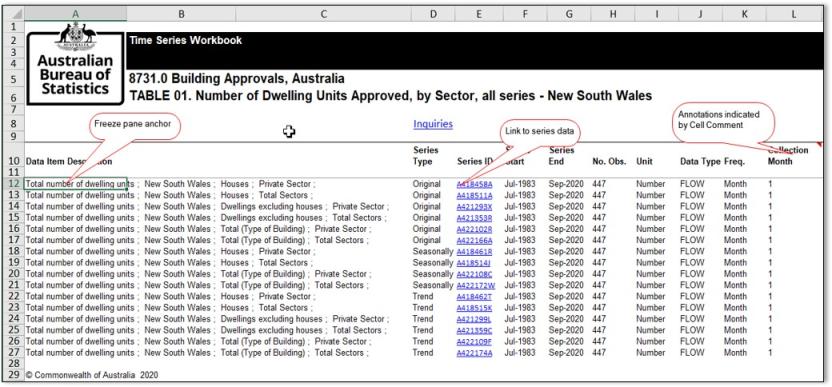
Rows 1 to 11 are dedicated to 'file header' information and include hyperlinks to related information on the ABS website. All labels, the ABS logo and column headings are set in dedicated fields and WILL NOT change due to, for example, the length of a table title being extended.
Cell A12 contains an Excel 'freeze pane' anchor; this allows the user to scroll down through the series while leaving all of the header information visible.

Series Hyperlinks
Column E on the Index sheet contain a unique Series Identifier for each data series contained within the File. The Series Identifiers have little relevance in the context of manual (human) navigation; their primary purpose is to facilitate programmatic access to the Series' data.
However, the Series Identifiers are also hyperlinks to the underlying data series found in the Data sheet/s. On clicking a Series hyperlink, a 'named range' containing the entire Series and its metadata is automatically selected ready for further manipulation, copy/paste, charting etc.
The Series' ranges are given the 'name' of the corresponding Series Identifier. All Named Ranges are also accessible via the Excel menu item "Edit/Go to" or via the Excel shortcut keys <ALT + G> or <F5>. For more information on ABS Time Series Spreadsheets standard 'Named Ranges' please refer to the Named Range tab.
Annotations
There may be additional information available to support ABS time series data. This extra information could apply to individual observations, series', a time period, or all series in an ABS Time Series Spreadsheet. These additional metadata are referred to as Annotations.
Excel 'Cell Comments' (or Cell Notes) have been adopted in ABS Time Series Spreadsheet to provide all relevant annotations. This means that all annotations can be delivered to the user directly in the relevant cell concerned, and in the case of annotations relating to a particular observation in a series, without interfering with the data itself.
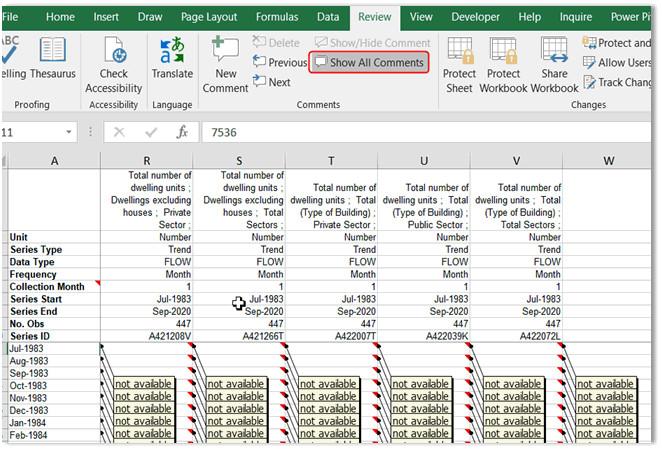
The presence of an annotation (Cell Comment) is indicated by a small red triangle appearing in the top right corner of the cell concerned. When the mouse pointer is hovered over the cell containing a Comment Indicator, the additional information is displayed in a small pop-up.
To view all annotations without hovering over them individually, click on 'Show All Comments' in the Excel 'Review' toolbar.

''Data*' worksheets
A Time Series spreadsheet will contain one or more 'Data' sheets. A single Data sheet may contain up to 255 columns of data. Data sheets are named sequentially, 'Data1', Data2' etc.
The "Data" sheets have been designed specifically to facilitate the integration of ABS Time Series data into client desktop and database systems, particularly Microsoft Office based applications. Data sheets are designed to support the export of the series data and/or metadata contained within via Named Ranges; users should use the 'Index Sheet' for manual navigation (click the Series ID link).
The Data sheet (or sheets) is located 'behind' the Index sheet. All series data and its metadata are located within the Data sheet (or sheets) and are laid out in a consistent, fixed, flat structure conducive to interrogation and manipulation.
The Data sheet has NOT been designed to be navigated by the human eye; the data series' presented here will not necessarily appear in any particular order or grouping. Columns are kept to a manageable, fixed width which hides much of the Series Description.
The data series should be accessed via the Index sheet hyperlinks when performing 'manual' operations or interrogations.

Working with ABS time series spreadsheets
Named Ranges
Named Ranges have been applied to ABS Time Series Spreadsheet extensively to facilitate navigation, interrogation and export of time series data. ABS Time Series Spreadsheets use the uniqueness of the Time Series Identifier (see Metadata) by assigning Names that include the Series ID to ranges of cells associated with that particular Series.
Each Time Series in an ABS Time Series Spreadsheet has three different Named Ranges assigned to it; the Named Ranges refer to ranges present in the Data Sheet/s:
1) The first range is assigned with a name that is the same as the actual Series Identifier (eg, A12345R). This range includes all of the series' metadata and all observations for the series. When you click on a Series ID hyperlink on the Index Sheet of an ABS Time Series Spreadsheet, you will be taken straight to the relevant Named Range (ie, the Series metadata and data will be selected) on the appropriate Data Sheet.
2) The second range is assigned with a name that begins with the Series Identifier and has "_Data" appended to it (eg, A12345R_Data). This range contains only the data component (ie, the series' observations) for the Series.
3) The third is a range assigned with a name that begins with the Series Identifier and has "_Latest" appended to it (eg, A12345R_Latest). This range contains only the latest observation for the Series (ie, a Range comprising of a single cell).
Two additional Named Ranges are present in each ABS Time Series Spreadsheet. These relate to the date range encompassed by the Time Series observations included in the spreadsheet. These ranges are "Date_Range" and "Date_Range_Data".
4) Date_Range includes all observation time points listed in the 'Data' worksheet/s as well as the series metadata headings present in cells A1 to A10 of the same. The metadata headings do not actually relate to the date range as such, but allow for easy alignment of series' and their respective observation points when copy/pasting a series selected via the Index Sheet hyperlink (see Range 1 above) into another spreadsheet.
5) Date_Range_Data includes only the observation points that correspond to the actual data, and should be used in conjunction with series' selected using the 'Range 2' option (see above).
Use the Excel 'Goto' command to see the list of Named Ranges (Find/Select Goto from Home menu bar, F5, Ctrl+G, or click on the Name box)

URLs
Locating the URL for a specific Time Series Spreadsheet file
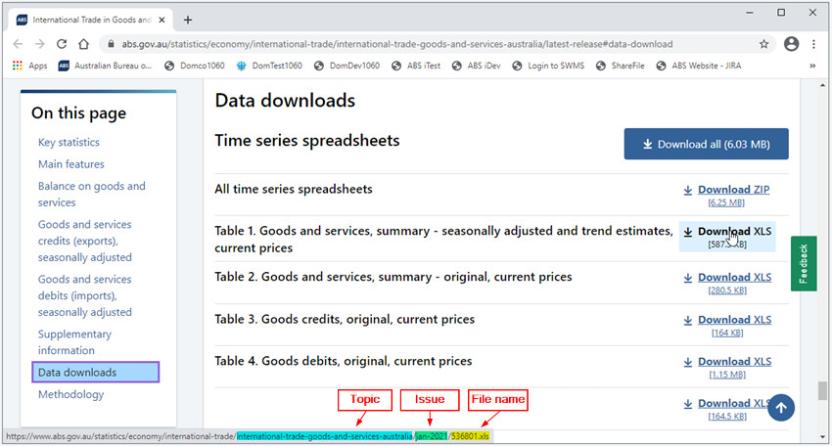
Go to the Data downloads/Time series spreadsheets section of a Topic and hover your mouse over the required time series spreadsheet link to determine the Time Series Spreadsheet URL. The URL will display in the status bar of your browser. To copy the URL, right click while hovering over the file link and select the 'Copy link address' option.

Latest release URLs
To go to the latest release of a Time Series Spreadsheet for a particular Topic, append its file name to the relevant 'latest-release' URL (see the list of Time Series Topics 'latest-release' URLs below). For example:
Or, copy the entire URL (see step 1) and replace the 'Issue' component (usually in the format month-yyyy), with the words 'latest-release'.
List of Time Series Topics 'latest-release' URLs
Bookmarking ABS Time Series Spreadsheets
Users may create 'bookmarks' to a specific issue (Release) of a Time Series Spreadsheet, or, create a persistent link that will always point to the most recent issue of a particular ABS Time Series Spreadsheet.
To bookmark a particular Issue, hover over the link to the spreadsheet on its Topic page and copy the link address. The link address can then be, for example, added to a custom list or used to create a Shortcut.
To bookmark the 'latest' release using a persistent link, copy the link URL address, and replace the Issue details near the end of the URL with 'latest-release'. For example:
becomes
File Lists
If you need to download the latest Time Series Spreadsheets on a reqular basis, you can create a custom list of hyperlinks, using 'latest-release' in place of 'Issue'. For example:
These links are examples of 'persistent' links that will always link to the most recent release of the Time Series Spreadsheet file.
Bookmark lists using Excel
There are a number of advantages to bookmarking ABS Time Series Spreadsheets using Excel. Links are 'active' and can be clicked to download the file directly and meaningful link names can be displayed, rather than the raw URL.
The attached xlsx file (Bookmark lists using Excel - examples.xlsx) provides a number of Excel link examples including links that use the 'HYPERLINK' function and links that link to a specific location in a time series spreadsheet using Named Ranges.
Bookmark lists using Excel - examples.xlsx
Embed values
Using an external reference formula allows you to embed a Time Series Spreadsheet value in your own Excel spreadsheet so that the value/s will dynamically update to 'latest' each time you open or refresh it.
The attached xlsx file (Embed values - example.xlsx) contains formulae that demonstrates the use of external references to cell ranges in select 'latest-release' Time Series spreadsheets.
Embed values - example.xlsx
ABS Time Series Directory
The ABS provide an API for querying & returning a user defined subset of ABS Time Series metadata. The API is designed to be used in a machine-to-machine context.
The metadata returned from a query can be, and is typically used to facilitate the automated download of the ABS Time Series Spreadsheet/s associated with the parameters defined in that query.
For more information about the ABS Time Series Directory service and how to use it see the 'Using the Time Series Directory' page.