Population Projections, Australia

Latest release

Population projections (based on assumptions of fertility, mortality and migration) for Australia, states and territories and capital cities

Reference period
2022 (base) - 2071

Key statistics

  • Australia's population in 2022 (26 million) is projected to reach between 34.3 and 45.9 million people by 2071.
  • The current ten year average annual growth rate (1.4%) is projected to decline to between 0.2% and 0.9%.
  • The median age (38.5 years) is projected to increase to between 43.8 and 47.6 years.

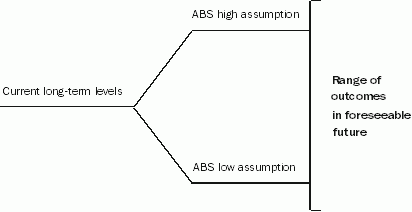
These projections are not predictions or forecasts. They illustrate what would happen to Australia's population if assumed levels of the components of population change (births, deaths and migration) were to occur between 2022 and 2071. 

Users should assess the available assumptions and choose the combination that best suits their needs. 

Assumptions

Introduction

Summary

Projection series

Fertility

Mortality

Net overseas migration

Net interstate migration

National

Assumptions

Population size and change

Australia's population of 26.0 million at 30 June 2022 is projected to:

  • increase by an annual average of between 1.2% and 1.7% until June 2032
  • grow by an annual average of between 0.6% and 1.1% per year over the entire projection period
  • reach between 29.2 and 30.8 million people by 2032, and between 34.3 and 45.9 million people by 2071
     

An assumption of zero net overseas migration has been included to demonstrate the trajectory of Australia's future population relying entirely on natural increase.

Australia's population growth is comprised of natural increase (births minus deaths) and net overseas migration (migrant arrivals minus migrant departures). 

Natural increase

There were 300,700 births and 183,300 deaths during 2021-22, resulting in a natural increase of 117,400 people. 

  • The number of births is projected to increase to between 284,700 and 482,700 births per year by 2071. 
  • The number of deaths is projected to reach between 378,200 and 402,800 by 2071.
  • Natural increase is projected to be between 118,000 (a decrease) and 104,500 people in 2071.
     

Net overseas migration

In all series, overseas migrant arrivals are assumed to exceed departures, resulting in positive net overseas migration between 9.2 million to 14.3 million in total between 2022 and 2071. 

Population by age

States and territories

The high and medium series both project population growth for all states and territories between 2022 and 2071. The low series projects growth for all states and territories except South Australia and Tasmania which would start to decline in 2039 and 2029 respectively. New South Wales is projected to remain as the largest state in all series, reaching over 9 million between 2028 and 2032. 

By 2032: 

  • New South Wales is projected to reach between 9.0 and 9.7 million people
  • Victoria's population is projected to reach between 7.6 and 8.2 million people
  • Queensland is projected to reach between 6.0 and 6.4 million people
  • Western Australia is projected to reach between 3.0 and 3.3 million
  • South Australia's population is projected to be between 1.9 and 2.1 million
  • Tasmania's population is projected to increase to between 579,600 and 645,600
  • the Northern Territory's population is projected to reach between 263,900 and 312,400
  • the population of Australian Capital Territory is projected to reach between 504,800 and 564,200 people. Its medium scenario is projected to exceed Tasmania's medium series population by the year 2048
     
Projected Population, 2071
 High series ('000)Medium series ('000)Low series ('000)
New South Wales13,80912,04510,841
Victoria13,76511,2459,266
Queensland9,7737,9956,839
South Australia2,4682,1871,988
Western Australia3,8954,0003,960
Tasmania843610425
Northern Territory441359337
Australian Capital Territory994740579
Australia(a)45,88939,18534,343
  1. Includes Other Territories comprising Jervis Bay Territory, Christmas Island, the Cocos (Keeling) Islands and Norfolk Island.

Capital cities

At 30 June 2022, 67% of Australians lived in capital cities. This proportion is projected to increase to 68% by 2032.

Melbourne is projected to be the largest city in Australia by 2071 with a projected population between 6.5 million and 9.9 million, surpassing Sydney between 2032 and 2046. 

  • Sydney is projected to remain constant or increase from 65% of the state's population in 2022 to 66% in 2032.
  • Melbourne is projected to remain constant or increase from 76% of Victoria in 2022 to 77% in 2032.
  • Brisbane is projected to increase from 49% of Queensland's population to between 50% and 51% in 2032, becoming the majority part of Queensland's population. 
  • Adelaide is projected to grow from 78% in 2022 to between 79% and 80% in 2032.
  • Perth is projected to remain constant or increase from 80% to 81%.
  • Hobart is projected to increase its share of Tasmania's population, from 44% in 2022 to between 45% and 46% in 2032.
  • Darwin is projected to remain constant or increase its share of the territory’s population from 60% in 2022 to 61% in 2032.

New South Wales

Assumptions

Population size and change

New South Wales' population of 8.2 million is projected to:

  • grow by between 0.4% and 1.2% per year, slightly higher than the average annual growth rate projected for Australia
  • reach between 9.2 million and 9.6 million by 2032, and between 10.8 million and 13.8 million by 2071
  1. Results from low assumptions for fertility, mortality and overseas migration, with small interstate migration flows.
  2. Results from high assumptions for fertility, mortality and overseas migration, with large interstate migration flows. 
     

The largest projected population for New South Wales is obtained by combining the small flows interstate migration assumption with the high assumption for other components. This is because New South Wales experiences negative interstate migration, so smaller flows leads to smaller migration loss. Conversely, the smallest projected population for New South Wales is obtained by combining the large flows interstate migration assumption with the low assumption for other components.

Natural increase

  • In the high series, the number of births is projected to exceed the number of deaths for New South Wales.
  • In the low and medium series, deaths are projected to exceed births from 2044 (low) and 2055 (medium).

The declining natural increase in the medium and low assumption series is due to the lower total fertility rate assumption in these projections.

Net overseas migration

  • Net overseas migration is projected to return to assumed levels between 62,300 (low) and 97,900 (high) per year from 2032.

Net interstate migration

In all series, the projected number of interstate departures exceeds interstate arrivals in all years, resulting in a net interstate migration loss for the entire period. 

Population by age

Victoria

Assumptions

Population size and change

Victoria's population of 6.6 million is projected to:

  • increase by between 0.7% and 1.5% per year, higher than the average annual growth rate projected for Australia
  • reach a population of between 9.3 million and 13.8 million by 2071

Natural increase

  • In the high series, the number of births is projected to exceed the number of deaths for Victoria.
  • In the low and medium series, deaths are projected to exceed births from 2043 (low) and 2056 (medium).

Net overseas migration

  • In all series, arrivals exceed departures, resulting in positive net overseas migration with between 57,400 and 90,200 people added each year from 2032. 

Net interstate migration

  • In the high and medium series, interstate arrivals exceed departures, resulting in a net interstate migration gain of 8,000 and 17,500 people per year respectively from 2027. 
  • The low series assumes a net interstate migration loss of 2,000 people per year from 2027. 
     

Population by age

Queensland

Assumptions

Population size and change

Queensland's population of 5.3 million is projected to:

  • increase by between 0.5% and 1.2% per year, slightly higher than the average annual growth rate projected for Australia
  • reach a population of between 6.8 million and 9.8 million by 2071

Natural increase

  • In the high series, births will continue to exceed the number of deaths for Queensland.
  • In the low and medium series, deaths will exceed births from 2044 (low) and 2056 (medium)

Net overseas migration

  • In all series, arrivals exceed departures, resulting in positive net overseas migration with between 24,200 and 38,000 people added each year from 2032. 

Net interstate migration

  • In all series, interstate arrivals exceed departures for all years, resulting in a net interstate migration gain between 6,000 and 22,000 people per year from 2027. 

Population by age

South Australia

Assumptions

Population size and change

South Australia's population of 1.8 million people is projected to:

  • increase by between 0% and 0.8% per year, a slower rate than that projected for all other states other than Tasmania
  • reach a population of between 1.8 million and 2.7 million people by 2071
  1. Results from low assumptions for fertility, mortality and overseas migration, with small interstate migration flows.
  2. Results from high assumptions for fertility, mortality and overseas migration, with large interstate migration flows. 
     

The largest projected population for South Australia is obtained by combining the small flows interstate migration assumption with the high assumption for other components. This is because South Australia experiences negative interstate migration, so smaller flows leads to smaller migration loss. Conversely, the smallest projected population for South Australia is obtained by combining the large flows interstate migration assumption with the low assumption for other components.

Natural increase

Under the:

  • high series, natural increase is projected for South Australia for the whole period
  • low and medium series, deaths will exceed births in South Australia from 2032 (low) and 2037 (medium)

Net overseas migration

  • Net overseas migration is assumed to increase to 15,700 people per year under the high series and decline to 10,000 people per year under the low series, from 2032. 

Net interstate migration

  • In all series, interstate departures will exceed interstate arrivals for all years, resulting in a net interstate migration loss for the entire period. 
  • This loss is projected to be between 2,500 and 6,000 people per year from 2027. 
     

Population by age

Western Australia

Assumptions

Population size and change

Western Australia's population of 2.8 million is projected to:

  • increase by between 0.1% and 1.2% per year
  • reach a population of between 2.9 million and 5.1 million by 2071
  1. Results from low assumptions for fertility, mortality and overseas migration, with small interstate migration flows.
  2. Results from high assumptions for fertility, mortality and overseas migration, with large interstate migration flows. 
     

The largest projected population for Western Australia is obtained by combining the small flows interstate migration assumption with the high assumption for other components. This is because Western Australia experiences negative interstate migration, so smaller flows leads to smaller migration loss. Conversely, the smallest projected population for Western Australia is obtained by combining the large flows interstate migration assumption with the low assumption for other components.

Natural increase

  • In the high series, births will continue to exceed the number of deaths for Western Australia.
  • In the low and medium series, deaths will exceed births in 2048 (low) and 2053 (medium).

Net overseas migration

  • Overseas arrivals will exceed overseas departures in all series, resulting in positive net overseas migration between 15,200 and 23,900 people from 2032.

Net interstate migration

  • Under the high assumption, net interstate migration is projected to result in a loss of 12,000 people annually from 2027.
  • Under the medium and low assumptions, net interstate migration is projected to gain 500 and 8,000 people per year respectively from 2027. 
     

Population by age

Tasmania

Assumptions

Population size and change

Tasmania's population of 571,000 people is projected to:

  • increase to 843,300 and 609,900 respectively in 2071 under high and medium series
  • decline to 425,400 by 2071 under the low assumption

Natural increase

  • Under all assumptions, the number of deaths will exceed births for most years, leading to natural decrease for Tasmania for these years.
  • Natural decrease is projected from 2027 (low series) and 2043 (high series). 
     

Net overseas migration

  • Overseas arrivals are projected to exceed overseas departures in all series, resulting in positive net overseas migration between 1,800 and 2,800 people per year from 2032. 

Net interstate migration

  • Under the high and low assumptions, net interstate migration is projected to result in a gain of 2,500 and loss of 2,500 people per year respectively from 2027.
  • Under the medium assumption, net interstate migration is projected to be zero (arrivals equal departures) from 2027. 
     

Population by age

Northern Territory

Assumptions

Population size and change

The Northern Territory's population of 250,200 people is projected to:

  • increase by up to 1.6% per year (high) or experience a small decrease of 0.1% per year (low)
  • reach a population between 234,300 and 566,200 by 2071

The largest projected population for the Northern Territory is obtained by combining the small flows interstate migration assumption with the high assumption for other components. This is because the Northern Territory experiences negative interstate migration, so smaller flows leads to smaller migration loss. Conversely, the smallest projected population for the Northern Territory is obtained by combining the large flows interstate migration assumption with the low assumption for other components.

Natural increase

  • In the three series, the number of births will continue to exceed deaths, resulting in natural increase for the Northern Territory. 

Net overseas migration

  • In all series, overseas arrivals will exceed departures resulting in positive net overseas migration between 2,200 and 1,400 people per year from 2032. 

Net interstate migration

  • Under the medium and high assumptions, net interstate migration is projected to result in a loss of 1,500 and 3,000 people per year respectively from 2027.
  • Under the low assumption, net interstate migration is projected to gain 1,000 annually people from 2027.
     

Population by age

Australian Capital Territory

Assumptions

Population size and change

The Australian Capital Territory’s population of 456,900 people is projected to:

  • increase between 0.5% and 1.6% per year 
  • reach between 578,700 and 994,500 by 2071
     

Natural increase

  • In the medium and high series births will exceed the number of deaths over the projection period, resulting in natural increase for the Australian Capital Territory. 
  • In the low series, deaths will exceed births in 2053.

Net overseas migration

  • Net overseas migration is projected to return to longer term averages.
  • Overseas arrivals will exceed overseas departures in all series, resulting in a net overseas migration gain of between 2,800 and 4,400 people per year from 2032. 
     

Net interstate migration

  • Under the medium and high assumptions, net interstate migration is projected to result in a gain of 500 and 3,000 people per year from 2027. 
  • Under the low assumption, net interstate migration is projected to result in a loss of 1,000 people per year from 2027.
     

Population by age

Data downloads

note

Time series spreadsheets

Data files

Data cube

Projected population, components of change and summary statistics - Australia, state/territory, greater capital city and rest of state, 2022 (base) to 2071

Projection assumptions (detailed)

Previous catalogue number

This release previously used catalogue number 3222.0.
 

Post release changes

03/04/2024 - As advertised in the main release of this publication on 23 November 2023, the projection assumptions (detailed) datacube is now available under the Data downloads section.

Back to top of the page