Innovation in Australian Business

Latest releaseData download

Statistics in this release present key innovation data for Australian businesses, as collected from the 2022-23 Business Characteristics Survey (BCS).

Reference period
2022-23 financial year

Key statistics

  • In the two-year period ended 30 June 2023, under half of all businesses (46%) reported being innovation-active.
  • Approximately one third of innovating businesses reported obtaining environmental benefits as a result of the introduction of new or significantly improved goods and/or services (33%) or processes (32%).
  • Of the innovation-active businesses, 33% collaborated and/or had a fee-for-service arrangement for innovation.

There are upcoming changes to the Innovation in Australian Business release. 

See ‘Survey impacts and changes’ for more information.

Innovation in Australian Business 2022-23 is the second release of the redeveloped innovation module. 

This release will be the first with directly comparable data for the redeveloped survey.

Customised data requests are also available on request. Please see Contact Us page.

Innovation activity

An innovation-active business is one that introduced any type of innovation (i.e., new good, service or process), and/or had innovation which was still in development (as of 30 June 2023) or abandoned during the reference period (i.e., the two years ended 30 June 2023). 

An innovating business is one that introduced any type of innovation (i.e., any new good, service and/or process) during the reference period (i.e., the two years ended 30 June 2023).

Innovation status (a)(b)(c), by employment size, two years ended 30 June 2023 (%)

Innovation status (a)(b)(c), by employment size, two years ended 30 June 2023 (%)
Businesses with innovative activity which was:0-4 persons5-19 persons20-199 persons200 or more personsTotal
introduced (innovating businesses)3446575739
still in development(b)1929394523
abandoned913161311
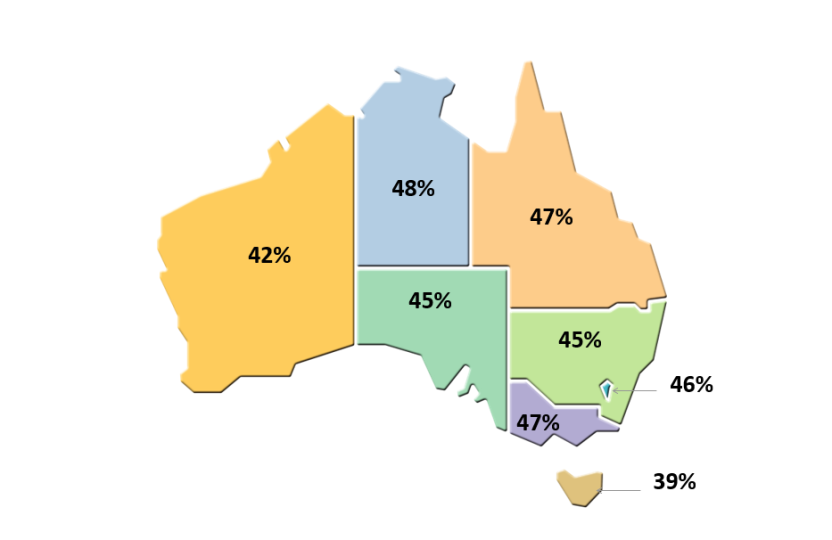
any innovative activity (innovation-active businesses)4054656346
  1. Proportions are of all businesses.
  2. As at 30 June 2023.
  3. Businesses could report more than one innovation activity.

For the two years ended 30 June 2023, estimates for the core innovation indicators (i.e., innovation-active, and innovating businesses) were 46% and 39% respectively, compared to 52% and 45% for the two years ended 30 June 2021.

Types of innovation in Australian business (a)(b), by employment size, two years ended 30 June 2023 (%)

Types of innovation in Australian business (a)(b), by employment size, two years ended 30 June 2023 (%)
Types of innovation0-4 persons5-19 persons20-199 persons200 or more personsTotal
Goods or services2023342622
Process2539485331
  1. Proportions are of all businesses.
  2. Businesses could report more than one innovation activity.

For the two-year reference period ended 30 June 2023:

  • 22% of businesses reported introducing a goods and/or services innovation which remained unchanged from the two years ended 30 June 2021.
  • 31% of businesses introduced a process innovation, compared to 40% for the two years ended 30 June 2021.

Proportion of innovation-active businesses (a), by state/territory, two years ended 30 June 2023

This map of Australia expresses the proportion of innovation-active businesses, by state/territory, two-years ended 30 June 2023. There is one footnote attached to the image.
  1. Proportions are of all businesses in each state/territory.

Innovation-active businesses (a), by industry, two years ended 30 June 2023

Innovation-active businesses (a), by industry, two years ended 30 June 2023

Bar chart with 17 bars.
The chart has 1 X axis displaying .
The chart has 1 Y axis displaying %. Data ranges from 34 to 63.
End of interactive chart.
  1. Proportions are of all businesses in each industry.

Environmental benefits obtained as a result of innovation

For the first time, businesses that reported innovation activity were asked whether any environmental benefits were obtained as a result of innovation activity.

For the two years ended 30 June 2023:

  • 33% of innovating businesses reported environmental benefits obtained as a result of the introduction of new or significantly improved goods and/or services.
  • 32% of innovating businesses reported environmental benefits obtained as a result of the introduction of new or significantly improved processes.

Environmental benefits obtained from goods and/or services innovation (a)(b), two years ended 30 June 2023

Environmental benefits obtained from goods and/or services innovation (a)(b), two years ended 30 June 2023

Bar chart with 5 bars.
The chart has 1 X axis displaying .
The chart has 1 Y axis displaying %. Data ranges from 7 to 16.
End of interactive chart.
  1. Proportions are of innovating businesses in each category.
  2. Businesses could report more than one type of environmental benefit of innovation.

Environmental benefits obtained from process innovation (a)(b), two years ended 30 June 2023

Environmental benefits obtained from process innovation (a)(b), two years ended 30 June 2023

Bar chart with 7 bars.
The chart has 1 X axis displaying .
The chart has 1 Y axis displaying %. Data ranges from 3 to 14.
End of interactive chart.
  1. Proportions are of innovating businesses in each category.
  2. Businesses could report more than one type of environmental benefit of innovation.

Barriers to innovation

For the two years ended 30 June 2023, 42% of businesses reported barriers to innovation, down from 46% reported in the two years ended 30 June 2021.

Barriers to innovation (a)(b), by type of barrier, two years ended 30 June 2023

Barriers to innovation (a)(b), by type of barrier, two years ended 30 June 2023

Bar chart with 8 bars.
The chart has 1 X axis displaying .
The chart has 1 Y axis displaying %. Data ranges from 2 to 19.
End of interactive chart.
  1. Proportions are of all businesses.
  2. Businesses could report more than one barrier.

Collaboration and Fee-for-service arrangements for innovation

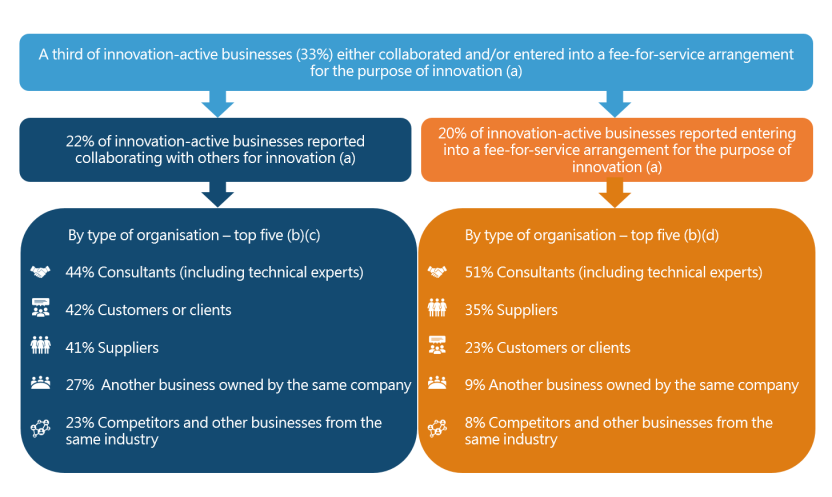
Businesses that reported innovation activity were asked if they collaborated with others to develop or introduce new goods, services or processes in the two years ended 30 June 2023.

Innovation-active businesses were also asked whether they entered into any fee-for-service arrangements to develop or introduce new goods, services, or processes.

A third of innovation-active businesses (33%) either collaborated and/or entered into a fee-for-service arrangement for the purpose of innovation, compared to 36% in the two years ended 30 June 2021.

Collaboration and/or Fee-for-service arrangements, by type of organisation (a)(b)(c)(d), two years ended 30 June 2023

The image contains five rectangular boxes representing Collaboration and/or Fee-for-service arrangements, by type of organisation, during the two years ended 30 June 2023. There are four footnotes attached to the image.
  1. Proportions are of all innovation-active businesses in each category.
  2. Businesses could report more than one category.
  3. Proportions are of all innovation-active businesses that collaborated for the purpose of innovation.
  4. Proportions are of all innovation-active businesses that entered into a fee-for-service arrangement for the purpose of innovation.

Collaborative arrangements, by type of arrangement (a)(b), two years ended 30 June 2023

Collaborative arrangements, by type of arrangement (a)(b), two years ended 30 June 2023

Bar chart with 9 bars.
The chart has 1 X axis displaying .
The chart has 1 Y axis displaying values. Data ranges from 4 to 37.
End of interactive chart.
  1. Proportions are of innovation-active businesses that collaborated for the purpose of innovation. 
  2. Businesses could report more than one type of collaborative arrangement.

Barriers to collaboration for innovation

In the two years ended 30 June 2023, 48% of innovation-active businesses reported factors that prevented or limited collaboration for innovation, compared to 50% reported in the two years ended 30 June 2021.

Barriers to collaboration for innovation (a)(b), by type of barrier, two years ended 30 June 2023

Barriers to collaboration for innovation (a)(b), by type of barrier, two years ended 30 June 2023

Bar chart with 12 bars.
The chart has 1 X axis displaying .
The chart has 1 Y axis displaying %. Data ranges from 1 to 26.
End of interactive chart.
  1. Proportions are of innovation-active businesses in each category.
  2. Businesses could report more than one factor that prevented or limited collaboration with others for innovation and were not asked to rank factors in order of significance.

Innovation expenditure

Businesses that reported innovation activity were asked to estimate the expenditure (using ranges) on the development or introduction of new or significantly improved goods and/or services or processes during the year ended 30 June 2023.

Business expenditure on innovation activities may include expenditure on labour costs, training, external services, materials, Research and Experimental Development (R&D), capital goods, etc. related to the new or significantly improved goods and/or services or processes.

Of innovation-active businesses:

  • 70% reported any innovation expenditure.
  • 44% reported innovation expenditure in the range of $1 to less than $25,000. 
  • Less than 1% reported innovation expenditure of $5,000,000 or more.

Amount spent on innovation expenditure, by employment size (a), year ended 30 June 2023 (%)

Amount spent on innovation expenditure, by employment size (a), year ended 30 June 2023 (%)
0-4 persons5-19 persons20-199 persons200 or more personsTotal
No expenditure3227241330
$1 to less than $25,0004942281244
$25,000 to less than $50,00091512711
$50,000 to less than $100,000671197
$100,000 to less than $250,000349154
$250,000 to less than $1,000,000139223
$1,000,000 to less than $5,000,000npnp6151
$5,000,000 or morenpnp17-

        np not available for publication but included in totals where applicable, unless otherwise indicated.

       - nil or rounded to zero (including null cells).

  1. Proportions are of innovation-active businesses in each expenditure category.

Innovation expenditure by type of activity

Innovation-active businesses that reported innovation expenditure were also asked to provide a percentage breakdown of their innovation related expenditure against a list of activities related to innovation.

Where a business reported any percentage, they were deemed to have undertaken that activity.

Innovation expenditure (a)(b), by type of activity, year ended 30 June 2023 (%)

Innovation expenditure (a)(b), by type of activity, year ended 30 June 2023 (%)
Innovation-active businesses
Acquisition of machinery, equipment or technology to develop or introduce new or significantly improved goods, services or processes41
Marketing activities undertaken to introduce new or significantly improved goods and/or services37
Training relevant to the development or introduction of new or significantly improved goods, services or processes37
Other labour costs related to the development or introduction of new or significantly improved goods, services or processes not included in other categories35
Re-organisation of existing business models, work practices and decision making processes31
Design, planning or testing to develop or introduce new or significantly improved goods, services or processes31
Research and Experimental Development performed by this business31
Acquisition of licenses, rights, patents or other intellectual property17
Research and Experimental Development acquired from other businesses or institutions11
Other activities related to the development or introduction of new or significantly improved goods, services or processes6
  1. Proportions are of innovation-active businesses that reported innovation expenditure in each activity category.
  2. A detailed definition of Research and Experimental Development was not provided. No interpretation checks were made.

Outcomes of innovation

Percentage of income from the sale of new or significantly improved goods and/or services.

For the year ended 30 June 2023, innovating businesses were asked to estimate the percentage of income that resulted from the sale of new or significantly improved goods and/or services.

Percentage of income from the sale of new or significantly improved goods and/or services (a)(b), by employment size, year ended 30 June 2023

Percentage of income from the sale of new or significantly improved goods and/or services (a)(b), by employment size, year ended 30 June 2023

Bar chart with 6 data series.
The chart has 1 X axis displaying .
The chart has 1 Y axis displaying %. Data ranges from 11.111111111111 to 100.
End of interactive chart.
  1. Percentage of businesses with goods and/or services innovation in each category.
  2. The sum of the component items may not equal 100% due to rounding.

Percentage of cost savings due to new or significantly improved process.

Innovating businesses were also asked to estimate the percentage of cost savings that resulted from the introduction of new or significantly improved processes. 

Percentage of cost savings due to new or significantly improved processes (a)(b), by employment size, year ended 30 June 2023

Percentage of cost savings due to new or significantly improved processes (a)(b), by employment size, year ended 30 June 2023

Bar chart with 5 data series.
The chart has 1 X axis displaying .
The chart has 1 Y axis displaying %. Data ranges from 13 to 100.
End of interactive chart.
  1. Percentage of businesses with process innovation in each category.
  2. The sum of the component items may not equal 100% due to rounding.

Most significant innovation

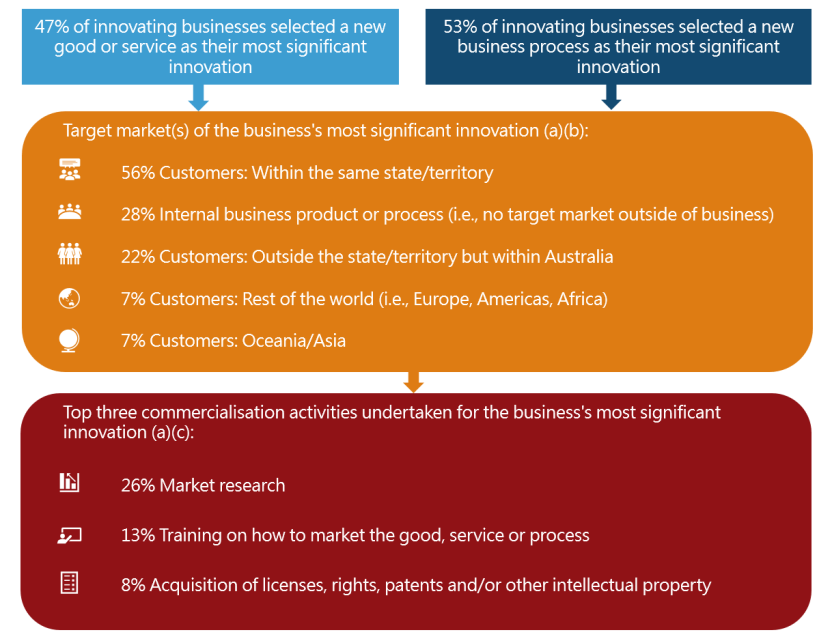
Innovating businesses were asked to provide details about their most significant innovation introduced during the two years ended 30 June 2023.

Most significant innovation introduced (a), target markets and commercialisation activities undertaken (b)(c), two years ended 30 June 2023

The image contains four rectangular boxes representing the most significant innovation introduced, as reported by innovating businesses, by target market(s) of the business’s most significant innovation, and top three commercialisation activities undertaken for the business’s most significant innovation, in the two years ended 30 June 2023. There are three footnotes attached to the image.
  1. Proportions are of innovating businesses in each category.
  2. Businesses could select more than one target market.
  3. Businesses could report more than one source of commercialisation activity and were not asked to rank factors in order of significance.

Data downloads

Data cube spreadsheets

Data files

Data Explorer datasets

Caution: Data in Data Explorer is currently released after the 11:30am release on the ABS website. Please check the reference period when using Data Explorer.

Previous catalogue number

This release previously used catalogue number 8158.0

Survey impacts and changes

Upcoming changes to ‘Innovation in Australian Business’ release

The ABS reviews and makes changes to its Forward Work Program to ensure it continues to appropriately measure the Australian economy, environment and society. The increasing appreciation of the value of data is generating significant additional demand for services of the ABS. As the growth in opportunities exceeds the capacity of the ABS, statistical outputs are prioritised. As a result of prioritisation, there will be changes to the Innovation in Australian Business release. 

From 2024-25 the Business Characteristics Survey will move to a biennial frequency, that is, collecting and publishing data every second year, rather than every year. 

Given the change in frequency, the ABS is currently reviewing what data will be collected in the survey, as well as publication content, to ensure we can continue to provide high quality business characteristics data that is important to users, on the new biennial frequency. 

The ABS invites feedback through the ABS Consultation Hub, and will make decisions on changes to the collection based on the information gathered in this consultation.