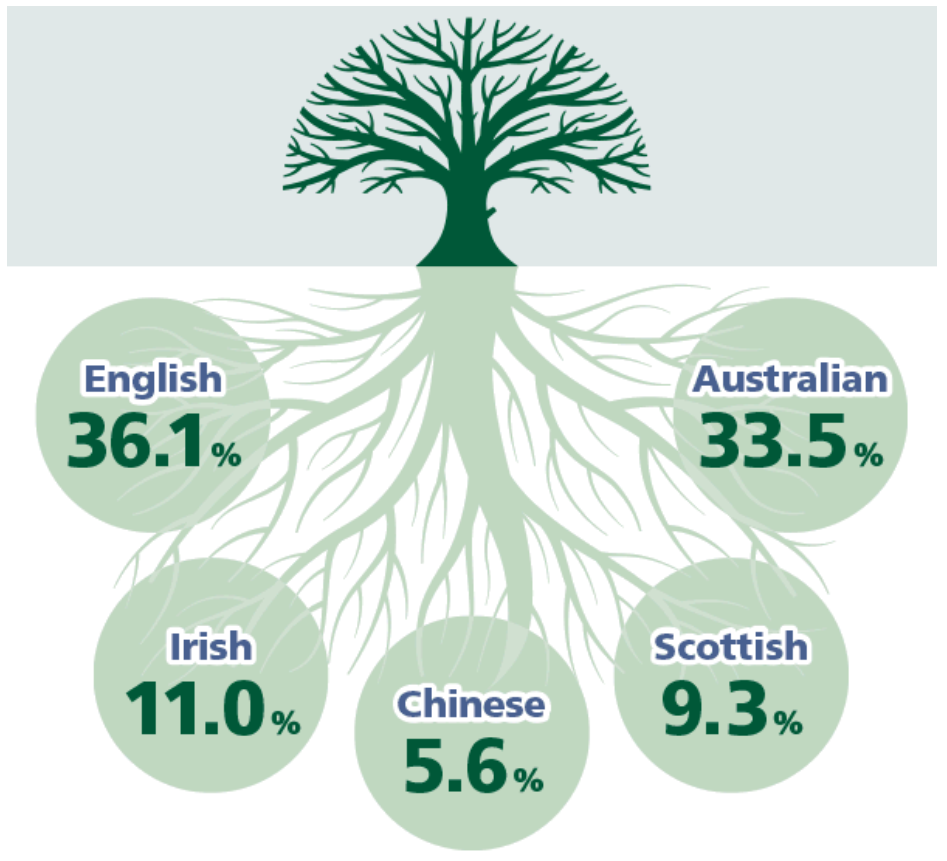
The 2016 Census was an exciting period of time, with the results revealing a great deal of information of who we are as a nation. For many of us though, digging through all the hard coded numbers and endless tables of data is not easy - thankfully that's not the only way to access the information. Interesting articles have been written, colourful infographics have been drawn and stories using the data have been told to give a helpful overview of the Census.

Data in Pictures
Data in pictures provides an overview of Australia, States, Territories and Capital Cities through the medium of infographics; helpful, easy to ready images that capture the hot topics from the 2016 Census.

Reflecting Australia
New insights released into education, work, the ageing population and Aboriginal and Torres Strait Islander peoples on October 23 2017.
Reflecting Australia provides indepth articles and stories that capture significant results from the 2016 Census, converting the raw data into coherent and understandable narratives and diagrams. Here you can read on some of the important topics such as Cultural Diversity, Sex and Gender, and Religion.

The Typical Australian
The first insights from the 2016 Census was the Typical Australian, a broad overall look at the data that gave some fun results about who the 'typical' person was from Australia and each of its states.

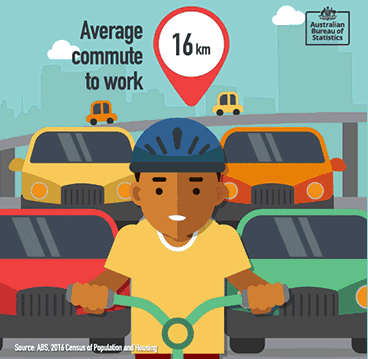
Commuting to Work
Most Australian workers need to travel to get to their job. Commuting to Work provides insights into commuting behaviours, including stories about the distances travelled by workers, how and where people commute to (and from) work, and interactive maps allowing you to find out more information about commuting patterns in your local area.

Australia Revealed - Census data release, June 2017
Australia is a large, diverse country. The article Australia Revealed provides a great overview of the 2016 Census and its emerging results, letting us know who we are, how we live and where we come from.