This publication has been externally peer-reviewed. The ABS greatly values the knowledge, expertise and contributions of these reviewers and thanks them for their time and input.
Understanding change in counts of Aboriginal and Torres Strait Islander Australians: Census
Latest release
Analysis of change in counts of Aboriginal and Torres Strait Islander Australians in the 2021 Census
Reference period
2021
Released
4/04/2023
Key statistics
- 812,728 people identified as being of Aboriginal and/or Torres Strait Islander origin in the 2021 Census – up 25.2% (163,557 people) from 2016.
- 76.2% of the increase was in the 0-19 year age cohort.
- 43.5% of the increase was due to demographic factors – births, deaths and migration.
About this release
This release provides initial insight into the change in counts of Aboriginal and Torres Strait Islander people between the 2016 and 2021 Censuses.
Counts of people who identified as being of Aboriginal and/or Torres Strait Islander origin in the Census inform other statistics such as Australia’s official population estimates. Understanding changes in people who identified as being of Aboriginal and/or Torres Strait Islander origin is important when analysing and interpreting Census data.
Similar analysis has been undertaken after the past few Censuses as we work to understand the ongoing increases in the counts and improve data about, and for, people who identify as being of Aboriginal and/or Torres Strait Islander origin, from the Census and other sources.
Further analysis using longitudinal data to explore change in identification between Censuses as well as further geographic breakdowns (including Remoteness) is planned. These analyses are expected to be released later in 2023 and in early 2024.
The ABS is also exploring opportunities afforded by administrative data to improve population data for Aboriginal and Torres Strait Islander Australians, as recommended by the 2021 Census Statistical Independent Assurance Panel.
Aboriginal and/or Torres Strait Islander status in the Census
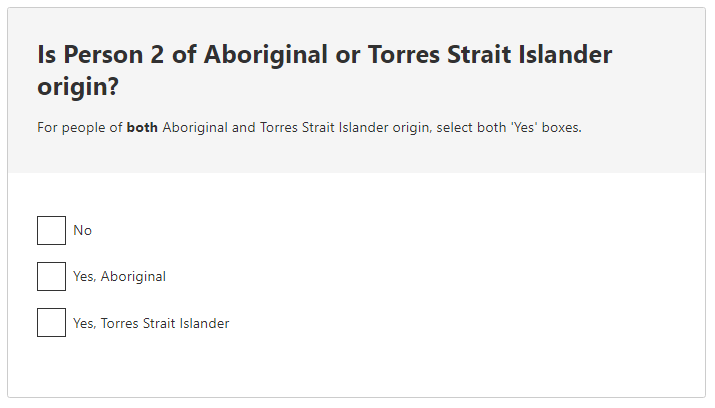
In the Census, the method for collecting information about people who identified as being of Aboriginal and/or Torres Strait Islander origin is through self-identification. The Census uses the ABS Standard Indigenous Question which asks:
Image
Description
The image is a snapshot of the Standard Indigenous Question in the Census.
The question is:
Is Person 2 of Aboriginal or Torres Strait Islander origin?
For people of both Aboriginal and Torres Strait Islander origin, select both 'Yes' boxes.
The response options are:
No
Yes, Aboriginal
Yes, Torres Strait Islander
This question may be completed by the individual or by another member of the household on their behalf.
This release refers to people who identified as being of Aboriginal and/or Torres Strait Islander origin as 'people who identified as Aboriginal and/or Torres Strait Islander' and in tables and graphs as 'Aboriginal and Torres Strait Islander persons'.
Overview of the change
There were 812,728 people who identified as being of Aboriginal and/or Torres Strait Islander origin counted in the 2021 Census – up from 649,171 in 2016. This represents an increase of 25.2% or 163,557 people and was higher than the increase between 2006 and 2011 (20.5%) and between 2011 and 2016 (18.4%).
| Count of persons (no.) | Intercensal change (no.) | Intercensal change (%) | |
|---|---|---|---|
| 2006 | 455,028 | 45,025 | 11.0 |
| 2011 | 548,368 | 93,340 | 20.5 |
| 2016 | 649,171 | 100,803 | 18.4 |
| 2021 | 812,728 | 163,557 | 25.2 |
Data is based on place of usual residence. Excludes overseas visitors.
Source: Census of Population and Housing, 2006, 2011, 2016 and 2021.
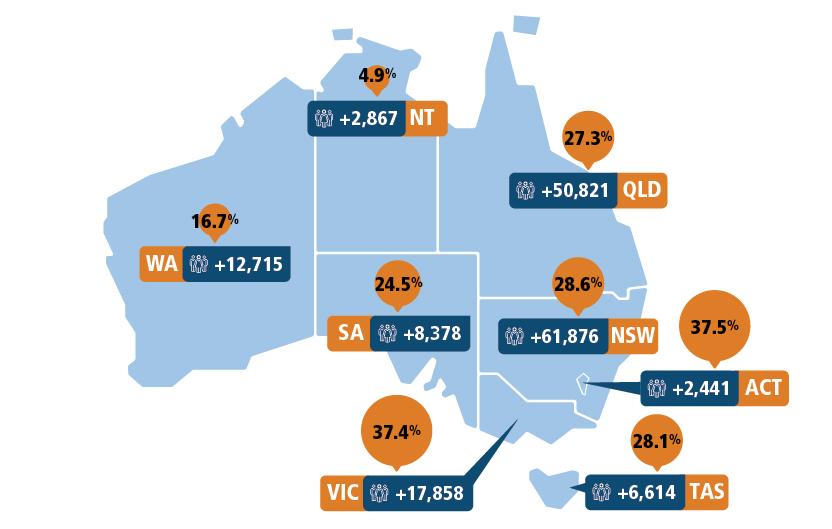
All states and territories recorded an increase in the number of people who identified as Aboriginal and/or Torres Strait Islander between 2016 and 2021:
- the largest increases in Census counts were in New South Wales (up 61,867 people), Queensland (up 50,821 people), and Victoria (up 17,858 people).
- the largest proportional increases were in the Australian Capital Territory (up 37.5%), Victoria (up 37.4%) and New South Wales (up 28.6%).
Figure 1. Census counts and intercensal change by state and territory, Aboriginal and Torres Strait Islander persons, 2016-2021
Image
Description
The map of Australia shows the change in Census counts of Aboriginal and Torres Strait Islander Australians between 2016 and 2021 in whole number and percent for states and territories. All states and territories recorded an increase in the number of people who identified as Aboriginal and/or Torres Strait Islander between 2016 and 2021. New South Wales had the largest numerical increase (61,867) followed by Queensland (50,821) and Victoria (17,858). The Australian Capital Territory had the largest proportional change (37.5%), followed by Victoria (37.4%) and New South Wales (28.6%). The Northern Territory had the smallest proportional increase (4.9%) followed by Western Australia (16.7%).
Data is based on place of usual residence. Excludes overseas visitors.
Source: Census of Population and Housing, 2016 and 2021.
Data is based on place of usual residence. Excludes overseas visitors.
Source: Census of Population and Housing, 2006, 2011, 2016 and 2021.
More than three-quarters (76.2%) of the increase in Census counts is attributed to people aged 0-19 years in 2021:
- 52.5% of the increase was due to 0-4 year olds (new births).
- 23.7% of the increase was due to 5-19 year olds.
All other age cohorts made small contributions to the change in Census counts. This is largely consistent with trends observed in the 2011-2016 intercensal increase, except for:
- the proportion of change attributable to 0-4 year olds was higher in 2011-2016 (72.7%).
- the proportion of change attributable to 5-19 year olds was lower in 2011-2016 (16.2%).
- a decrease in the 20-24 year cohort in 2011-2016 (-1.7%) and an increase (2.6%) in 2016-2021.
The contribution of males and females to the change in counts was similar for all age groups.
Data is based on place of usual residence. Excludes overseas visitors.
Source: Census of Population and Housing, 2011, 2016 and 2021.
Understanding the change
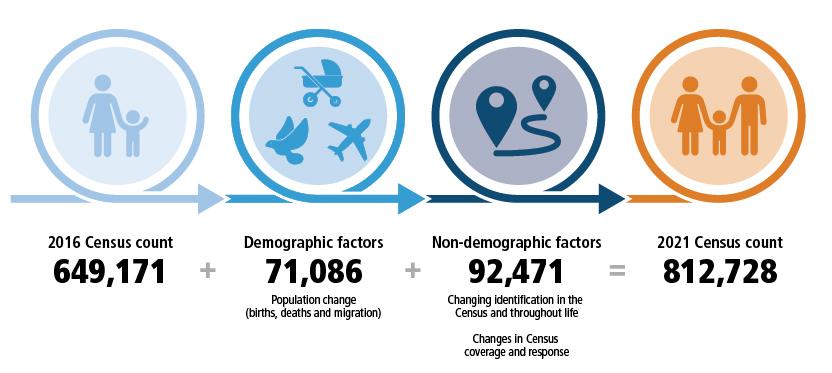
Changes in the number of people who identified as Aboriginal and/or Torres Strait Islander in the Census can be understood by looking at demographic factors and non-demographic factors.
Figure 2: Census counts and demographic and non-demographic factors of change
Image
Description
The diagram shows the components of change in Census counts of people who identified as Aboriginal and/or Torres Strait Islander between 2016 and 2021. The 2016 Census count was 649,171 people. Between the 2016 and 2021 Census, 71,086 came into the population through demographic factors and 92,471 people came into the population through non-demographic factors. This resulted in a 2021 Census count of 812,728 people.
Demographic change approximated using Census births (0-4 year olds), registered deaths and migration information from Census Place of usual residence five years ago (PUR5P).
Source: Census of Population and Housing, 2011, 2016 and 2021, ABS Death Registrations.
Demographic factors refer to people coming in and out of the population and comprise:
- Births – people coming into the population. This is measured using counts of children aged under five years in the Census[1].
- Deaths – people leaving the population. This is measured using the number of death registrations during the intercensal period for people born before the previous Census.
- Overseas migration – people coming into the population via intercensal migration to Australia. This is measured using the Census variable Place of usual residence five years ago (PUR5P).
- Internal migration – the flow of people (incoming and outgoing) at State level and sub-state regions within Australia. This is measured using the Census variable Place of usual residence five years ago (PUR5P).
Non-demographic factors include:
- Changes in whether a person identifies (or was identified) as Aboriginal and/or Torres Strait Islander in a particular Census.
- Changes in Census coverage and response, for example people who did not complete a Census form in 2016 but did complete a Census form in 2021.
Updated methodology for measuring demographic change
The methodology for measuring demographic change has been updated from previous releases of this publication to use Census counts of children aged under five years instead of registered births.
While registered births are demographic in nature, including them in the measurement of change masks some of the non-demographic change that occurs between Censuses. Using Census counts of children aged under five years brings more consistency in data sources used in the calculation of demographic change.
Registered births still provide valuable insight when understanding change over multiple Censuses (using age cohort analysis), and they are used in this context in this release.
More information on this change in method is available in the methodology.
Data quality considerations
Understanding the limitations of the data used to quantify demographic factors is important when interpreting change. Caution should be exercised when interpreting Aboriginal and Torres Strait Islander data used to quantify demographic factors.
Each Census is unique and captures the population in different ways. The quality of the Census is measured in several ways, including:
- The overall response rate indicates how well people engaged with the Census and provided a response.
- Item response rates indicate how many people responded to a particular question on the Census – in this context the Indigenous status question.
- The Post Enumeration Survey measures the coverage of the Census providing a net undercount rate which is used to inform official population estimates.
Varying undercoverage and changing identification across different data sources, and across time, make comparisons difficult. Linking data across Censuses is the best way to understand these changes, and the ABS is planning further analysis for the 2021 Census.
More information about the considerations outlined above is available in methodology.
2016-2021 demographic and non-demographic change
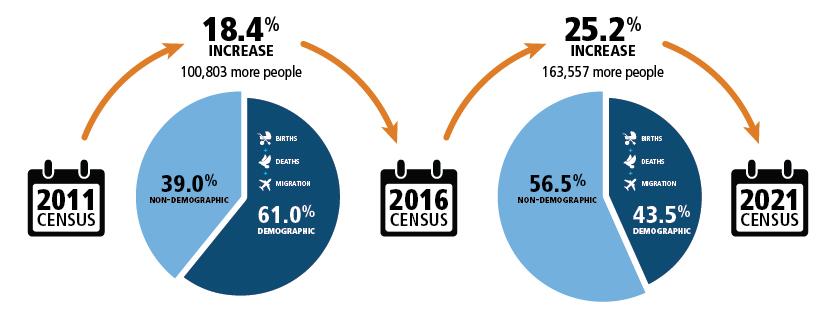
Less than half (43.5%) of the change in counts between 2016 and 2021 was demographic – comprising births, deaths and migration. The remaining 56.5% was non-demographic. This is different to the change in counts between 2011 and 2016.
Figure 3. Components of the change in Census counts, 2011-2021
Image
Description
The pie chart shows how much of the change in Census counts of Aboriginal and Torres Strait Islander Australians between 2011 and 2016 and 2016 and 2021 can be attributed to demographic and non-demographic factors. Of the change in census counts between 2011 and 2016, 61.0% was demographic and 39.0% was non-demographic. This is different to the change between 2016 and 2021 where 43.5% of the change was demographic and 56.5% was non-demographic.
Source: Census of Population and Housing, 2011, 2016 and 2021, ABS Death Registrations.
The demographic and non-demographic factors of change are discussed in further detail in demographic change and non-demographic change.
Demographic change
Less than half (43.5%) of the increase in counts between 2016 and 2021 was demographic (71,086) – comprising births, deaths and migration. This was lower than observed in 2011-2016 (61.0%) and 2006-2011 (61.3%).
The total demographic change of 71,086 people in 2021 represents an 11.0% increase in the number of people who identified as Aboriginal and/or Torres Strait Islander in the 2016 Census, similar to 2016 (11.2%) and 2011 (12.6%).
The Census count of 0-4 year olds was the largest component of demographic change in 2016-2021 – the same as in 2006-2011 and 2011-2016.
Population change due to overseas migration continues to account for less than 2 per cent of the total change in Census counts of people who identified as Aboriginal and/or Torres Strait Islander.
| 2011 | 2016 | 2021 | |
|---|---|---|---|
| Census count | 548,368 | 649,171 | 812,728 |
| increase from previous Census (no) | 93,340 | 100,803 | 163,557 |
| increase from previous Census (%) | 20.5% | 18.4% | 25.2% |
| Demographic change | 2006 – 2011 | 2011 – 2016 | 2016 – 2021 |
| births between Censuses (Census count of 0-4 year olds) | 67,416 | 73,265 | 85,941 |
| minus registered deaths (a) | 11,544 | 13,777 | 17,713 |
| plus overseas migration (b) | 1,375 | 1,969 | 2,858 |
| Equals net demographic change | 57,247 | 61,457 | 71,086 |
| demographic change as a proportion of intercensal change (%) | 61.3% | 61.0% | 43.5% |
| demographic change as a proportion of previous Census count (%) | 12.6% | 11.2% | 11.0% |
Data is based on place of usual residence. Excludes overseas visitors.
a. Registered deaths of that occurred between the Census and for people born on or before the previous Census night.
b. Using information from the Census question identifying where the person lived five years ago.
Please note that there are small random adjustments made to all cell values to protect the confidentiality of data. These adjustments may cause the sum of rows or columns to differ by small amounts from table totals.
Source: Census of Population and Housing, 2006, 2011, 2016 and 2021, ABS Death Registrations.
Comparison of registered births with Census counts of 0 - 4 year olds
Consistent with previous Censuses, there were fewer Aboriginal and Torres Strait Islander 0-4 year olds (new births) counted in the 2021 Census compared with the numbers of registered births between the 2016 and 2021 Censuses.
Differences between Census counts of new births (0-4 year olds) and registered births may be due to:
- 0-4 year olds being missed entirely in the Census. The 2021 Post Enumeration Survey notes that in the total population, young children are often mistakenly omitted from Census forms resulting in a net undercount of 1.7% for this age group, or
- 0-4 year olds inconsistently identified in the Census compared with birth registrations.
Table 3 shows that the 2021 Census counted 85,941 children aged 0-4 years and that this was 80.1% of the 107,272 registered births between 2016-2021, a similar proportion to that in 2011-2016 (80.0%).
| Registered Births (no.) | Census count of 0-4 year olds (no.) | Difference between Census count and registered birth count (no.) | Proportion of Census count to registered birth count (%) | |
|---|---|---|---|---|
| 2006-2011 | 76,378 | 67,415 | 8,963 | 88.3 |
| 2011-2016 | 91,608 | 73,265 | 18,343 | 80.0 |
| 2016-2021 | 107,272 | 85,941 | 21,331 | 80.1 |
Data is based on place of usual residence. Excludes overseas visitors.
Please note that there are small random adjustments made to all cell values to protect the confidentiality of data. These adjustments may cause the sum of rows or columns to differ by small amounts from table totals.
Source: Census of Population and Housing, 2006, 2011, 2016 and 2021, ABS Birth Registrations.
Non-demographic change
Indicators of non-demographic change are complex to quantify. They include:
- Unexpected changes in age cohorts.
- Changes in whether a person identifies as being of Aboriginal and/or Torres Strait Islander origin in the Census.
- Changes in Census coverage and response.
After accounting for demographic change, just over half (56.5% or 92,471 people) of the change in counts between 2016-2021 was non-demographic. This is higher than observed between 2011-2016 (39.0%) and 2006-2011 (38.7%).
The total non-demographic change of 92,471 people in 2021 represents a 14.2% increase in the number of people who identified as Aboriginal and/or Torres Strait Islander in the 2016 Census. This is higher than observed in 2016 (7.2%) and 2011 (7.9%).
| Total non-demographic change (no.) | Non-demographic change as a proportion of intercensal change (%) | Non-demographic change as a proportion of previous Census count (%) | |
|---|---|---|---|
| 2006-2011 | 36,093 | 38.7 | 7.9 |
| 2011-2016 | 39,346 | 39.0 | 7.2 |
| 2016-2021 | 92,471 | 56.5 | 14.2 |
Data is based on place of usual residence. Excludes overseas visitors.
Source: Census of Population and Housing, 2011, 2016 and 2021, ABS Birth Registrations, ABS Deaths Registrations.
Nearly one-third (32.8% or 30,291 people) of non-demographic change observed between 2016 and 2021 can be attributed to the 5-14 years age cohort.
Data is based on place of usual residence. Excludes overseas visitors.
Source: Census of Population and Housing, 2016 and 2021, ABS Death Registrations.
Understanding change in age cohorts
An age cohort is a group of people with the same birth year within a defined period (for example, people aged 30-34 years in 2021 who were aged 25-29 years in 2016). Age cohorts are used to assess changes in the demographic or other characteristics of the group.
An age cohort which has more people who identified as Aboriginal and/or Torres Strait Islander in the 2021 Census than the 2016 Census can indicate:
- an undercount for that cohort in the 2016 Census.
- people entering into that age cohort in 2021.
In the Census, there are several reasons a person may enter into an age cohort including:
- returning to Australia from overseas between Censuses.
- changes in whether a person identifies as Aboriginal and/or Torres Strait Islander between Censuses. For example, a person’s response to the Standard Indigenous Question can be different depending on whether they respond to the question themself or someone is responding on their behalf. There may also be changes in personal circumstances such as changes in family or custodial arrangements or leaving the parental home. These, and other factors are explored further in Changing identification in the Census and throughout life.
- changes in Census coverage and response.
Graph 4 shows that there were more people who identified as Aboriginal and/or Torres Strait Islander counted in almost every five-year age cohort under the age of 65 years in 2021 than in 2016.
Almost a quarter (23.7%) of the total intercensal increase is attributed to 5-19 year olds. It is possible that part of the increase in these age cohorts is a result of 0-4 year olds missed from previous Censuses being counted in subsequent Censuses.
For example: the 2016 Census counted 73,265 0-4 years olds compared with 91,608 registered births between 2011 and 2016. These children are the 5-9 year age cohort in 2021. The 2021 Census counted 89,137 5-9 year olds, an increase of 15,872 people in this age cohort since 2016. The 2021 Census count of 5-9 year olds is closer to the 91,608 registered births between 2011 and 2016, suggesting that some of the increase in Census counts for this age cohort is a consequence of a lag in counting 0-4 year olds (new births) in the previous Census.
Data is based on place of usual residence. Excludes overseas visitors.
Source: Census of Population and Housing, 2011, 2016 and 2021.
Changing identification in the Census and throughout life
The Census uses the Standard Indigenous Question which is based on self-identification.
There may be differences in how a person responds to this question in one Census compared with another depending on whether Indigenous status is provided directly by the individual or by someone else on behalf of the household [2],[3],[4] or if there is a change in whether a person chooses to identify as being of Aboriginal and/or Torres Strait Islander origin in the Census.
A person’s decision to identify as being of Aboriginal and/or Torres Strait Islander origin in the Census can be informed by many personal and external influences (historical and contemporary). These include:
Perceived purpose and relevance of Indigenous status being collected, including access to adequate information about why Indigenous status is being asked and how it will be used [5].
The way Indigenous status is asked [5].
Perceived effects of identifying in certain contexts and the cultural safety of those contexts [5],[6]. For example, interactions with services that may not adequately cater for, or consider the cultural values, of the groups they support can impact a person’s decision to engage with these services, including whether they choose to identify as Aboriginal and/or Torres Strait Islander [6],[7],[8].
- Exposure to negative experiences such as racism and discrimination, both historical and contemporary, has shaped how data collection is currently understood, used and valued by Aboriginal and Torres Strait Islander people [6],[7],[8].
- Aboriginal and Torres Strait Islander identity has become increasingly complex over time due to colonisation, where people have been directly and indirectly impacted by different policies and legislations over time [7].
Data collection, compilation and analysis is embedded within complex practices, histories and ideologies (such as colonialism and past, harmful uses of data) and has not incorporated Aboriginal and Torres Strait Islander knowledge and world views[9],[10],[11]. The result can be information that may not meet current and future needs. Where Aboriginal and Torres Strait Islander knowledge and worldviews are missing, harmful practices, histories and ideologies can be re-enforced through data [10],[11].
Changes in personal circumstances such as entering into a de facto relationship or marriage or leaving the parental home [12],[13].
Public discourse and whether media platforms portray Aboriginal and Torres Strait Islander people and communities in a deficit manner [7],[14]
The ABS has previously released analysis from the 2006-2011-2016 Australian Census Longitudinal Dataset (ACLD) that allows Census users to better understand changes in the counts of Aboriginal and Torres Strait Islander people: Identification as an Aboriginal and Torres Strait Islander person in the Census over time.
That analysis found that a person’s identification as Aboriginal and/or Torres Strait Islander can change at various points throughout their life (also referred to as life course identification). These changes can be in response to shifting social or personal circumstances or as people make decisions about their lives and how they choose to identify in various contexts as they transition through childhood, adolescence and adulthood.
The ABS is planning similar analysis for the 2021 Census. These analyses are expected to be released in early 2024.
Changes in Census coverage and response
Census coverage and response provide important contextual information for understanding change in counts of Aboriginal and/or Torres Strait Islander people in the Census. Of particular importance is:
- Dwelling response – how many dwellings responded to the Census.
- Item response – whether people responded to the Indigenous status question.
- Net undercount – how many people should have been counted in the Census compared with how many were counted in the Census (measured through the Post Enumeration Survey).
The 2021 Census was conducted during the COVID-19 pandemic, which placed more Australians in the country on Census night than would normally have been the case (due to international border restrictions). It also achieved a higher dwelling response rate than the 2016 Census (96.1% compared with 95.1% in 2016) and a higher response to the Indigenous status question (95.1% compared with 94.0% in 2016).
Overall, this means there was greater participation in the 2021 Census from more people in the country, and these people responded at a higher rate to the question on Indigenous status. It is possible that these conditions on their own have contributed in some part to the increase in counts of people who identified as Aboriginal and/or Torres Strait Islander between 2016 and 2021.
Table 5 provides an overview of the indicators of Census coverage and response for the 2016 and 2021 Censuses.
| Census coverage and response | 2016 (%) | 2021 (%) |
|---|---|---|
| Dwelling response (overall) | 95.1 | 96.1 |
| Item response: Indigenous status | 94.0 | 95.1 |
| Net undercount for Aboriginal and Torres Strait Islander people | 17.5 | 17.4 |
| Gross coverage error for people who identified as Aboriginal and/or Torres Strait Islander(a) | 19.6 | 18.8 |
a. Gross coverage error provides a view of how well the population was captured without the added layers of overcount and the adjustment from imputing people into occupied non-responding dwellings that otherwise offset the level of undercount. It is an additional measure describing the quality of the Census.
Please note that there are small random adjustments made to all cell values to protect the confidentiality of data. These adjustments may cause the sum of rows or columns to differ by small amounts from table totals.
Source: Census of Population and Housing, 2016 and 2021, Post Enumeration Survey, 2016 and 2021.
Dwelling response
Overall, there was higher dwelling response in the 2021 Census compared with 2016, nationally and for all states and territories[15]. However, in some (mostly remote) areas, response rates declined.
There were fewer Australian residents temporarily overseas on Census night in 2021 due to COVID-19 border restrictions[16]. This means there were more people in Australia on Census night in 2021 than in 2016, eligible to answer the question on Indigenous status.
The 2021 Census saw an increase in the number of people using the online Census form. The Census Statistical Independent Assurance Panel noted in their report that “Aboriginal and Torres Strait Islander peoples have increasingly taken up the online option when completing their Census with almost two thirds of responses in 2021 being online”[17]. The report also notes that “the online Census form delivers data of a high quality”, partly due to respondents being correctly sequenced to the correct question and less likely to miss questions.
These improvements in dwelling response, the impact of COVID-19 border restrictions on peoples’ movements internationally, and the increased uptake of the online Census form mean that the 2021 Census captured more people who responded to the Indigenous status question. While difficult to quantify, these factors are likely to account for some increase in the Census count of Aboriginal and Torres Islander people.
Item response: Indigenous status
In the Census, Aboriginal and Torres Strait Islander status is collected using the Standard Indigenous Question. The Standard Indigenous Question was first introduced in 1996 and has remained unchanged since. The Census is a self-response questionnaire and responses are either made by the person themselves or on behalf of them if someone else is filling in the questionnaire.
Where a person’s Indigenous status is not provided or cannot be determined, the Indigenous status is set to ‘not stated’.
There are two scenarios that result in an unknown or not stated Indigenous status:
- Responding people: where a Census form was returned but with no answer to the Standard Indigenous Question or they have marked both the ‘No’ and one or both of the 'Yes, Aboriginal' or 'Yes, Torres Strait Islander' boxes in their response. People may not respond to the question either because they feel the question is personal and sensitive, or they are filling the form in on behalf of someone else and don’t know the Indigenous status of the person.
- Non-responding dwellings: where no Census form was returned for a dwelling that was deemed occupied on Census night. In these cases, people are imputed for these dwellings with key demographic variables – age, sex, marital status and place of usual residence. Imputation is a statistical process for predicting values where no response was provided. Indigenous status was not imputed in 2021, consistent with previous Censuses.
Table 6 shows the proportion of response to this question for 2016 and 2021.
| Responding people | 2016 (no.) | 2016 (%) | 2021 (no.) | 2021 (%) |
|---|---|---|---|---|
| Indigenous status | ||||
| Aboriginal and Torres Strait Islander | 649,171 | 2.9 | 812,728 | 3.3 |
| Non-indigenous | 21,341,231 | 96.1 | 23,375,949 | 96.0 |
| Responding - not stated | 227,589 | 1.0 | 172,387 | 0.7 |
| Total responding population(a) | 22,217,990 | 100.0 | 24,361,064 | 100.0 |
| People imputed into non-responding dwellings | ||||
| Not stated(b) | 1,183,899 | 5.1 | 1,061,722 | 4.2 |
| Total | 23,401,892 | 100.0 | 25,422,788 | 100.0 |
Place of usual residence. Excludes overseas visitors.
a. Person was included on a Census form but did not answer the Indigenous status question.
b. Person was not included on a Census form.
Please note that there are small random adjustments made to all cell values to protect the confidentiality of data. These adjustments may cause the sum of rows or columns to differ by small amounts from totals.
Source: Census of Population and Housing, 2016 and 2021.
In 2021 more people responded to the Census overall and those people responded at a higher rate to the Standard Indigenous Question than in 2016. The 172,387 people who returned a Census form but did not answer the Standard Indigenous Question represented 0.7% of the total population, less than the 1.0% observed in 2016[17].
For those who did respond to the Standard Indigenous Question in 2021, a higher proportion were identified as Aboriginal and/or Torres Strait Islander (3.3%) than in 2016 (2.9%).
Children with an unknown Indigenous status in 2021
The overall item response rate for Indigenous Status among children aged 0-14 years was 95.4% in 2021, similar to that for people of all ages in the Census (95.1%).
A small number of children with an unknown Indigenous status were in families with an Aboriginal and/or Torres Strait Islander parent/guardian:
- 1,172 were in families where one parent/guardian identified as Aboriginal and/or Torres Strait Islander (including lone parent families).
- 127 were in families where both parents/guardians identified as Aboriginal and/or Torres Strait Islander.
Net undercount
The ABS uses results from the Post Enumeration Survey (PES) to determine how many people should have been counted in the Census (PES population estimate), how many people were missed (undercount) and how many people were counted more than once or in error (overcount). These measures are combined to produce the net undercount of the Census.
The 2021 PES estimated that 983,257 people who identified as Aboriginal and/or Torres Strait Islander should have been counted in the Census. This is equivalent to a net undercount of 170,752 persons, or a rate of 17.4%.
While the net undercount in 2021 (17.4%) was similar to 2016 (17.5%), each of the components that make up net undercount were reduced (improved). Gross coverage error for people who identified as Aboriginal and/or Torres Strait Islander decreased from 2016 (19.6%) to 2021 (18.8%), reflecting improvements in the components of net undercount. Further data and analysis is available in 2021 Census overcount and undercount, 2021.
Aboriginal and Torres Strait Islander couple families
The Census only measures relationships in a household and cannot be used to measure relationships that exist outside of a household. This means that couples who were not present in the same household on Census night (e.g., if one spouse was temporarily absent) are excluded from this analysis (see methodology for further information). As a result, this analysis may under-represent the true numbers of Aboriginal and Torres Strait Islander couple families.
In 2021, there were 159,843 couples where one or both partners identified as Aboriginal and/or Torres Strait Islander.
Most of these (81.7% or 130,514 couples) were couples where one partner identified as Aboriginal and/or Torres Strait Islander and the other identified as non-Indigenous or did not respond to the Standard Indigenous Question (Indigenous and non-Indigenous partnership couples).
Since 1996, the number of couples where one partner identified as Aboriginal and/or Torres Strait Islander and the other identified as non-Indigenous has increased at a faster rate than the number of couples where both partners identified as Aboriginal and/or Torres Strait Islander. The proportion of Aboriginal and Torres Strait Islander couples where both partners identified as Aboriginal and/or Torres Strait Islander decreased from 35.6% in 1996 to 18.4% in 2021.
Data is based on place of enumeration. Excludes overseas visitors.
a. Includes couples who are married or in a de facto relationship. Excludes couples in which one partner was absent on Census night.
b. Couples with one partner who identified as Aboriginal and/or Torres Strait Islander partner and one partner who identified as non-Indigenous or did not respond to the Standard Indigenous Question.
Please note that there are small random adjustments made to all cell values to protect the confidentiality of data. These adjustments may cause the sum of rows or columns to differ by small amounts from totals.
Source: Census of Population and Housing, 1996-2021.
The states and territories with the highest proportion of Indigenous and non-Indigenous partnership couples in 2021 (as a proportion of all Aboriginal and Torres Strait Islander couples) were:
- Australian Capital Territory (94.2%)
- Victoria (93.7%)
- Tasmania (89.3%)
- New South Wales (88.5%).
The Northern Territory had the highest proportion of couples where both partners identified as Aboriginal and/or Torres Strait Islander (71.8%).
Data is based on place of enumeration. Excludes overseas visitors.
a. Includes couples who are married or in a de facto relationship. Excludes couples in which one partner was absent on Census night.
b. Includes Other Territories.
c. Couples with one partner who identified as Aboriginal and/or Torres Strait Islander partner and one partner who identified as non-Indigenous or did not respond to the Standard Indigenous Question.
Please note that there are small random adjustments made to all cell values to protect the confidentiality of data. These adjustments may cause the sum of rows or columns to differ by small amounts from totals.
Source: Census of Population and Housing, 2021.
Change in the States and Territories
The largest increases in counts of Aboriginal and Torres Strait Islander people were in the eastern states of Australia:
- New South Wales had the largest numerical increase (61,867) followed by Queensland (50,821) and Victoria (17,858).
- The Australian Capital Territory had the largest proportional increase (37.5%), followed by Victoria (37.4%) and New South Wales (28.6%).
- The Northern Territory had the smallest proportional increase (4.9%) followed by Western Australia (16.7%).
The proportion of change attributable to demographic factors varied across the states and territories.
- In the Northern Territory more than three-quarters (76.6%) of the change was accounted for by births, deaths and migration.
- More than half of the change in Western Australia and Queensland could be explained by demographic factors (55.6% and 50.9% respectively).
- In New South Wales, the state with the highest number of people who identified as Aboriginal and/or Torres Strait Islander in 2021 (278,043), just over one-third (35.5%) of the change could be accounted for by demographic factors.
New South Wales and the Northern Territory were the only jurisdictions to lose Aboriginal and Torres Strait Islander population through migration (interstate and overseas).
| Intercensal change | Natural increase(a) | Migration(b) | Total demographic change | Total non-demographic change | ||||
|---|---|---|---|---|---|---|---|---|
| (No.) | (%) | (No.) | (No.) | (No.) | (%) | (No.) | (%) | |
| New South Wales | 61,867 | 28.6 | 25,251 | -3,271 | 21,980 | 35.5 | 39,887 | 64.5 |
| Victoria | 17,858 | 37.4 | 5,834 | 901 | 6,735 | 37.7 | 11,123 | 62.3 |
| Queensland | 50,821 | 27.3 | 20,956 | 4,898 | 25,854 | 50.9 | 24,967 | 49.1 |
| South Australia | 8,378 | 24.5 | 3.471 | 215 | 3,686 | 44.0 | 4,692 | 56.0 |
| Western Australia | 12,715 | 16.7 | 6,428 | 644 | 7,072 | 55.6 | 5,643 | 44.4 |
| Tasmania | 6,614 | 28.1 | 2,528 | 4 | 2,532 | 38.3 | 4,082 | 61.7 |
| Northern Territory | 2,867 | 4.9 | 2,976 | -779 | 2,197 | 76.6 | 670 | 23.4 |
| Australian Capital Territory | 2,441 | 37.5 | 779 | 261 | 1,040 | 42.6 | 1,401 | 57.4 |
| Australia | 163,557 | 25.2 | 68,228 | .. | 71,086 | 43.5 | 92,471 | 56.5 |
Data is based on place of usual residence. Excludes overseas visitors.
a. Census count 0-4 year olds minus registered deaths.
b. Includes people whose place of usual residence in 2016 was overseas. Excludes: i) people did not provide information about their place of usual residence five years ago either because they did not answer the relevant questions or did not respond to the Census, and ii) people who moved overseas between 2016 and 2021 as data on Aboriginal and Torres Strait Islander people migrating out of Australia is not available.
.. not applicable
Please note that there are small random adjustments made to all cell values to protect the confidentiality of data. These adjustments may cause the sum of rows or columns to differ by small amounts from table totals.
Source: Census of Population and Housing, 2016 and 2021, ABS Death Registrations.
Change in New South Wales
There were 278,043 people who identified as Aboriginal and/or Torres Strait Islander counted in New South Wales (NSW) in 2021 – up from 216,176 in 2016. This represents an increase of 28.6%.
Nearly half (48.9%) of the increase in NSW can be attributed to the 0–4 years age cohort followed by children aged:
- 5-9 years (10.0%)
- 10-14 years (9.5%).
Data is based on place of usual residence. Excludes overseas visitors.
Please note that there are small random adjustments made to all cell values to protect the confidentiality of data. These adjustments may cause the sum of rows or columns to differ by small amounts from totals.
Source: Census of Population and Housing, 2016 and 2021.
Demographic factors explained just over one-third (35.5%) of the increase in NSW, taking into account:
- 30,241 0-4 year olds counted in the Census (intercensal births)
- 4,990 deaths
- net loss from interstate migration (-4207 people)
- 936 people returning to NSW from overseas between 2016 and 2021.
The remaining 39,887 person increase (64.5%) was non-demographic – the highest of all the states and territories. This represents 14.3% of the 2021 Census count of people who identified as Aboriginal and/or Torres Strait Islander in NSW.
Age distribution of non-demographic change
Non-demographic change in NSW was highest in the youngest age cohorts:
- 5-9 year olds (6,526 more people counted in 2021)
- 10-14 year olds (6,295 more people counted in 2021)
- 15-19 year olds (4,076 more people counted in 2021).
In these age cohorts, the 2021 Census count was greater than the sum of the 2016 Census count and the demographic factors of population change.
Data is based on place of usual residence. Excludes overseas visitors.
Please note that there are small random adjustments made to all cell values to protect the confidentiality of data. These adjustments may cause the sum of rows or columns to differ by small amounts from totals.
Source: Census of Population and Housing, 2016 and 2021, ABS Death Registrations.
Change in Victoria
There were 65,646 people who identified as Aboriginal and/or Torres Strait Islander counted in Victoria in 2021 – up from 47,788 in 2016. This represents an increase of 37.4%.
Children aged 0-4 years contributed 39.3% of the increase, followed by children aged:
- 5-9 years (8.9%)
- 10-14 years (8.9%).
Data is based on place of usual residence. Excludes overseas visitors.
Please note that there are small random adjustments made to all cell values to protect the confidentiality of data. These adjustments may cause the sum of rows or columns to differ by small amounts from totals.
Source: Census of Population and Housing, 2016 and 2021.
Demographic factors explained 37.7% of the increase in Victoria, taking into account:
- 7,014 0-4 year olds counted in the Census (intercensal births)
- 1,180 deaths
- net gain from interstate migration (565 people)
- 336 people returning to Victoria from overseas between 2016 and 2021.
The remaining 11,123 person increase (62.3%) was non-demographic. This represents 16.9% of the 2021 Census count of people who identified as Aboriginal and/or Torres Strait Islander in Victoria.
Age distribution of non-demographic change
Non-demographic change in Victoria was highest in the youngest age cohorts:
- 5-9 year olds (1,621 more people counted in 2021)
- 10-14 year olds (1,488 more people counted in 2021).
In these age cohorts, the 2021 Census count was greater than the sum of the 2016 Census count and the demographic factors of population change.
Data is based on place of usual residence. Excludes overseas visitors.
Please note that there are small random adjustments made to all cell values to protect the confidentiality of data. These adjustments may cause the sum of rows or columns to differ by small amounts from totals.
Source: Census of Population and Housing, 2016 and 2021, ABS Death Registrations.
Change in Queensland
There were 237,303 people who identified as Aboriginal and/or Torres Strait Islander counted in Queensland in 2021 – up from 186,482 in 2016. This represents an increase of 27.3%.
Half (50.6%) of the increase in Queensland can be attributed to the 0–4 years age cohort followed by children aged:
- 5-9 years (9.9%)
- 10-14 years (9.2%).
Growth in these age cohorts was partly due to net interstate migration (+590 and +567 people respectively) – more so than any other state or territory.
Data is based on place of usual residence. Excludes overseas visitors.
Please note that there are small random adjustments made to all cell values to protect the confidentiality of data. These adjustments may cause the sum of rows or columns to differ by small amounts from totals.
Source: Census of Population and Housing, 2016 and 2021.
Demographic factors explained around half (50.9%) of the increase in Queensland, taking into account:
- 25,731 0-4 year olds counted in the Census (intercensal births)
- 4,775 deaths
- net gain from interstate migration (4,010 people)
- 888 people returning to Queensland from overseas between 2016 and 2021.
The remaining 24,967 person increase (49.1%) was non-demographic. This represents 10.5% of the 2021 Census count of people who identified as Aboriginal and/or Torres Strait Islander in Queensland.
Age distribution of non-demographic change
Non-demographic change in Queensland was highest in the youngest age cohorts:
- 5-9 year olds (4,367 more people counted in 2021)
- 10-14 year olds (4,063 more people counted in 2021).
In these age cohorts, the 2021 Census count was greater than the sum of the 2016 Census count and the demographic factors of population change.
Data is based on place of usual residence. Excludes overseas visitors.
Please note that there are small random adjustments made to all cell values to protect the confidentiality of data. These adjustments may cause the sum of rows or columns to differ by small amounts from totals.
Source: Census of Population and Housing, 2016 and 2021, ABS Death Registrations.
Change in South Australia
There were 42,562 people who identified as Aboriginal and/or Torres Strait Islander counted in South Australia (SA) in 2021 – up from 34,184 in 2016. This represents an increase of 24.5%.
Just over half (54.2%) of the increase in SA can be attributed to the 0–4 years age cohort followed by children aged:
- 5-9 years (10.3%)
- 10-14 years (9.1%).
Data is based on place of usual residence. Excludes overseas visitors.
Please note that there are small random adjustments made to all cell values to protect the confidentiality of data. These adjustments may cause the sum of rows or columns to differ by small amounts from totals.
Source: Census of Population and Housing, 2016 and 2021.
Demographic factors explained a considerable proportion (44.0%) of the increase in SA, taking into account:
- 4,544 0-4 year olds counted in the Census (intercensal births)
- 1,073 deaths
- net gain from interstate migration (76 people)
- 139 people returning to SA from overseas between 2016 and 2021.
The remaining 4,692 person increase (56.0%) was non-demographic. This represents 11.0% of the 2021 Census count of people who identified as Aboriginal and/or Torres Strait Islander in SA.
Age distribution of non-demographic change
Non-demographic change in SA was highest in the youngest age cohorts:
- 5-9 year olds (883 more people counted in 2021)
- 10-14 year olds (786 more people counted in 2021).
In these age cohorts, the 2021 Census count was greater than the sum of the 2016 Census count and the demographic factors of population change.
Data is based on place of usual residence. Excludes overseas visitors.
Please note that there are small random adjustments made to all cell values to protect the confidentiality of data. These adjustments may cause the sum of rows or columns to differ by small amounts from totals.
Source: Census of Population and Housing, 2016 and 2021, ABS Death Registrations.
Change in Western Australia
There were 88,693 people who identified as Aboriginal and/or Torres Strait Islander counted in Western Australia (WA) in 2021 – up from 75,978 in 2016. This represents an increase of 16.7%.
Nearly three-quarters (72.9%) of the increase in WA can be attributed to the 0–4 years age cohort followed by children aged:
- 5-9 years (8.8%)
- 10-14 years (7.7%).
Data is based on place of usual residence. Excludes overseas visitors.
Please note that there are small random adjustments made to all cell values to protect the confidentiality of data. These adjustments may cause the sum of rows or columns to differ by small amounts from totals.
Source: Census of Population and Housing, 2016 and 2021.
Demographic factors explained more than half (55.6%) of the change in WA, taking into account:
- 9,264 0-4 year olds counted in the Census (intercensal births)
- 2,836 deaths
- net gain from interstate migration (322 people)
- 322 people returning to WA from overseas between 2016 and 2021.
The remaining 5,643 person increase (44.4%) was non-demographic. This represents 6.4% of the 2021 Census count of people who identified as Aboriginal and/or Torres Strait Islander in WA.
Age distribution of non-demographic change
Non-demographic change in WA was highest in the youngest age cohorts:
- 5-9 year olds (1,051 more people counted in 2021)
- 10-14 year olds (937 more people counted in 2021).
In these age cohorts, the 2021 Census count was greater than the sum of the 2016 Census count and the demographic factors of population change.
Data is based on place of usual residence. Excludes overseas visitors.
Please note that there are small random adjustments made to all cell values to protect the confidentiality of data. These adjustments may cause the sum of rows or columns to differ by small amounts from totals.
Source: Census of Population and Housing, 2016 and 2021, ABS Death Registrations.
Change in Tasmania
There were 30,186 people who identified as Aboriginal and/or Torres Strait Islander counted in Tasmania in 2021 – up from 23,572 in 2016. This represents an increase of 28.1%.
Children aged 0-4 years contributed 43.5% of the increase in Tasmania, followed by children aged:
- 5-9 years (10.9%)
- 10-14 years (10.4%).
Data is based on place of usual residence. Excludes overseas visitors.
Please note that there are small random adjustments made to all cell values to protect the confidentiality of data. These adjustments may cause the sum of rows or columns to differ by small amounts from totals.
Source: Census of Population and Housing, 2016 and 2021.
Demographic factors explained 38.3% of the increase in Tasmania, taking into account:
- 2,875 0-4 year olds counted in the Census (intercensal births)
- 347 deaths
- net loss from interstate migration (84 people)
- 88 people returning to Tasmania from overseas between 2016 and 2021.
The remaining 4,082 person increase (61.7%) was non-demographic. This represents 13.5% of the 2021 Census count of people who identified as Aboriginal and/or Torres Strait Islander in Tasmania.
Age distribution of non-demographic change
Non-demographic change in Tasmania was highest in the youngest age cohorts:
- 5-9 year olds (687 more people counted in 2021)
- 10-14 year olds (694 more people counted in 2021)
- 15-19 year olds (339 more people counted in 2021).
In these age cohorts, the 2021 Census count was greater than the sum of the 2016 Census count and the demographic factors of population change.
Data is based on place of usual residence. Excludes overseas visitors.
Please note that there are small random adjustments made to all cell values to protect the confidentiality of data. These adjustments may cause the sum of rows or columns to differ by small amounts from totals.
Source: Census of Population and Housing, 2016 and 2021, ABS Death Registrations.
Change in the Northern Territory
There were 61,115 people who identified as Aboriginal and/or Torres Strait Islander counted in the Northern Territory (NT) in 2021 – up from 58,248 in 2016. This represents an increase of 4.9%. This is the smallest increase of all the states and territories.
The Northern Territory lost Aboriginal and Torres Strait Islander population through migration across the 5-19 year age cohort.
All age cohorts aged 20 years and over in the NT recorded a decrease in Census counts. The largest decrease was in the 55-59 year age cohort (down 13.5%).
Data is based on place of usual residence. Excludes overseas visitors.
Please note that there are small random adjustments made to all cell values to protect the confidentiality of data. These adjustments may cause the sum of rows or columns to differ by small amounts from totals.
Source: Census of Population and Housing, 2016 and 2021.
Demographic factors explained just over three-quarters (76.6%) of the increase in the NT – the highest of all the states and territories. This takes into account:
- 5,365 0-4 year olds counted in the Census (intercensal births)
- 2,389 deaths
- net loss from interstate migration (858 people)
- 79 people returning to the NT from overseas between 2016 and 2021.
The remaining 670 person increase (23.4%) was non-demographic. This represents a very small proportion (1.1%) of the 2021 Census count of people who identified as Aboriginal and/or Torres Strait Islander in the NT.
It is important to note that the dwelling response rate for the NT was lower than the other states and territories (92.8%) in 2021 partly due to the remote nature of the NT and its diverse population that can make enumeration more challenging than in other states and territories.
Age distribution of non-demographic change
Similar to other states and territories, the following age cohorts recorded a 2021 Census count that was greater than the sum of the 2016 Census count and the demographic factors of population change.
- 5-9 years (318 more people counted in 2021)
- 10-14 years (168 more people counted in 2021)
- 15-19 years (208 more people counted in 2021).
There were however some age cohorts where the Census counted fewer people in the NT than the sum of the 2016 Census count and the demographic factors of population change. This was most notable for people aged:
- 25-29 years (135 fewer people counted in 2021)
- 35-39 years (119 fewer people counted in 2021)
- 55-59 years (125 fewer people counted in 2021).
The trends observed in the NT between 2016 and 2021 are similar to those observed between 2011-2016.
Data is based on place of usual residence. Excludes overseas visitors.
Please note that there are small random adjustments made to all cell values to protect the confidentiality of data. These adjustments may cause the sum of rows or columns to differ by small amounts from totals.
Source: Census of Population and Housing, 2016 and 2021, ABS Death Registrations.
Change in the Australian Capital Territory
There were 8,949 people who identified as Aboriginal and/or Torres Strait Islander in counted Australian Capital Territory (ACT) in 2021 – up from 6,508 in 2016. This represents an increase of 37.5%.
Just over a third (36.6%) of the increase in the ACT can be attributed to the 0–4 years age cohort followed by persons aged:
- 15-19 years (11.2%)
- 20-24 years (10.7%).
This is different to other states and territories, were most intercensal change is attributable to children under 15 years.
Data is based on place of usual residence. Excludes overseas visitors.
Please note that there are small random adjustments made to all cell values to protect the confidentiality of data. These adjustments may cause the sum of rows or columns to differ by small amounts from totals.
Source: Census of Population and Housing, 2016 and 2021.
Demographic factors explained 42.6% of the increase in the ACT, taking into account:
- 893 0-4 year olds counted in the Census (intercensal births)
- 114 deaths
- net gain from interstate migration (185 people)
- 76 people returning to the ACT from overseas between 2016 and 2021.
The remaining 1,401 person increase (57.4%) was non-demographic. This represents 15.7% of the 2021 Census count of people who identified as Aboriginal and/or Torres Strait Islander in the ACT.
Age distribution of non-demographic change
The ACT reported non-demographic changes in nearly every age cohort. Some of the larger changes were in the following age cohorts:
- 5-9 year olds (252 more people counted in 2021)
- 10-14 year olds (161 more people counted in 2021)
- 15-19 year olds (165 more people counted in 2021)
- 25-29 year olds (135 more people counted in 2021)
- 30-34 year olds (137 more people counted in 2021)
- 35-39 year olds (128 more people counted in 2021).
Data is based on place of usual residence. Excludes overseas visitors.
Please note that there are small random adjustments made to all cell values to protect the confidentiality of data. These adjustments may cause the sum of rows or columns to differ by small amounts from totals.
Source: Census of Population and Housing, 2016 and 2021, ABS Death Registrations.
Change in Indigenous Regions
The interactive map shows the change in Census counts between 2016 and 2021 and the components of change for all Indigenous Regions (IREGs) in Australia.
The five Indigenous Regions (IREGs) that saw the largest proportional changes in counts of Aboriginal and Torres Strait Islander persons between 2016 and 2021 were:
- Brisbane, Queensland (up 30,195 people)
- NSW Central and North Coast, NSW (up 25,942 people)
- Sydney – Wollongong, NSW (up 19,161 people)
- Perth, WA (up 9,866 people)
- Victoria exc. Melbourne, Victoria (up 9,244 people).
| Indigenous Region | 2016-2021 Intercensal change | Demographic change(a) | Non-demographic change(a) | |||
|---|---|---|---|---|---|---|
| (No.) | (%) | (No.) | (%) | (No.) | (%) | |
| Brisbane | 30,195 | 42.7 | 15,055 | 49.9 | 15,140 | 50.1 |
| NSW Central and North Coast | 25,942 | 37.2 | 9,941 | 38.3 | 16,001 | 61.7 |
| Sydney - Wollongong | 19,161 | 29.0 | 6,367 | 33.2 | 12,794 | 66.8 |
| Perth | 9,866 | 33.9 | 5,450 | 55.2 | 4,416 | 44.8 |
| Victoria exc. Melbourne | 9,244 | 38.2 | 4,066 | 44.0 | 5,178 | 56.0 |
Data is based on place of usual residence. Excludes overseas visitors.
a. Expressed as a proportion of the 2016-2021 intercensal change.
Please note that there are small random adjustments made to all cell values to protect the confidentiality of data. These adjustments may cause the sum of rows or columns to differ by small amounts from table totals.
Sources: Census of Population and Housing, 2016 and 2021, ABS Death Registrations.
Change in Local Government Areas
The interactive map shows the change in Census counts between 2016 and 2021 and the components of change for Local Government Areas (LGAs) in Australia.
The five Local Government Areas (LGAs) with the largest changes in Census counts of Aboriginal and Torres Strait Islander persons between 2016 and 2021 were:
- Moreton Bay, Queensland (up 6,045 people)
- Brisbane, Queensland (up 5,870 people)
- Logan, Queensland (up 4,703 people)
- Central Coast (NSW) (up 4,562 people)
- Gold Coast, Queensland (up 4,310 people).
| Local Government Area | 2016-2021 Intercensal change | Demographic change(a) | Non-demographic change(a) | |||
|---|---|---|---|---|---|---|
| (No.) | (%) | (No.) | (%) | (No.) | (%) | |
| Moreton Bay | 6,045 | 48.1 | 2,811 | 46.5 | 3,234 | 53.5 |
| Brisbane | 5,870 | 34.4 | 2,593 | 44.2 | 3,277 | 55.8 |
| Logan | 4,703 | 47.9 | 2,566 | 54.6 | 2,137 | 45.4 |
| Central Coast (NSW) | 4,562 | 36.5 | 1,523 | 33.4 | 3,039 | 66.6 |
| Gold Coast | 4,310 | 46.4 | 2,147 | 49.8 | 2,163 | 50.2 |
Data is based on place of usual residence. Excludes overseas visitors.
a. Expressed as a proportion of the 2016-2021 intercensal change.
Please note that there are small random adjustments made to all cell values to protect the confidentiality of data. These adjustments may cause the sum of rows or columns to differ by small amounts from table totals.
Sources: Census of Population and Housing, 2016 and 2021, ABS Death Registrations.
Interactive maps
Data on change in Indigenous Regions (IREG) and Local Government Areas (LGA) can be viewed on the interactive map.
How to use
- The Indigenous Regions (IREG) are displayed by default upon viewing the map, to view the Local Government Areas (LGAs) please click on the button on the left hand side of the map called LGA ON/OFF.
- The LGAs can also be turned off via the same button which will return the user to the IREG view.
- Search: the search icon opens the search function. It is set to look for locations such as addresses, suburbs and IREG/LGA name.
- Data: on each map, an IREG or LGA can be selected to view the underlying data. Data for all IREGs and LGAs can be found in the Data downloads section of this publication.
- If the maps do not load successfully, please try refreshing this page.
Geographic areas
The boundaries used in this map are:
Indigenous Regions (IREG) and Local Government Area (LGA) boundaries according to the Australian Statistical Geography Standard (ASGS) Edition 3.
References
References
- Birth registrations for the same and previous periods provide comparative data useful for analysing changes, particularly understanding growth among older children.
- Biddle, N, & Crawford, H 2015, The changing Aboriginal and Torres Strait Islander population: Evidence from the 2006–11 Australian Census Longitudinal Dataset, Centre for Aboriginal Economic Policy Research, Australian National University, Canberra.
- Biddle, N, & Markham, F 2018, Indigenous identification change between 2011 and 2016: evidence from the Australian Census Longitudinal Dataset, Centre for Aboriginal Economic Policy Research, Australian National University, Canberra.
- Australian Institute of Health and Welfare and ABS 2012, National best practice guidelines for data linkage activities relating to Aboriginal and Torres Strait Islander people. AIHW cat. no. IHW 74. Canberra: AIHW.
- ABS 2013, Information Paper: Perspectives on Aboriginal and Torres Strait Islander Identification in Selected Data Collection Contexts, 2012 cat. no. 4726.0, ABS, Canberra.
- Kelaher, M, Parry, A, Day, S, Paradies, Y, Lawlor, J & Solomon, L 2010, Improving the Identification of Aboriginal and Torres Strait Islander People in Mainstream General Practice, The Lowitja Institute, Melbourne.
- Dudgeon, P, Wright, M, Paradies, Y, Garvey, D & Walker, I 2010, The social, cultural and historical context of Aboriginal and Torres Strait Islander Australians, in Working together: Aboriginal and Torres Strait Islander mental health and wellbeing principles and practice, Australian Institute of Health and Welfare, Canberra.
- Kickett-Tucker, C.S 2009, Moorn (Black)? Djardak (White)? How come I don’t fit in Mum? Exploring the racial identity of Australian Aboriginal children and youth, Health Sociology Review 18(1), pp. 119-136.
- Maiam Nayri Wingara, n.d., History of Indigenous Data Sovereignty. Available from: https://www.maiamnayriwingara.org/history-of-idsov
Kukutai, T, & Cormack, D 2020, “Pushing the space” Data sovereignty, governance and self-determination in Aotearoa NZ", in Walter M, Kukutai, T Rainie S.C and Rodriguez-Lonebear, D (Eds.), Indigenous data sovereignty and policy. Routledge. New York.
Lovett, R, Jones, R & Maher, B 2020, The intersection of Indigenous Data Sovereignty and Closing the Gap Policy in Australia, in Walter M, Kukutai, T Rainie S.C and Rodriguez-Lonebear, D (Eds.), Indigenous data sovereignty and policy. Routledge. New York.
- New South Wales Aboriginal Education Consultative Group (NSW AEGC) 2011, Aboriginality and Identity: Perspectives, Practices and Policy. Sydney: NSW AECG Inc.
- Heard, G, Birrel, l, B & Khoo, S-E 2009, Intermarriage between Indigenous and non- Indigenous Australians, People and Place, 17(1) pp. 1-14.
- Harris, M, Carlson, B & Poata-Smith, E T A 2013, Indigenous Identities and the Politics of Authenticity in Harris, M, Nakata, M and Carson, B (eds.) The Politics of Identity: Emerging Indigeneity, pp. 1-9, UTSePress, Broadway: NSW.
- Report on the quality of 2021 Census data: Statistical Independent Assurance Panel to the Australian Statistician, 3.3 Response rates, Australian Bureau of Statistics
- Report on the quality of 2021 Census data: Statistical Independent Assurance Panel to the Australian Statistician, 4. COVID-19 and the 2021 Census | Australian Bureau of Statistics
- Report on the quality of 2021 Census data: Statistical Independent Assurance Panel to the Australian Statistician, 3.5 Aboriginal and Torres Strait Islander peoples | Australian Bureau of Statistics
Available data
Information used in this publication is available in the Data downloads section. Please see the table below for information about how to locate this information in the data downloads.
Available data
| Topic | Disaggregation | Census Years | Table |
|---|---|---|---|
Census counts, Aboriginal and Torres Strait Islander persons | Census year | Census 1971 to 2021 | Table 1 |
Change in Census counts by State/Territory, sex and age cohort, Aboriginal and Torres Strait Islander persons | State and Territory, Sex, Age, Census year | Census 2016 and 2021 | Table 2 |
Change in Census counts and demographic and non-demographic factors of change by State/Territory, Aboriginal and Torres Strait Islander persons | State and Territory, Age, Census year | Census 2016 and 2021 | Table 3 |
Change in Census counts and demographic and non-demographic factors of change by Indigenous Region, Aboriginal and Torres Strait Islander persons | Indigenous Regions, Census year | Census 2016 and 2021 | Table 4 |
Change in Census counts and demographic and non-demographic factors of change by Local Government Area, Aboriginal and Torres Strait Islander persons | Local Government Areas, Census year | Census 2016 and 2021 | Table 5 |
Change in Census counts and demographic and non-demographic factors of change by age cohort, Aboriginal and Torres Strait Islander persons aged 5 years and over | State and Territory, Census year | Census 2016 and 2021 | Table 6 |
Aboriginal and Torres Strait Islander couple families, by State/Territory | State and Territory, Aboriginal and Torres Strait Islander couples, Census year | Census 1996 to 2021 | Table 7 |
Data downloads
Understanding change in counts of Aboriginal and Torres Strait Islander Australians
Data files
Previous catalogue number
This release previously used catalogue number 2077.0.
Post release changes
17/04/2024 - Correction of deaths data in the Age distribution of non-demographic change. This results in minor updates to data in:
- Graph 3: age cohorts 5-9, 10-14, 15-19 and 20-24 years.
- Change in the States and Territories: Age distribution of non-demographic change in all States and Territories in text and graphs.
- Data downloads: Table 6, columns G, I and K for all States and Territories and Australia.
12/04/2023 - Interactive maps added.
05/04/2023 - Correction to Table 6, column E in the data downloads for Victoria, Queensland, South Australia, Western Australia, Tasmania, Northern Territory and Australian Capital Territory only.