The ABS will be closed from 12.00pm, 24 December 2024 and will reopen at 9.00am, 2 January 2025. During this time there will be no statistical releases and our support functions will be unavailable. The ABS wishes you a safe and happy Christmas.

Australian Health Survey: Usual Nutrient Intakes

Latest release

Provides a distributional analysis of usual nutrient consumption enabling population assessment of intakes against the Nutrient Reference Values

Reference period
2011-12 financial year
Released
6/03/2015
Next release Unknown
First release

Preface

Logos of the Australian Bureau of Statistics (ABS) and Food Standards Australia New Zealand (FSANZ)

This publication is the second release of nutrition results from the 2011-13 Australian Health Survey (AHS). It presents national level information on the usual intake of selected nutrients by the Australian population. Information collected in the 2011-13 AHS about the population's eating patterns has been modelled to enable estimates of the proportions of the population with excessive, adequate and inadequate nutrient intakes to be determined. The information in this publication is intended to complement the first release of 2011-13 AHS nutrition results which included average intakes of foods and nutrients.

This publication was jointly prepared and released by the Australian Bureau of Statistics (ABS) and Food Standards Australia New Zealand (FSANZ).

David W. Kalisch
Australian Statistician


Signature of Australian Statistician David W. Kalisch

Key findings

This publication is the second release of nutrition data from the 2011-12 National Nutrition and Physical Activity Survey (NNPAS). It presents a comparison of usual intakes of nutrients from foods with the current Nutrient Reference Values (NRVs) for Australia and New Zealand. The NRVs are a set of recommendations made by the Australian National Health and Medical Research Council and the New Zealand Ministry of Health for nutritional intake, based on currently available scientific knowledge.¹

Usual nutrient intakes are an estimate of what people ‘usually’ eat, as opposed to what they reported eating on the particular days they were surveyed in the 2011-12 NNPAS. As NRVs are set on the basis of long term (i.e. usual) nutrient requirements, usual nutrient intakes have been used for comparison in this publication.

Key results

  • Nearly three quarters of females (73%) and half of all males (51%) aged two years and over did not meet their calcium requirements based on their intakes from food.
  • Females were much more likely to have inadequate iron intakes from foods than males, with one in four (23%) not meeting their requirements compared with one in thirty males (3%).
  • Three in four males (76%) and two in five females (42%) aged two years and over exceeded the Upper Level of Intake (UL) for sodium (this does not include sodium added at the table or during cooking).
  • Almost all Australians met their nutritional needs for protein, vitamin C, vitamin B12, phosphorus and selenium. For each of these nutrients approximately 95% or more of all males and females had an adequate usual intake. 95% or more of males also met their requirements for folate, iodine and iron.
  • Almost all (approximately 95% or more) 2-3 year olds met their requirements for all nutrients except iron.
  • Almost all (approximately 95% or more) 4-8 year olds met their requirements for all nutrients except calcium and iron.
     

Focus on folates, thiamin and iodine

In Australia, most wheat flour for bread making is required to be fortified (enriched) with folic acid (a form of folate) and thiamin. If salt is used in bread making it is required to be iodised for the majority of bread types.²

  • Approximately one in twelve (9%) adult females (aged 19 and over) did not meet their requirements for folate (dietary folate equivalents) based on their intakes from foods.
  • Approximately 7% of males and 16% of females had inadequate thiamin intakes. This was consistently higher for females than for males across all age groups over 19 years.
  • 2% of males and 8% of females did not meet their iodine requirements.
  • Some young children exceeded the UL for iodine (13% of males and 6% of females aged 2-3 years).
     

Differences across ages

  • Males aged 71 years and over were less likely than younger males to meet their requirements for protein, riboflavin, vitamin B6, calcium, selenium and zinc. Around one in seven (14%) males aged 71 years and over did not meet their requirements for protein.
  • Females aged 71 years and over were less likely than younger females to meet their requirements for protein, riboflavin and vitamin B6.
  • Young children were more likely than older age groups to exceed the ULs for zinc and iodine.
     

Endnotes

In this release

Macronutrients

This section contains information about usual intakes of protein, carbohydrate (specifically total sugars) and fat, and information on the prevalence of inadequate intakes of protein (based on the EAR). There are no EARs for other macronutrients.

In addition to measuring total macronutrient intake (by the EAR), the balance of macronutrients in the diet is also assessed using the Acceptable Macronutrient Distribution Range (AMDR). Although both an EAR and an AMDR apply to protein, the results of comparison with the EAR and the AMDR are interpreted differently. Comparisons with AMDRs are available at Acceptable Maconutrient Distribution Ranges.

Protein

Inadequate intakes of protein (based on the EAR) indicate insufficient intake of protein to support the body’s normal tissue maintenance and/or growth, potentially leading to protein energy malnutrition.

Animal and plant foods provide protein, including meat, poultry, fish and seafood, eggs, tofu, legumes, beans, nuts and seeds.¹ EARs have been set for protein based on the minimum amounts needed for the body to maintain itself and to allow for normal growth. Almost all Australians (99%) met their requirements for protein based on the EAR. However, approximately one in seven males (14%) and one in twenty-five females (4%) aged 71 years and over did not meet their requirements for protein.²

Carbohydrates

Carbohydrates, comprising mainly of sugars and starch, produce energy for the body to use, and are especially important for brain function. Carbohydrates usually provide the major part of energy in human diets.

Sugars are naturally present in foods such as fruit and milk products as well as added to a range of processed foods and beverages.³ In the NNPAS, naturally occurring sugars cannot be differentiated from those that are added (see AUSNUT 2011-13 for more information on the measurement of sugar in this data).

The top 25% of the population had a usual intake of at least 100 grams of total sugars per day. This is equivalent to at least 23 teaspoons of naturally present or added sugars. Some examples of foods that have 100 grams of naturally present or added sugars are:

  • three cans of soft drink OR
  • two medium sized banana cupcakes OR
  • five apples.
     

Mean and median usual intake of total sugars was higher among adolescents (aged 9-18 years) than adults over 30 years of age. Overall, males had higher mean and median usual intakes of total sugars compared with females across most age groups.

Fat

Fat has the highest energy density of the macronutrients. In addition to being a concentrated form of energy, fats help the body absorb fat-soluble vitamins, such as vitamin A. Dietary fats may be saturated, monounsaturated, or polyunsaturated, depending on their chemical structure. In general, saturated fats are found in animal-based foods, while monounsaturated and polyunsaturated fats are found in plant-based foods, although there are exceptions.¹

Males aged 9 to 50 years had a median usual intake of total fats ranging from 79 to 89 grams per day. The top 25% of the male population aged 9 to 50 years had a usual intake of at least 94 grams of total fats per day. This is equivalent to the following foods:

  • 7 tablespoons of spreads such as butter, margarine and dairy blend.
  • 5 tablespoons of oil.
     

Females aged 9 to 50 years had a lower median usual intake of total fats than males (ranging from 64 to 69 grams per day). The top 25% of the female population aged 9 to 50 years had a usual intake of at least 76 grams of total fats per day. This is equivalent to the following foods:

  • 6 tablespoons of spreads such as butter, margarine and dairy blend.
  • 4 tablespoons of oil.
     

Endnotes

Acceptable Macronutrient Distribution Ranges

Alcohol

Vitamins

Vitamins are chemical compounds essential to the proper functioning of the human body. They need to be obtained through diet as the body is unable to make them on its own. If they are not consumed for a period of time, deficiency symptoms may develop.

Vitamin A

Thiamin

Riboflavin

Vitamin B6

Folate

Vitamin B12

Other vitamins

Essential minerals

Minerals are chemical elements required for a very wide variety of functions including cell function, muscle function, bone formation, hormone production and fluid balance. Some minerals are essential for health and are classified into major and trace elements according to the quantity required by the body.

Calcium

Iron

Sodium

Iodine

Phosphorus

Magnesium

Selenium

Zinc

Caffeine

Caffeine is a natural stimulant found in coffee, tea, and chocolate and a common additive to some drinks and powders.

Males and females had similar intakes of caffeine for each age group. Both males and females over 30 years consumed more caffeine than younger age groups on average, with daily median intakes of over 150 mg and daily mean intakes of over 170 mg for age groups 31-50 and 51-70 years. This is the equivalent of over four cups of black tea, or one and a half espresso shots of coffee. Approximately one quarter of 51-70 year olds consumed the equivalent of six to seven cups of tea or two to three espresso shots of coffee each day (75th percentile of caffeine intakes of 259 mg for males and 238 mg for females aged 51-70 years).

Data downloads

Table 1: summary

Table 2: macronutrients (including moisture)

Table 3: vitamins

Table 4: essential minerals (and caffeine)

Table 5: macronutrient contribution to energy

History of changes

Show all

About the National Nutrition and Physical Activity Survey

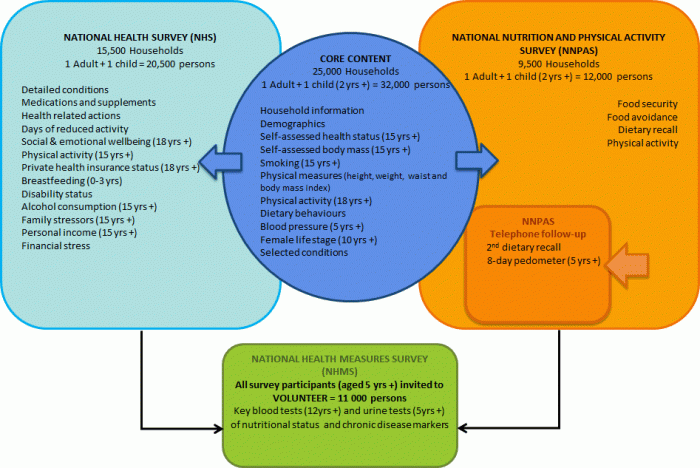
The 2011–13 Australian Health Survey (AHS) is the largest and most comprehensive health survey ever held in Australia. The survey, conducted throughout Australia, collected a range of information about health related issues, including health status, risk factors, health service usage and medications. The 2011–13 AHS incorporated the National Nutrition and Physical Activity Survey (NNPAS). It involved the collection of detailed physical activity information using self-reported and pedometer collection methods, along with detailed information on dietary intake and foods consumed from over 12,000 participants across Australia. The nutrition component is the first national nutrition survey of adults and children (aged two years and over) conducted in over 15 years.

Information for the nutrition component of the NNPAS was gathered using a 24-hour dietary recall on all foods, beverages and dietary supplements consumed on the day prior to the interview. Where possible, at least eight days after the first interview, respondents were contacted to participate in a second 24-hour dietary recall via telephone interview.

This publication is jointly released by the Australian Bureau of Statistics (ABS) and Food Standards Australia New Zealand (FSANZ). It is the second release of information from the nutrition component of the NNPAS, and presents information on the usual intake of nutrients from foods as modelled from data collected in both first and second day interviews.

The AHS sample included Aboriginal and Torres Strait Islander people where they were randomly selected in the general population. The AHS also included an additional representative sample of Aboriginal and Torres Strait Islander people. The National Aboriginal and Torres Strait Islander Nutrition and Physical Activity Survey (NATSINPAS) will provide nutrition and physical activity results for Aboriginal and Torres Strait Islander people at the population level and provides an opportunity to compare results with the non-Indigenous population. Results for the nutrition component of the NATSINPAS will be released in the first half of 2015.

Acknowledgements

The NNPAS has been made possible by additional funding from the Australian Government Department of Health as well as the National Heart Foundation of Australia, and the contributions of these two organisations to improving health information in Australia through quality statistics are greatly valued.

The 2011–13 AHS, and particularly the NNPAS component, was developed with the assistance of several advisory groups and expert panels. Members of these groups were drawn from Commonwealth and state/territory government agencies, non-government organisations, relevant academic institutions and clinicians. The valuable contributions made by members of these groups are greatly appreciated.

In addition to being jointly responsible for the preparation and release of this publication, Food Standards Australia New Zealand (FSANZ) was contracted to provide advice throughout the survey development, processing and collection phases of the 2011-12 NNPAS, and to provide a nutrient database for the coding of foods and dietary supplements consumed. The ABS would like to acknowledge and thank FSANZ for providing their support, advice and expertise to the 2011-12 NNPAS.

The ABS gratefully acknowledges and thanks the Agricultural Research Service of the United States Department Agriculture for giving permission to adapt and use their Dietary Intake Data System, including the Automated Multiple-Pass Method for collecting dietary intake information, as well as other processing systems and associated materials. The ABS also gratefully acknowledges and thanks researchers at the National Cancer Institute (NCI) in the USA and elsewhere for developing and making available the NCI method and corresponding SAS macros, and providing expert advice on the use of the method.

Finally, the success of the 2011–13 AHS was dependent on the very high level of cooperation received from the Australian public. Their continued cooperation is very much appreciated; without it, the range of statistics published by the ABS would not be possible. Information received by the ABS is treated in strict confidence as required by the Census and Statistics Act 1905.

The structure of the Australian Health Survey

Release schedule

Previous catalogue number

This release previously used catalogue number 4364.0.55.008.
 

Back to top of the page