The provision of jobs in Australia has progressed over the last decade
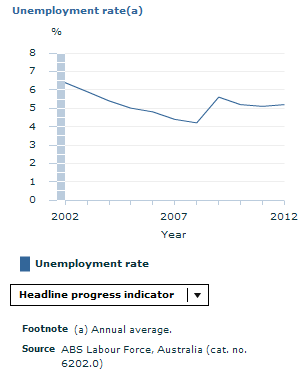
Indicator: Unemployment rate
Why is this theme important?
Australians told us that paid work is important to people’s lives, to the economy and to society overall. Employment provides individuals with income, a sense of purpose and a way they can contribute to society. Paid employment is closely linked with economic growth and is the basis of societal productivity and resourcefulness. This aspiration sees a successful economy as one that provides jobs that ensure people’s safety, their right to fair treatment and protection, a sense of economic security and an effective industrial relations environment. People thought that quality jobs also allow people to balance their work life with other commitments, provide adequate pay for work done, and are rewarding in a non-material sense.
How have we decided there has been progress?
We have decided that the provision of jobs in Australia has progressed over the last decade because the unemployment rate (our headline progress indicator for jobs) has decreased.
Between 2002 and 2012, the annual average unemployment rate for Australia decreased from 6.4% to 5.2%. The decrease in the rate was consistent over the period from 2002 to 2008, following which the rate increased in the wake of the global financial crisis. Since 2010, there has been some levelling off in the unemployment rate to its current figure.
Why this headline progress indicator?
The unemployment rate is an important part of the aspiration for the provision of jobs.
The unemployment rate is considered a good measure of progress for an economy that provides jobs because it indicates the percentage of people in the labour force who are unemployed. This is a popular measure around the world for monitoring the economic health of nations as it excludes all the people who are not participating in the labour force, such as those who are retired. The unemployment rate only measures those people who are ready to enter into paid work and have recently taken active steps to find a job; it does not reflect a wider group of people whose aspirations for work are not being fully met because they are working fewer hours then they would like (i.e. people who are underemployed).
This indicator is a partial measure of the concept of the provision of jobs as described above (based on Aspirations for our Nation).
The data source is of high quality.
Let's break it down!
Generally, in recent decades, the unemployment rate has tended to rise quickly during economic downturns and fall slowly during periods of economic recovery. In 1983 it rose to a high of 10.0% and then declined to 6.2% in 1989, only to rise again to 10.9% in 1993.
For men the annual average unemployment rate decreased from 6.5% in 2002, to 5.2%, in 2012. For women over the same period the rate decreased from 6.2% to 5.3%.
Use the drop down menu on the graph to look at other breakdowns of the indicator (graphs are also available on the further info page).
But that is not the whole story...
There is more to the provision of jobs than the unemployment rate. Look through the other tabs on this page to see if the elements of the provision of jobs have progressed.
Check out our further info page for useful links, a glossary and references relating to this chapter.
Footnote(s): (a) A non-managerial job is considered low paid if hourly cash earnings received is less than or equal to two-thirds the median hourly cash earnings for all non-managerial jobs. (b) Data is for May except 2008 data which is for August.;(a) A non-managerial job is considered low paid if hourly cash earnings received is less than or equal to two-thirds the median hourly cash earnings for all non-managerial jobs. (b) Data is for May except 2008 data which is for August.
Source(s): ABS data available on request, Survey of Employee Earnings and Hours; ABS data available on request, Survey of Employee Earnings and Hours
Income in Australia has regressed over the last decade
Indicator: Proportion of non-managerial jobs that are low paid
Why is this element important?
As a principal source of economic resources for most people in the community, income earned through paid employment (otherwise known as earnings) is an important aspect of progress. Income not only supports individuals economically by allowing them to purchase goods and services or build savings, but also supports wellbeing in other ways, such as by contributing to a sense of purpose, identity, and self-worth. Income earned through employment also has implications beyond the recipient. This is because the income earned by those in paid employment can be used to support family members, friends and people in the wider community.
Go to the overall progress tab and further info page for more information about the provision of jobs in Australia.
How have we decided there has been regress?
We have decided that income in Australia has regressed over the last decade because the proportion of non-managerial jobs that are low paid (our progress indicator for income) has increased.
In 2002, 8.9% of non-managerial jobs were low paid. A decade later in 2012, the proportion had risen to 10.3%. Non-managerial jobs are considered low paid if the hourly cash earnings received are less than or equal to two-thirds the median hourly cash earnings for all non-managerial jobs.
Why this progress indicator?
Income earned tells us about income as part of the aspiration for the provision of jobs.
The proportion of non-managerial jobs that are low paid is considered a good measure of progress for income because it measures the extent to which people are receiving a reasonable return for the work they perform relative to others. The proportion of non-managerial jobs that are low paid is considered a good measure in this regard as it captures whether persons on the lower end of the income scale are being remunerated in a fair way relative to others in the workforce.
There is no single agreed method for determining whether a job could be considered low paid. For this element in MAP, we have employed a relative measure that considers a job low paid if the hourly cash earnings received are less than or equal to two-thirds the median hourly cash earnings. This is based on a measure used by the International Labour Organization (in their 'Global Wage Report 2012/13'). Managerial jobs are excluded from the indicator as the data source does not allow the derivation of hourly rates of pay for managerial employees.
Between 2002 and 2012, the proportion of non-managerial jobs that were low paid was generally similar for both men and women in Australia.
Use the drop down menu on the graph to look at other breakdowns of the indicator (graphs are also available on the further info page).
But that is not the whole story...
There is more to the provision of jobs than income. Look through the other tabs on this page to see if the other elements of the provision of jobs have progressed.
Check out our further info page for useful links, a glossary and references relating to this chapter.
Footnote(s): (a) Mean score out of 10.;(a) Mean score out of 10.;(a) Mean score out of 10.
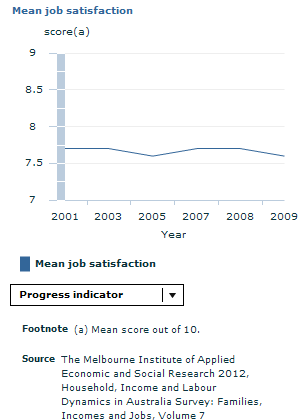
Job satisfaction in Australia has not changed greatly since 2001
Indicator: Average level of job satisfaction
Why is this element important?
When people are satisfied with their jobs, employee turnover is reduced and the economy benefits from a workforce that is more likely to be engaged with their work. For employees, having challenging and rewarding work to do is both fulfilling and improves the quality of their life.
Go to the overall progress tab and further info page for more information about the provision of jobs in Australia.
How have we decided things haven't changed greatly?
We have decided job satisfaction in Australia has not changed greatly in recent years because the average level of job satisfaction (our progress indicator for job satisfaction) hasn't moved much.
Between 2001 and 2009, the mean job satisfaction score showed a change from 7.7 to 7.6 out of 10. This is a minor difference and does not show any significant change from 2001 to 2009.
Why this progress indicator?
Job satisfaction is an important part of the aspiration for the provision of jobs.
The mean job satisfaction score is considered a good measure of progress for an economy that provides jobs because it allows us to understand, on average, how content people are with their working lives. Levels of job satisfaction can depend on a number of issues, including whether the job is suited to the individual, the conditions in which they work, their relationships with colleagues, and if they are able to balance work and non-work commitments. High levels of job satisfaction are generally an indication of a workforce that is motivated and engaged in work that meets the expectations of employees.
The job satisfaction indicator is sourced from the Household, Income and Labour Dynamics in Australia Survey, published by the Melbourne Institute. It is currently one of the only national surveys that collects information concerning the level of satisfaction workers have with their jobs. However, as an indicator of satisfaction, it measures an individual's reported satisfaction of the conditions associated with work, rather than directly observing working conditions.
Subjective job satisfaction is an important aspect of work that affects people's wellbeing and therefore is an important indicator that the extent to which Australians' work preferences are satisfied.
This indicator is a direct measure of job satisfaction.
The data source is of acceptable quality.
Let's break it down!
Different aspects of job satisfaction can also be measured. In Australia, similar levels of satisfaction are found across a range of job characteristics, including satisfaction with total pay, job security, the hours of work and the flexibility to balance work and non-work commitments. Between 2001 and 2009, the mean score on each of these measures did not fall below 6.7 out of 10, suggesting that overall, Australians tend to be satisfied with their jobs.
In 2009, average levels of overall job satisfaction were the same for both men and women in Australia (7.6 out of 10). While there have been small changes in the score for both sexes over time, these changes have been too small to conclude progress or regress.
Use the drop down menu on the graph to look at other breakdowns of the indicator (graphs are also available on the further info page).
But that is not the whole story...
There is more to the provision of jobs than job satisfaction. Look through the other tabs on this page to see if the other elements of the provision of jobs have progressed.
Check out our further info page for useful links, a glossary and references relating to this chapter.
Footnote(s): (a) Excludes owner managers of incorporated enterprises (OMIEs).
(b) Includes both written and unwritten agreements.;(a) Excludes owner managers of incorporated enterprises (OMIEs).
(b) Includes both written and unwritten agreements.;(a) Excludes owner managers of incorporated enterprises (OMIEs).
(b) Includes both written and unwritten agreements.
Access to flexible work arrangements in Australia has progressed since 2006
Indicator: Proportion of employees with an agreement with their employer to work flexible hours
Why is this element important?
Flexible work arrangements are beneficial for both employers and employees. Being able to access flexible arrangements, whether it is part-time hours, teleworking or other arrangements, helps employees to balance their work and non-work commitments, such as family responsibilities, study, as well as recreation activities. Some other examples of flexible arrangements might include: working from home or an alternative workplace; working shorter hours for an agreed period; choosing start and finish times; or choosing when to take annual leave and purchasing extra annual leave.
Understanding the extent to which Australians use flexible arrangements is important. From an economic perspective, it allows employers to retain employees who may otherwise not be able to work within standard working hours or practices and ensures productive employees can maintain continuity in employment. From a social perspective, flexibility provides greater opportunity for individuals that are not able to maintain standard work patterns. This is particularly the case for mothers returning to the labour force after having children, as well as others with caring responsibilities. Achieving this balance is important for the wellbeing of families.
Go to the overall progress tab and further info page for more information about the provision of jobs in Australia.
How have we decided there has been progress?
We have decided access to flexible work arrangements in Australia have progressed since 2006 because the proportion of employees with an agreement with their employer to work flexible hours (our progress indicator for flexible arrangements) has increased.
Between 2006 and 2012, the proportion of employees with an agreement with their employer to work flexible hours increased by a third from 23% to 31%. This increase largely occurred in the three years between 2006 and 2009, with little change in the rate between 2009 and 2012.
Why this progress indicator?
Flexible work hours tell us about flexible arrangements as part of the aspiration for the provision of jobs.
The proportion of employees with an agreement with their employer to work flexible hours is considered a good measure of progress for flexible work arrangements because it measures whether the labour market is providing jobs that are flexible and suited to the lives of Australians.
Flexible work hours may be agreed to by the employee and employer in a written agreement or discussed verbally. Though only a component of the broader notion of flexible working arrangements, the flexible work hours indicator provides an understanding of the extent to which businesses and employees balance work and non-work life, in the context of a productive economy. However, the proportion of employees with an agreement with their employer to work flexible hours provides only one view of flexible working arrangements. A broader view of the work arrangements of employed people can be found in ABS Working Time Arrangements (cat. no 6342.0).
This indicator is a partial measure of flexible work arrangements.
The data source is of high quality.
Let's break it down!
For both men and women working part-time hours, the proportion with an agreement to work flexible hours increased by almost half in the 6 years to 2012. For men, the proportion grew from 20% to 30% between 2006 and 2012, while for women the proportion grew from 25% to 36%. This equated to there being 204,000 part-time employed men and 705,000 part-time employed women in Australia in 2012 with an agreement to work flexible hours.
For full-time employees, flexible hours also increased, although less so than for part-time employees. For full-time males, the proportion increased from 23% to 29%, while for women the proportion increased from 24% to 30%. In 2012, just over a million full-time employed men and 753,000 full-time employed women had an agreement to work flexible hours.
Use the drop down menu on the graph to look at other breakdowns of the indicator (graphs are also available on the further info page).
But that is not the whole story...
There is more to the provision of jobs than flexible work arrangements. Look through the other tabs on this page to see if the other elements of the provision of jobs have progressed.
Check out our further info page for useful links, a glossary and references relating to this chapter.
Footnote(s): (a) Data for 2010-11 is preliminary and likely to increase as more claims are accepted or amended by jurisdictions at a later date. (b) Calculated as serious claims per 1000 employees.;(a) Data for 2010-11 is preliminary and likely to increase as more claims are accepted or amended by jurisdictions at a later date. (b) Calculated as serious claims per 1000 employees.;(a) Data for 2010-11 is preliminary and likely to increase as more claims are accepted or amended by jurisdictions at a later date. (b) Calculated as serious claims per million hours worked.
Access to safe and healthy working conditions in Australia has progressed over the last decade
Indicator: Incidence rate for compensated work related injuries
Why is this element important?
Access to safe and healthy working conditions is beneficial to both employers and employees. Fewer injuries, less absenteeism and less staff turnover, not only benefit worker wellbeing but also improve the morale of workplaces. From an economic perspective, safe and healthy work environments also ensure workplaces are productive and that expenses relating to workers' compensation, legal fees, and recruitment are minimised.
Go to the overall progress tab and further info page for more information about the provision of jobs in Australia.
How have we decided there has been progress?
We have decided that access to safe and healthy working conditions in Australia has progressed in the last decade because the incidence rate for compensated work related injuries (our progress indicator for safe and healthy working conditions) has decreased.
Between 2000-01 and 2010-11, the rate of serious claims accepted for workers compensation for employees decreased by almost one-third, from 17.5 per 1,000 employees in 2000-01, to 12.2 per 1,000 employees in 2010-11.
Why this progress indicator?
The incidence of work related injuries sheds light on access to safe and healthy working conditions, as part of the aspiration for the provision of Jobs.
The incidence rate for compensated work related injuries is considered a good measure of progress for safe and healthy working conditions because it shows the rate of serious claims workers have lodged under workers’ compensation schemes due to a work related injury or disease. The indicator measures the number of claims made in Australian workplaces relative to the number of people working in these workplaces. Though not a direct observation of the extent to which workplaces are safe and healthy, a decrease in the rate would indicate that workers are less exposed to unsafe work environments and practices.
Data for this indicator is sourced from Safe Work Australia, the Australian Government statutory agency that provides national leadership and coordination in preventing workplace death, injury and disease. A serious claim is defined as a compensation for a death, permanent incapacity, or a temporary incapacity requiring an absence from work of one working week or more, and accepted for compensation by the respective jurisdiction.
The indicator does not cover all cases of occupational injuries and diseases. This is because some occupational injuries and diseases result in an absence from work for less than one working week. Claims arising from journeys to and from work are also excluded. Furthermore, because workers’ compensation schemes do not generally provide coverage to self-employed workers, injuries and diseases of workers employed in industries where self-employed workers are common is understated. In addition, 2010–11 data is preliminary and is likely to change as more claims are accepted or amended by jurisdictions at a later date.
This indicator is an indirect measure of access to safe and healthy working conditions.
The data source is of high quality.
Let's break it down!
The incidence rate for compensated work related injuries decreased for both men and women in the decade to 2010-11. For men, the rate decreased from 22.7 to 15.2 per 1,000 employees, while for women, the decrease was smaller, from 11.5 to 8.9 per 1,000 employees. In 2010-11, this equated to 83,000 men and 44,000 women who had a serious claim accepted. To some extent the higher incidence rates of serious claims among male employees may be explained by the high proportion of males employed in the more hazardous industries, such as mining and construction.
Comparatively, the frequency rates of workplace injury or disease for different groups of employees is another way we can explore the extent to which workplaces are safe and healthy. This measure calculates the number of serious claims reported relative to the total time workers spend working. Frequency rates control for differences in the proportion of part-time employees between one group and another.
The frequency rate for all serious claims accepted for males decreased from 11.6 claims, per million hours worked in 2000-01 to 8.1 claims, per million hours worked in 2010-11. Similarly, the frequency rate for all serious claims accepted for females also decreased from 7.9 claims per million hours worked in 2000-01 to 6.3 claims per million hours worked in 2010-11.
Use the drop down menu on the graph to look at other breakdowns of the indicator (graphs are also available on the further info page).
But that is not the whole story...
There is more to the provision of jobs than access to safe and healthy working conditions. Look through the other tabs on this page to see if the other elements of the provision of jobs have progressed.
Check out our further info page for useful links, a glossary and references relating to this chapter.
Footnote(s): (a) Total number of disputes is all the disputes which belong to the relevant period. (b) Industrial disputes are included within the scope if the work stoppages amount to ten or more working days lost. Disputes which involve the equivalent of less than 10 working days lost are excluded.;
The effectiveness of Australia's industrial relations environment has progressed over the last decade
Indicator: Total number of industrial disputes and working days lost per thousand employees
Why is this element important?
Industrial relations refers to the relationship between employers and employees, and typically centres around the pay and conditions under which people are employed. An effective industrial relations environment ensures employees have access to fair wages, conditions and a means of recourse if disputes occur with an employer. Employers also benefit by providing a stable workplace environment where employees are engaged and motivated to productively undertake work.
Go to the overall progress tab and further info page for more information about the provision of jobs in Australia.
How have we decided there has been progress?
We have decided that the effectiveness of the industrial relations environment in Australia has progressed in the last decade because both the total number of industrial disputes and working days lost per thousand employees (our progress indicators for effective industrial relations environment) have decreased.
Between 2002 and 2012, the number of industrial disputes decreased from 767 to 204. Although there was some fluctuation, over the same period, the number of working days lost per 1,000 employees due to industrial disputes decreased from 32.5 in 2002 to 26.7 in 2012.
Why this progress indicator?
Industrial disputes tells us about the industrial relations environment as part of the aspiration for the provision of jobs.
The number of industrial disputes and number of working days lost per thousand employees due to industrial disputes are good measures of progress for an effective industrial relations environment because they summarise the frequency of disputes between employers and employees. Decreases in the measures indicate stability in Australia's industrial relations system, with fewer work stoppages occurring due to industrial disputes. Importantly, the indicators are limited in that they do not capture whether disputes were resolved, or if so, how disputes came to be resolved, nor tensions that did not result in industrial action. Furthermore, the indicators do not measure the wider impact specific industrial relations systems have on employers, employees, jobs and the effectiveness of broader economy.
While many types of disputes are covered by the measures, work-to-rules, go-slows and bans (e.g. overtime bans) are not included in the measures. Also excluded are effects of disputes on locations other than where the stoppages occurred, such as stand downs because of lack of materials, disruption of transport services and power cuts. In addition, only work stoppages amounting to ten or more working days lost are included, while those that are the equivalent of less than 10 working days lost are excluded.
A broader view of the industrial relations disputes can be found in the ABS Industrial Disputes (cat. no 6321.0.55.001) publication.
This indicator is an indirect measure of an effective industrial relations environment.
The data source is of high quality.
But that is not the whole story...
There is more to the provision of jobs than an effective industrial relations environment. Look through the other tabs on this page to see if the other elements of the provision of jobs have progressed.
Check out our further info page for useful links, a glossary and references relating to this chapter.
Document Selection
These documents will be presented in a new window.

 that are low paid(b) updated.GIF)
 that have an agreement(b) with employer to work flexible hours.GIF)
 of serious claims accepted for workers compensation by employees(b).GIF)
(b).GIF)