Innovation in Australian Business

Latest release

This release presents key innovation data for Australian businesses, as collected from the 2020-21 Business Characteristics Survey (BCS).

Reference period
2020-21 financial year

Key statistics

  • In the two-year period ended 30 June 2021, over half of all businesses (52%) reported being innovation-active.
  • Of the innovation-active businesses, 36% collaborated and/or had a fee-for-service arrangement for innovation.
  • 24% of innovation-active businesses collaborated for innovation.

A review of the Business Characteristics Survey (BCS) was undertaken in response to a number of considerations including:

  • Recommendation from the Innovation Metrics Review (IMR).
  • ABS’ commitment to reduce provider burden.
  • Feedback from key stakeholders.
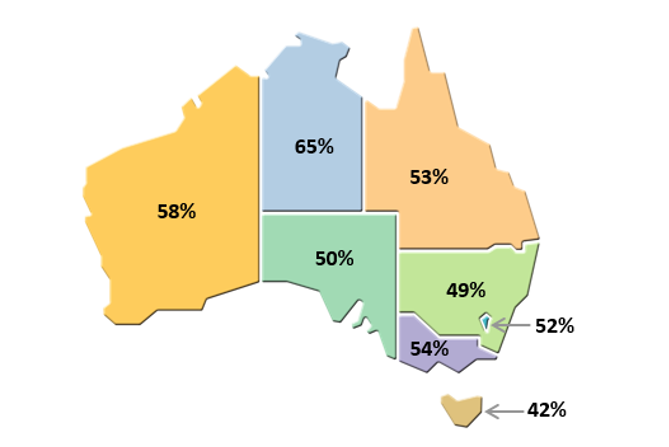
  • Need for greater granularity in estimates (State and Territory data).

As a result, the BCS was redeveloped into two separate collections to capture more detailed information on the two principal topics (i.e., innovation and Business Use of IT).

Innovation in Australian Business 2020-21 is the first redeveloped innovation module.

The collection will be run every two years as a stand-alone survey with a two-year reference period.

For more details, please see Content changes in the Methodology section.

Innovation Activity

An innovation-active business is one that introduced any type of innovation (i.e., new good, service or process), and/or had innovation which was still in development (as at 30 June 2021) or abandoned during the reference period (i.e., the two years ended 30 June 2021). 

An innovating business is one that introduced any type of innovation (i.e., any new good, service and/or process) during the reference period (i.e., the two years ended 30 June 2021).

Summary of innovation activity in Australian business (a)(b), by employment size – two years ended 30 June 2021
0–4 persons5–19 persons20–199 persons200 or more personsTotal
%%%%%
Businesses which introduced:
Goods or services2026313522
Process3252616140
Businesses which introduced innovation (innovating businesses)3858656645
Businesses with innovative activity which was:
still in development(b)2028434924
abandoned1316181214
Businesses with any innovative activity (innovation-active businesses)4663717152
  1. Proportions are of all businesses.
  2. As at 30 June 2021.

For the two years ended 30 June 2021, estimates for the core innovation indicators (i.e., innovation-active and innovating businesses) were 52% and 45% respectively. There are a number of factors that have contributed to this result.

  • A compositional change to the in-scope business population. There has been an increase in the proportion of small businesses that make up the business population. In 2020-21, the proportion of the in-scope business population with 0-4 persons employed increased by 3 percentage points from 2019-20 (65% to 68%). Businesses in this cohort were the least likely to innovate, therefore the increased share of these businesses in the population has had a dampening impact on the core innovation estimates.  The large increase in the number of small businesses on the ABS business frame is highlighted in the Counts of Australian Businesses including Entries and Exits (CABEE) release.

(Please note: There are differences between the CABEE and BCS in-scope populations and the reference to the latest release of CABEE is provided for contextual information only).

  • Anecdotal information collected from businesses as part of the conduct of this survey indicates that many businesses shifted their resources away from innovative activities to core operations because of the impact on business operating conditions due to the COVID-19 pandemic; this was particularly evident in businesses with 0-4 employees and 5-19 employees. These findings are supported by information published in Business Conditions and Sentiments February 21 ; which highlights external, supply and demand and financial factors having impacted business activity.


For the two years ended 30 June 2021:

  • 22% of businesses reported introducing a goods and/or services innovation.
  • 40% of businesses introduced a process innovation.

While not directly comparable due to methodological changes, in the two-year reference period ended 30 June 2021:

  • 14% of businesses reported abandoning innovation, compared to 9% of businesses in the one-year innovation collection reference period ended 30 June 2019.
  • 71% of businesses with 200 or more employees reported any innovation activity, compared to 61% of businesses in this cohort for the one-year reference period ended on the 30 June 2019. 

Proportion of innovation-active businesses (a), by state/territory, two years ended 30 June 2021

This map examines the proportion of innovation-active businesses, by state/territory, two-years ended 30 June 2021.

Proportion of innovation-active businesses (a), by state/territory, two years ended 30 June 2021

The image presents a map of Australia showing the individual states and territories, highlighted in different colours. The proportion of innovation-active businesses for the two years ended 30 June 2021 are displayed on the image within the boundary of the state or territory with the exception of the Australian Capital Territory and Tasmania which have the proportions positioned external to the map boundary, with a line linking it to the relevant boundary on the map. The proportion of innovation-active businesses for the two years ended 30 June 2021 for each state and territory are 49% for New South Wales, 54% for Victoria, 53% for Queensland, 50% for South Australia, 58% for Western Australia, 42% for Tasmania, 65% for the Northern Territory and 52% for the Australian Capital Territory.
  1. Proportions are of all businesses in each output category.
  1. Proportions are of all businesses in each output category.

Barriers to innovation

While not directly comparable due to methodological changes; in the two-year reference period ended 30 June 2021, 46% of businesses reported barriers to innovation, compared to 39% of businesses in the one-year period ended 30 June 2019.

Barriers to innovation (a)(b), by type of barrier, two years ended 30 June 2021

Barriers to innovation (a)(b), by type of barrier, two years ended 30 June 2021

Barriers to innovation (a)(b), by type of barrier, two years ended 30 June 2021

The image has eight circles representing barriers to innovation that businesses experienced during the two years ended 30 June 2021. The circles are sized and coloured according to the proportions of businesses that experienced each of the barriers. "Lack of access to additional funds"(20%) was the most reported barrier and is the largest circle and shaded in dark blue. Both "Lack of skilled persons within the business" (16%) and "Lack of skilled persons within the labour market" (16%) are slightly smaller sized circles and are shaded in light blue. "Cost of development or introduction/implementation" (15%) and "Uncertain demand for new goods or services" (14%) are slightly smaller circles again and are shaded in red. The remaining three barriers, "Government regulations and compliance" (13%), "Lack of access to knowledge or technology to enable development or introduction/implementation" (6%) and "Adherence to standards" (4%) are the smallest circles and are shaded in orange.
  1. Proportions are of all businesses. 
  2. Businesses could report more than one category.

Anecdotal evidence collected as part of the conduct of this survey suggests that the impact of the Covid-19 pandemic exacerbated the problems associated with some of the barriers to innovation. Results from the following ABS article highlight the impact to business cash flow from pandemic related actions such as social distancing measures.

Collaboration and Fee-for-service arrangements for innovation

Businesses that reported innovation activity were asked if they collaborated with others to develop or introduce new goods, services or processes in the two years ended 30 June 2021.

Innovation-active businesses were also asked whether they entered into any fee-for-service arrangements to develop or introduce new goods, services or processes.

More than a third of innovation-active businesses (36%) either collaborated and/or entered into a fee-for-service arrangement for the purpose of innovation. 

Collaboration and/or Fee-for-service arrangements, by type of organisation (a)(b)(c)(d), two years ended 30 June 2021

Collaboration and/or Fee-for-service arrangements, by type of organisation, two years ended 30 June 2021.

Collaboration and/or Fee-for-service arrangements, by type of organisation (a)(b)(c)(d), two years ended 30 June 2021

The image has two rectangular boxes at the top which show the proportion of innovation-active businesses that reported collaboration (on the left side) or a fee-for-service arrangement (on the right side) for the purpose of innovation during the two years ended 30 June 2021. The "collaboration" box is shaded in dark blue and the "fee-for-service" box is shaded in orange. 24% of innovation-active businesses reported collaborating for the purpose of innovation and 20% of innovation-active businesses reported entering into a fee-for-service arrangement for the purpose of innovation. There is an arrow underneath each of the rectangular boxes pointing down to larger boxes with rounded edges that show the top five types of organisations that businesses collaborated with or had a fee-for-service arrangement with. The arrows and larger boxes are the same colour as those at the top (dark blue on the left side and orange on the right side). The top five types of organisations that innovation-active businesses reported collaborating with were: Customers or client (47%), Suppliers (46%) Consultants (including technical experts) (42%) Another business owned by the same company (24%) Competitors and other businesses from the same industry (24%) The top five types of organisations that innovation-active businesses reported entering into a fee-for-service arrangement with were: Consultants (including technical experts) (52%) Suppliers (30%) Customers or clients (25%) Competitors and other businesses from the same industry (8%) Another business owned by the same company (8%)
  1. Proportions are of all innovation-active businesses in each output category.
  2. Businesses could report more than one output category.
  3. Proportions are of all innovation-active businesses that collaborated for the purpose of innovation.
  4. Proportions are of all innovation-active businesses that entered into a fee-for-service arrangement for the purpose of innovation.

Collaborative arrangements, by type of arrangement (a)(b), two years ended 30 June 2021

Collaborative arrangements, by type of arrangement, two years ended 30 June 2021.

Collaborative arrangements, by type of arrangement (a)(b), two years ended 30 June 2021

The image has eight circles representing the types of collaborative arrangements that businesses were involved in for the purpose of innovation during the two years ended 30 June 2021. The circles are sized according to the proportions of businesses that were involved in the type of collaborative arrangement. The circles are a range of different colours that are not related to the size of the circle. "Informal arrangements" (43%) was the most reported type of collaboration arrangement. This was followed by "Joint R&D" (31%), "Joint production of new goods and services" (30%), "Sharing staff resources" (23%), "Joint training" (20%), "Joint marketing or distribution" (19%), "Joint prototype development" (12%) and "Sharing facilities" (9%).
  1. Proportions are of innovation-active businesses that collaborated for the purpose of innovation. 
  2. Businesses could report more than one type of collaborative arrangement.

Barriers to collaboration for innovation

Half of all innovation-active businesses (50%) reported factors that prevented or limited collaboration in the two years ended 30 June 2021.

  1. Proportions are of innovation-active businesses in each output category.
  2. Businesses could report more than one factor that prevented or limited collaboration with others for innovation and were not asked to rank factors in order of significance.

Outcomes of innovation

For the year ended 30 June 2021, innovating businesses were asked to estimate the percentage of income that resulted from the sale of new or significantly improved goods and/or services.

  1. Percentage of businesses with goods and/or services innovation in each output category.

Innovating businesses were also asked to estimate the percentage of cost savings that resulted from the introduction of new or significantly improved processes. 

  1. Percentage of businesses with process innovation in each output category.
  2. The sum of the component items may not equal 100% due to rounding.

Benefits of innovation

Innovating businesses were also asked to report the benefits of introducing new goods, services or processes during the two years ended 30 June 2021.

  1. Proportions are of innovating businesses in each output category.
  2. Businesses could report more than one benefit of innovation.

Most significant innovation

For the first time, innovating businesses were asked to provide details about their most significant innovation introduced during the two years ended 30 June 2021.

Most significant innovation introduced (a), target markets and commercialisation activities undertaken (b)(c), two years ended 30 June 2021

Most significant innovation introduced and commercialisation activities undertaken for the most significant innovation, two years ended 30 June 2021.

Most significant innovation introduced (a), target markets and commercialisation activities undertaken (b)(c), two years ended 30 June 2021

The image has two rectangular boxes at the top which show the proportion of innovating businesses whose most significant innovation was a new good or service (on the left side) or a new business process (on the right side) during the two years ended 30 June 2021. The boxes are shaded in light blue and dark blue respectively. A new "good or service" was reported as the most significant innovation by 39% of innovating businesses and a new "business process" was reported as the most significant innovation by 61% of innovating businesses. There is a large orange rectangular box with rounded edges below the two rectangular boxes at the top. This box shows the five target markets for an innovating business's most significant innovation and the proportion of innovating businesses that targeted these markets during the two years ended 30 June 2021. The proportions reported for each target market were: Customers: Within the same state/territory (58%) Internal business product or process (i.e. no target market outside of business) (30%) Customers: Outside the state/territory but within Australia (22%) Customers: Oceania/Asia (6%) Customers: Rest of the world (i.e. Europe, Americas, Africa) (5%) There is another large red rectangular box with rounded edges at the bottom of the image. This box shows the top three commercialisation activities undertaken for an innovating business's most significant innovation and the proportion of innovating businesses that undertook the activities during the two years ended 30 June 2021. The top three activities were: Market research (27%) Training on how to market the good, service or process (15%) Acquisition of licenses, rights, patents and/or other Intellectual Property (8%)
  1. Proportions are of innovating businesses in each output category.
  2. Businesses could select more than one target market.
  3. Businesses could report more than one source of commercialisation activity and were not asked to rank factors in order of significance.

Data downloads

Post-release changes

22/07/2022 – Data Cube 1 Table 1 has been updated to include an additional column presenting data for Businesses that introduced any new or significantly improved Goods or Services and Business Processes.

22/07/2022 – As advertised on the ABS Website, an additional article containing experimental historical two-year innovation rate estimates has been released.

Previous catalogue number

This release previously used catalogue number 8158.0

Additional information about innovation in Australian businesses is available in catalogue number 8167.0, Characteristics of Australian Business

Back to top of the page