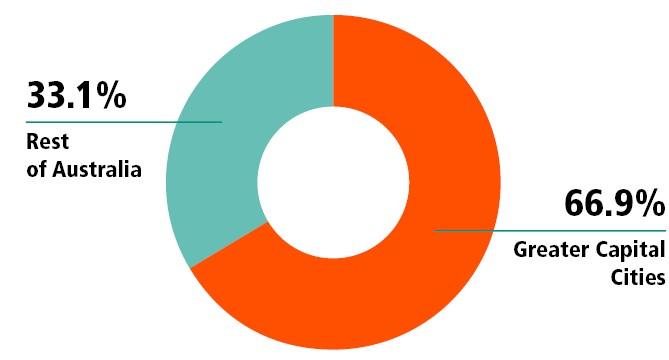
Capital cities versus regional population(a)
Image

Description
- Based on place of usual residence. Excludes overseas visitors. Rest of Australia includes Other Territories.
Source: Place of usual residence (PURP)
Information on place of usual residence, migration and place of work

Source: Place of usual residence (PURP)
| 2016 | 2021 | |
|---|---|---|
| New South Wales | 7,480,228 | 8,072,163 |
| Victoria | 5,926,624 | 6,503,491 |
| Queensland | 4,703,193 | 5,156,138 |
| South Australia | 1,676,653 | 1,781,516 |
| Western Australia | 2,474,410 | 2,660,026 |
| Tasmania | 509,965 | 557,571 |
| Northern Territory | 228,833 | 232,605 |
| Australian Capital Territory | 397,397 | 454,499 |
| Australia(b) | 23,401,892 | 25,422,788 |
Note there are small random adjustments made to all cell values to protect the confidentiality of data. These adjustments may cause the sum of rows or columns to differ by small amounts from table totals.
Source: Place of usual residence (PURP)
| 2016 | 2021 | |
|---|---|---|
| Greater Sydney | 4,823,991 | 5,231,147 |
| Greater Melbourne | 4,485,211 | 4,917,750 |
| Greater Brisbane | 2,270,800 | 2,526,238 |
| Greater Adelaide | 1,295,714 | 1,387,290 |
| Greater Perth | 1,943,858 | 2,116,647 |
| Greater Hobart | 222,356 | 247,086 |
| Greater Darwin | 136,828 | 139,902 |
| Australian Capital Territory | 396,857 | 453,890 |
| Total Greater Capital Cities | 15,575,618 | 17,019,956 |
Note there are small random adjustments made to all cell values to protect the confidentiality of data. These adjustments may cause the sum of rows or columns to differ by small amounts from table totals.
Source: Place of usual residence (PURP), Greater Capital City Statistical Area (GCCSA)
Articles and information papers that related to this topic include:
Comparing Place of Enumeration with Place of Usual Residence
Population movement in Australia (More information on population movement across Australia can be seen in our interactive map.)
Learn how Census data helps community groups, businesses and governments make important decisions.
The questions from the 2021 Census are output into variables. To see descriptions of the variables, including data use considerations, relevant to this topic see the 2021 Census dictionary: Location.
Other relevant data downloads can be found on the following pages:
To access more 2021 Census data, see Search Census data or to build your own data sets, see Census data tools.
Explore other ABS data:
12/10/2022 - Key statistics updated with information on internal migration. Location summary download file amended to include second release data tables.