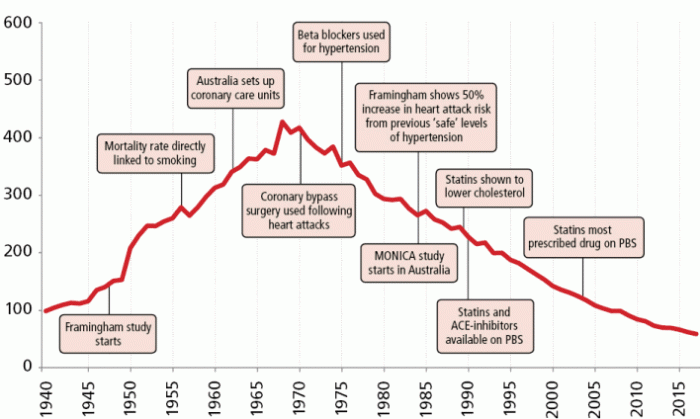
The release of the 2017 Causes of Death report marked half a century since 1968, the year that the heart disease epidemic in Australia reached its peak. In 1968, Ischaemic heart disease (IHD) accounted for almost one third of all deaths and half of those deaths were among people under 70 years of age.
After 1968 the death rate from IHD began to decline. Studies undertaken in response to the rapidly increasing mortality rates in the 1940s and 1950s began to highlight key risk factors and the earliest of interventions began to slow and reverse decades of increasing cardiovascular death rates.
Reductions in mortality over the past 50 years have seen life expectancy at birth increase by more than 10 years (increasing from 67.6 to 80.5 years for males, and from 74.2 to 84.6 years for females, when comparing 1965-67 with 2015-17 (ABS, 2014; ABS, 2018)). Over this period our understanding of diseases and ability to prevent and treat them has steadily grown.
This report examines changes in death rates over the past 50 years, focussing on cardiovascular diseases. It also provides information on advancements in understanding and treatment of cardiovascular diseases which have contributed to reductions in mortality and corresponding increases in life expectancy. Other key changes in patterns of mortality will be covered in subsequent releases.
Changes in leading causes of death
One of the simplest and most commonly used measures of mortality is the leading cause of death tabulation. The ABS bases leading cause tabulations on the Bulletin of the World Health Organization, Volume 84, Number 4, April 2006, 297-304. While there have been classification changes since 1968, correspondences have been used to construct a tabulation of leading causes for 1968 based on the same groups of conditions used in the present day. This is shown in the table below.
Show table
The leading causes of death in 1968 were characterised by high numbers of IHD and cerebrovascular disease deaths. In 1968 these conditions accounted for nearly 49,000 deaths and 44.5% of all deaths. In 2017 these conditions accounted for only 17.9% of all deaths. IHD accounted for almost 10 times the number of deaths as the 3rd ranked condition (Chronic lower respiratory diseases), highlighting an order of magnitude difference between deaths from IHD and other common causes of death.
Aside from IHD and stroke, two other key differences in leading causes between 1968 and 2017 were the ranking of Land transport accidents (4th in 1968 compared with 28th in 2017) and Certain conditions originating in the perinatal period (9th in 1968 compared with 42nd in 2017). These changes highlight the long term and cumulative effects of progressive road safety policies and mechanical/manufacturing advancements, as well as the wide ranging educational, medical and scientific advances which have reduced perinatal mortality rates.
The below table shows the leading causes ranked according to their order in 2017. Seven of the top ten leading causes remain the same conditions as those in 1968, but despite this, differences are quite profound.
Show table
In 2017, the decreased number and proportional contributions of IHD and stroke compared to 1968 are significant. However, as the remainder of this report will highlight, they provide only a small indication of the magnitude of change over time.
Another key difference between mortality in 2017 and 1968 is the emergence of Dementia, including Alzheimer disease, now the second leading cause. While increased life expectancy is the main reason for this increase, there are also death certification changes and classification changes which have contributed to the emergence of dementia as a leading cause.
Other changes in leading causes include the increased rank of Diabetes (7th in 2017 compared with 10th in 1968) and Malignant neoplasms of lymphoid, haematopoietic and related tissue (ranked 8th in 2017 compared with 14th in 1968).
While leading cause rankings give some indication of changes in patterns of mortality, other measures, such as standardised death rates, age-specific death rates, and years of potential life lost (as a measure of premature mortality), provide a more in-depth view of how changes have occurred across different population cohorts. The initial analysis in this report focuses on these measures for cardiovascular diseases, with other key changes in patterns of mortality to be covered in subsequent releases.
The graph below presents standardised death rates for the top 5 leading causes in 1968 alongside rates for 2017. It provides a further insight into the magnitude of the decrease in death rates for IHD and strokes by taking account of the change in the population size and structure over the 50-year period.
Show graph
While the magnitude of changes in cardiovascular disease mortality are the focus of this report, these changes do not indicate that IHD is less of a concern for individuals now than it was in 1968. Cardiovascular health is critically important for individuals, and while medical advances may have helped reduce mortality rates, especially among younger people, the maintenance of cardiovascular health can have a huge impact on both length and quality of life.
The Heart Foundation website (https://www.heartfoundation.org.au/) provides a wealth of information and resources about cardiovascular diseases in Australia.
