Australian National Accounts: Tourism Satellite Account

This is not the latest release View the latest release

Estimates of tourism’s direct contribution to the economy including GDP, value added, employment and consumption by product and industry

Reference period
2020-21 financial year
Released
10/12/2021

Key statistics

  • Tourism gross domestic product (GDP) fell 37.9% in chain volume terms.
  • Tourism's contribution to economy GDP fell from 2.6% to 1.6%.
  • Domestic tourism consumption fell 12.1%, and international fell 94.9% in chain volume terms.
  • Tourism employed persons fell 20.3% to 507,000 people.
2019-20 to 2020-21 % change 
  TourismTotal Economy
Gross Domestic Product (GDP)   
 Current prices-36.74.3
 Chain volume measure-37.91.5
Gross Value Added at basic prices   
 Current prices-37.94.0
 Chain volume measure-39.11.3
Employed persons -20.31.1
Hours worked index -19.20.3
Gross value added per hour worked -24.61.1


2020-21 tourism overview

Tourism economic activity this financial year was impacted by the COVID-19 pandemic, leading to all tourism key statistics falling to their lowest level since 2005-06. Whilst this event impacted the entire Australian economy, tourism has been affected disproportionately with all measures falling more than each of the corresponding economy-wide measures. 

Direct tourism

All references to "tourism" are referring to "direct tourism" unless otherwise specified. A direct tourism impact occurs where there is a direct (physical and economic) relationship between the visitor and producer of a good or service. For more information, refer to the Methodology section.

(a) Chain volume measures source: Australian System of National Accounts.

(b) There are some scope differences between Labour Force, Australia, Detailed, Quarterly (LFS) and Tourism Satellite Account's (TSA) total employment measure. Please refer to the Methodology section for details.

Chain volume measures

  • GDP fell 37.9% to $31.8b, the lowest level in the 17-year published time series. This compares to the 1.5% growth to $2,010.1b in the economy-wide measure, the highest level in the time series.
  • Gross value added (GVA) fell 39.1% to $28.7b, the lowest level in the 17-year published time series. This compares to the 1.3% growth in the corresponding economy-wide measure.
  • Internal tourism consumption fell 33.9% to $82.4b. This is made up of a 12.1% fall to $80.7b in domestic and a 94.9% fall to $1.7b in international consumption, which are now at the lowest level in the 17-year published time series.
  • The 12.1% fall in domestic tourism consumption is made up of household consumption, which fell 9.8% to $66.9b, and business consumption which fell 21.8% to $13.8b. 
  • Tourism labour productivity measured as GVA per hours worked fell 24.6%, the lowest level in the 17-year published time series. This compares to the 1.1% increase in the corresponding economy-wide measure.

Current price measures

  • GDP fell 36.7% to $32.4b, the lowest level since 2005-06.
  • GVA fell 37.9% to $29.3b, the lowest level since 2005-06.
  • Tourism contributed 1.5% to total economy GVA, which is the smallest contribution in the 17-year time series.

Tourism employment

  • There were 507,000 people employed in tourism, a fall of 129,200 people.
  • Share of total employment was 3.9%, the lowest in the 17-year published time series.
  • Full-time fell 26.1% to 251,400 and part-time fell 13.7% to 255,600 employed persons.
  • Male employment fell 16.1% to 248,200 and female employment fell 24.0% to 258,800.
  • Hours worked fell 19.2%, this compares to a 0.3% increase in the corresponding economy-wide measure.

Key considerations in data interpretation

Key 2020-21 COVID-19 dates

Tourism estimates

One of the key assumptions made in the methodology of the Tourism Satellite Account (TSA) is that the structure of the economy changes slowly over time and therefore structural relationships within the account are relatively stable from year to year. For this reason the relationships are generally updated every 3 years as part of the benchmark process (see the Methodology section for more information). This assumption holds well except when there are sudden economic shocks that result in structural changes in the economy. COVID-19 is such an event. When shocks occur, best practise is to review and update the underlying relationships to ensure estimates accurately reflect the events. For details on the changes made due to COVID-19, please refer to the next section on Changes in this issue.

The International Visitor Survey (IVS) data sourced from Tourism Research Australia (TRA) is one of the key inputs to TSA. Due to the international border closure and the potential public health risk during the pandemic, IVS interviews were paused during the September 2020, December 2020 and March 2021 quarters. For information on TRA COVID-19 changes, please refer to their webpage

The IVS data used to compile the 2020-21 TSA is therefore partially imputed. For details on the potential implications of this, please refer to the Methodology section on Measurement Error. 

Tourism employment estimates

ABS has been publishing a new experimental publication on quarterly tourism labour statistics since March quarter 2020. Users are reminded that the estimates in this annual release are based on a different data source and are not directly comparable to the estimates provided in the quarterly tourism labour statistics publication. For more information on the strengths and differences between the two employment measures, please refer to the article published in March quarter 2020. 

The data sources and methodology of the employment statistics produced in this annual publication are consistent with those used in the previous annual TSA.

Please note the 2020-21 release is the last TSA annual with employed persons estimated based on Labour Force Survey data. This is because ABS will be moving to use the Labour Account as the main data source for estimates of tourism employment, aligning with the quarterly tourism labour statistics. Due to the large number of secondary jobs and the highly casualised nature of the tourism workforce, jobs are a more meaningful measure than employed persons.

Changes in this issue

Removing the series break in National Visitor Survey (NVS) source data

As mentioned in the previous release, there is a series break in the 2018-19 Tourism Research Australia's (TRA) NVS data. TRA indicated this is a result of moving to 100% mobile phone sampling from March quarter 2019, which caused a level shift in the domestic expenditure and visitors estimates. 

In 2020-21, the ABS has removed the series break by continuing to maintain the level of the existing time series. This is done by applying the percentage movement between 2019-20 and 2020-21 National Visitor Survey estimates to the level of the existing TSA series. TSA will continue with this approach until such time sufficient data on the new sample basis is available to allow TSA to do a historical revision. Due to the COVID-19 disruption, it is now expected that it may be some time before the impact of the NVS break can be quantified.

Changes made due to COVID-19

The rapid compositional change and structural shifts of the economy brought about by the COVID-19 pandemic meant it is no longer appropriate to establish a benchmark that will be used to represent the structure of the industry for the following 3 years. The ABS will therefore be temporarily moving to an annual coefficient-only benchmark starting in the 2020-21 release until at least 2022-23 where an impact assessment will be conducted to determine if the relationships have changed materially to warrant the continuation of this approach. 

In balancing quality with timeliness, all annual coefficient benchmarks will be prepared on a T-2 basis and published in December each year. The historical revisions will be postponed until the economy returns to 'normal' or stabilises at a new COVID-19 norm.

Analysis of results

In TSA, the contribution of tourism to the Australian economy has been measured using the demand generated by visitors and the supply of tourism products by domestic producers.

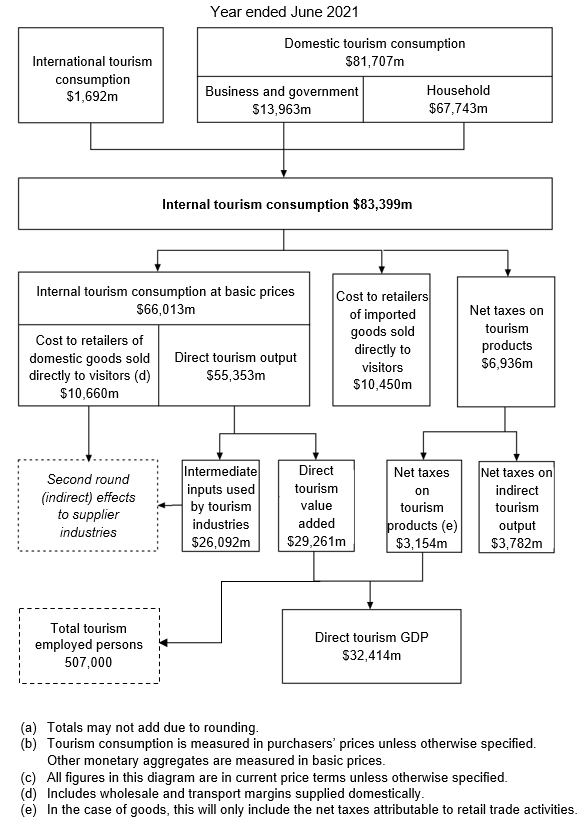
The diagram below provides a graphical depiction of the flow of tourism consumption through the Australian economy in 2020-21. What the diagram highlights is that unlike traditional ANZSIC industries in the Australian National Accounts, tourism is not measured by the output of a single industry, but rather from the demand side i.e. the activities of visitors. It is the products that visitors consume that define what the tourism economy produces. The diagram shows how the value of internal tourism consumption (as measured by the sum of international and domestic tourism consumption in purchasers prices, i.e. the price the visitor pays) is disaggregated to either form part of tourism GVA and tourism GDP, or is excluded as it either forms part of the "second round" indirect effects of tourism or the output was not domestically produced.

Flow of tourism consumption through the Australian Economy (a)(b)(c)

Image: shows the flow of tourism consumption through the Australian economy in 2020-21.
A flow chart representing the flow of tourism consumption through the Australian economy, year ending June 2021. Note, totals may not add due to rounding; tourism consumption is measured in purchasers’ prices unless otherwise specified. Other monetary aggregates are measured in basic prices; all figures in this diagram are in current price terms unless otherwise specified. Domestic tourist consumption to the value of $81,707 million is comprised of business and government, to the value of $13,963 million, and household, to the value of $67,743 million. International tourism consumption, to the value of $1,692 million, combines with domestic tourist consumption to create internal tourism consumption, to the value of $83,399 million. Internal tourism consumption splits into three values; internal tourism consumption at basic prices, to the value of $66,013 million; cost to retailers of imported goods sold directly to visitors, to the value of $10,450 million, and net taxes on tourism products to the value of $6,936 million. Internal tourism consumption at basic prices is comprised of cost to retailers of domestic goods sold directly to visitors, including wholesale and transport margins supplied domestically, to the value of $10,660 million; and direct tourism output, to the value of $55,353 million. Direct tourism output flows into two values; intermediate inputs used by tourism industries, to the value of $26,092 million; and direct tourism value added, to the value of $29,261 million. Cost to retailers of domestic goods sold directly to visitors and intermediate inputs used by tourism industries connect to second round (indirect) effects to supplier industries. Net taxes on tourism products flows into two values; tourism net taxes on tourism products (in the case of goods this will only include the net taxes attributable to retail trade activities), to the value of $3,154 million; and net taxes on indirect tourism output to the value of $3,782 million. Direct tourism value added and tourism net taxes on tourism products combine to create direct tourism GDP, to the value of $32,414 million. Direct tourism value added is used to estimate total tourism employed persons, to the value of 507,000 employed persons.

Revisions

Revisions are a necessary and expected part of accounts compilation as data sources are updated and improved over time. This issue includes revisions to tourism aggregates from 2016-17. 

Revisions in the 2020-21 release include:

  • Revisions to both domestic and international tourism expenditure as a result of the TSA annual balancing and confrontation process. This is particularly the case for tourism products where the estimates have been modelled using a range of source data.
  • Replacing modelled 2019-20 net taxes, imports and margins data with the latest issue of Australian National Accounts: Supply Use Tables (available on a T-1 basis) for 2019-20. 
  • Additional revisions to international tourism consumption due to the incorporation of updated data from the Survey of International Trade in Services (SITS) and proportions of short term visitors from Net Overseas Migration. TSA uses these data sources to estimate education consumption by international visitors. Data for 2019-20 have been revised since the last TSA release. 

Revision to tourism employment due to:

In addition, economy wide national accounting aggregates have been revised across the entire series to ensure consistency with the 2020-21 issue of the Australian System of National Accounts published on 29 October 2021. The latest Australian System of National Accounts include updates made through the targeted historical revisions (see article for more details). These revisions affect tourism's share of GDP and GVA presented in tables 1, 2 and 6 of the TSA data cube. 

Please note, the revisions to the chain volume estimates level across the time series are an expected part of re-referencing the indexes to 100 in the latest reference year (2019-20).

Data downloads

Australian National Accounts: Tourism satellite account

Create your own tables and visualisations

ABS provide access to a number of other datasets for you to create your own tables and make visualisations. See what's available in Data Explorer

Caution: Data in Data Explorer is currently released after the 11:30am release on the ABS website. Please check the reference period when using Data Explorer. For information on Data Explorer and how it works, see the Data Explorer user guide.

Inquiries

For further information about these and related statistics, please contact the Customer Assistance Service via the ABS website Contact Us page. The ABS Privacy Policy outlines how the ABS will handle any personal information that you provide to us. 

Previous catalogue number

This release previously used catalogue number 5249.0.

Back to top of the page