The ABS will be closed from 12.00pm, 24 December 2024 and will reopen at 9.00am, 2 January 2025. During this time there will be no statistical releases and our support functions will be unavailable. The ABS wishes you a safe and happy Christmas.

Australian National Accounts: Tourism Satellite Account

This is not the latest release View the latest release

Estimates of tourism’s direct contribution to the economy including GDP, value added, employment and consumption by product and industry

Reference period
2018-19 financial year
Released
12/12/2019

Main features

Key figures

2017-18 to 2018-19 % change
TourismTotal Economy
Gross Domestic Product (GDP)
Current prices6.05.3
Chain volume measure3.41.9
Gross Value Added at basic prices
Current prices6.15.4
Chain volume measure3.31.9
Employed persons3.32.4
Hours worked index2.62.1
Gross value added per hour worked0.6-0.2


Chain volume measures source: Australian System of National Accounts (cat. no. 5204.0)
 

2018-19 key points

Chain volume measures

  • Direct tourism Gross Domestic Product (GDP), in volume terms, increased by 3.4%, compared with real GDP growth of 1.9%.
  • Direct tourism gross value added at basic prices, in volume terms increased by 3.3%, compared to gross value added for all industries which increased by 1.9%.
  • Internal tourism consumption (total domestic and international consumption in Australia) in volume terms, increased by 3.1%. Of this figure, domestic tourism consumption increased by 3.4% while international tourism consumption grew by 2.0%.
  • Direct tourism gross value added per hour worked (a measure of tourism labour productivity) increased by 0.6% compared to growth for the whole economy which fell by -0.2%.
     

​​​​​​​Current price measures

GDP

  • Direct tourism GDP increased by 6.0% to $60,821m, compared with GDP growth of 5.3%.
  • Tourism share of GDP remained unchanged at 3.1%.
     

​​​​​​Industry gross value added

  • Direct tourism gross value added increased by 6.1% to $55,939m.
     

​​​​​​​Tourism consumption

  • Internal tourism consumption increased by 6.2% to $152,039m.
  • Domestic tourism consumption increased by 6.7% to $112,893m.
  • Tourism exports (international tourism consumption in Australia) increased by 4.6% to $39,145m.
  • Tourism imports (outbound tourism consumption by Australian residents on outbound trips) increased by 7.8% to $58,306m.
     

​​​​​​Tourism employment

  • Tourism employed persons increased by approximately 21,500 employees to approximately 666,000 employed persons.
  • Tourism share of total employment remained stable at 5.2%.
  • Hours worked in tourism increased by 2.6%, compared with an increase of 2.1% for the overall economy.
Analysis of results

In the Australian Tourism Satellite Account (TSA) the direct contribution of tourism to the Australian economy has been measured using the demand generated by visitors and the supply of tourism products by domestic producers.

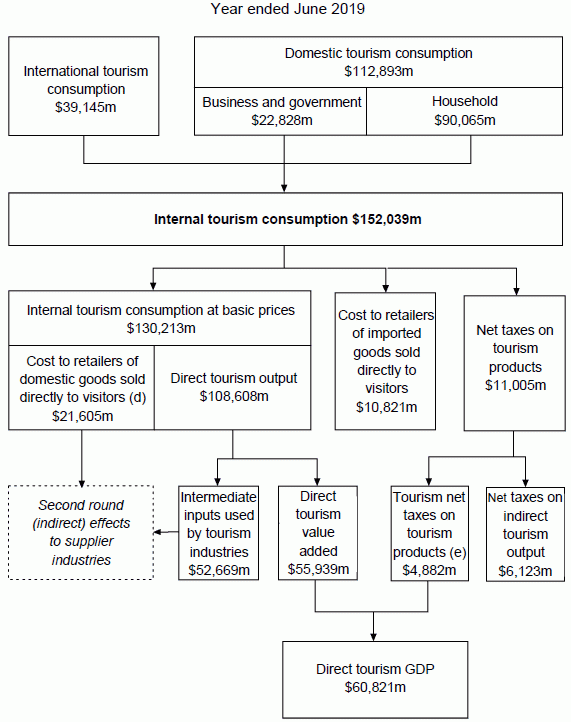
The diagram below provides a graphical depiction of the flow of tourism consumption through the Australian economy in 2018-19. What the diagram highlights is that unlike traditional ANZSIC industries in the Australian National Accounts, tourism is not measured by the output of a single industry, but rather from the demand side i.e. the activities of visitors. It is the products that visitors consume that define what it is that the tourism economy produces. That is, the diagram shows how the value of internal tourism consumption (as measured by the sum of international and domestic tourism consumption in purchasers prices, i.e. the price the visitor pays) is disaggregated to either form part of tourism gross value added and tourism Gross Domestic Product (GDP) or it is excluded as it either forms part of the "second round" indirect effects of tourism or the output was not domestically produced.
 

Flow of tourism consumption through the Australian economy (a)(b)(c)

"Image: shows the flow of tourism consumption through the Australian economy in 2018-19. Internal tourism consumption (domestic and international consumption) in 2018-19 was $152,039 million. This equated to a tourism GDP estimate of $60,821 million.”
A flow chart representing the flow of tourism consumption through the Australian economy, year ended June 2019. Note, totals may not add due to rounding; tourism consumption is measured in purchasers’ prices unless otherwise specified. Other monetary aggregates are measured in basic prices; all figures in this diagram are in current price terms unless otherwise specified. Domestic tourist consumption to the value of $112,893 million is comprised of business and government, to the value of $22,828 million, and household, to the value of $90,065 million. International tourism consumption, to the value of $39,145 million, combines with domestic tourist consumption to create internal tourism consumption, to the value of $152,039 million. Internal tourism consumption splits into three values; internal tourism consumption at basic prices, to the value of $130,213; cost to retailers of imported goods sold directly to visitors, to the value of $21,605 million, and net taxes on tourism products to the value of $11,005 million. Internal tourism consumption at basic prices is comprised of cost to retailers of domestic goods sold directly to visitors, including wholesale and transport margins supplied domestically, to the value of $10,821 million; and direct tourism output, to the value of $108,608 million. Direct tourism output flows into two values; intermediate inputs used by tourism industries, to the value of $52,669 million; and direct tourism value added, to the value of $55,939 million. Cost to retailers of domestic goods sold directly to visitors and intermediate inputs used by tourism industries connect to second round (indirect) effects to supplier industries. Net taxes on tourism products flows into two values; tourism net taxes on tourism products (in the case of goods this will only include the net taxes attributable to retail trade activities), to the value of $4,882 million; and net taxes on indirect tourism output to the value of $6,123 million. Direct tourism value added and tourism net taxes on tourism products combine to create direct tourism GDP, to the value of $60,821 million. a. Totals may not add due to rounding b. Tourism consumption is measured in purchasers' prices unless otherwise specified. Other monetary aggregates are measured in basic prices. c All figures in this diagram are in current price terms unless otherwise specified. d. Includes wholesale and transport margins supplied domestically. e. In the case of goods, this will only include the net taxes attributable to retail trade activities.

a. Totals may not add due to rounding
b. Tourism consumption is measured in purchasers' prices unless otherwise specified.
    Other monetary aggregates are measured in basic prices.
c. All figures in this diagram are in current price terms unless otherwise specified.
d. Includes wholesale and transport margins supplied domestically.
e. In the case of goods, this will only include the net taxes attributable to retail trade activities.

Revisions in this issue

Revisions are a necessary and expected part of accounts compilation as data sources are updated and improved over time. This issue includes revisions to tourism aggregates for the years subsequent to the latest (2016-17) benchmark.

Revisions to 2017-18 data include:

  • Revisions to domestic tourism expenditure and consumption. These are a result of:
     
    • Revisions to National Accounts source data used in the compilation of estimates of tourism demand. Consequently, estimates of tourism industry output, tourism value added and tourism gross domestic product in the TSA have also been revised.
    • Revisions to Tourism Research Australia's (TRA) National Visitor Survey (NVS) data. The NVS data has been revised back to 2017-18 to align with the latest release of the ABS population projections that are used to benchmark NVS results to the Australian population. Further information can be found at National Visitor Survey Methodology.
    • Adjustments as a result of the TSA annual balancing and confrontation process. This is particularly the case for tourism products where the estimates have been modelled using a range of source data.
       
  • Revisions to international tourism consumption. These are a result of:
     
    • Revising estimates for Imputed and actual rent on vacation homes as well as imputations for the costs to host households (for example Food, alcohol and other beverage products and Shopping, gifts and souvenirs etc.). These revisions reflect some small changes to the number of international visitor nights where visitors are staying in their own property or with friends and relatives.
    • The incorporation of updated data from the Survey of International Trade in Services (SITS). The TSA uses short term visitor data from SITS to estimate education consumption by international visitors. Data for 2017-18 has been revised since the last TSA release.
    • Small upward revisions for international airfares in 2017-18 as a consequence of revisions to air passenger transport service credits in the September 2019 issue of International Trade in Goods and Services, Australia (5368.0).


Although generally the TSA is only revised back to the years subsequent to the latest benchmark, there are two key exceptions in this release:

  • Minor revisions to tourism employment across the time series, which are a consequence of :
     
    • Revisions to data published in Labour Force, Australia, Detailed, Quarterly (cat. no. 6291.0.55.003).
    • Updated seasonal analysis factors from Labour Force have been incorporated in all periods to reduce the variability in the tourism industry estimates.
    • Minor adjustments to selected tourism industries to reflect some changes to the tourism value added ratio since the benchmark.
       
  • Consumption by international visitors outside Australia as part of an inbound trip (non-resident to non-resident expenditure). This data item is a stand alone series and does not impact on estimates of Tourism GDP. This series has been revised for the whole time series as a result of the following:
     
    • Improvements to the estimated consumption of air services provided by foreign carriers;
    • Changes to travel agent margins to ensure consistency between margins paid by domestic travellers and residents travelling overseas; and
    • Revisions to non-resident pre-purchased international airfares and international airfares purchased in Australia. These revisions are a result of utilising more recent data on resident/foreign carriers market shares.


In addition, economy wide national accounting aggregates have also been revised across the entire series to ensure consistency with published estimates in the 2018-19 issue of Australian System of National Accounts (cat. no. 5204.0) published on 25 October 2019. These revisions affect tourism's share of GDP and GVA presented in Tables 1, 2 and 5 of the TSA data cube.

Note also that revisions to the chain volume estimates level across the time series are an expected part of re-referencing the indexes to 100 in the latest reference year (2017-18).

Data downloads

Australian National Accounts: Tourism satellite account

Changes in this issue

This release is impacted by a series break in Tourism Research Australia's (TRA) National Visitor Survey with respect to 2018-19. TRA have indicated that the move to 100% mobile sampling from the March quarter 2019 has resulted in a level shift in the domestic expenditure and visitors estimates. However, rather than revising the complete time series of the Tourism Satellite Account (TSA) at this point, the ABS has maintained the level of the existing time series but estimated what the level of the 2018-19 data would have been without the series break. As a consequence, significant adjustments were required to be made to the 2018-19 product level estimates from the National Visitor Survey. These adjustments were in line with advice provided by TRA and were applied consistently across a range of products, except where alternative data sources have identified an alternative growth rate was applicable for a particular product. These adjustments apply only to data in the 2018-19 reference year.

In the 2019-20 release of the TSA, due for release in December 2020, the movement in the levels of the National Visitor Survey between 2018-19 and 2019-20 will be applied to the existing TSA series. However, in the following release, that is the 2020-21 release including a new benchmark reference year of 2019-20, the full time series of the TSA will be revised to reflect the revised levels of the National Visitor Survey data. This is in accordance with ABS' revision rules and will also allow sufficient time to determine over what period the revisions from the break in the series should be applied to.

Furthermore, as a result of the series break in the National Visitor Survey, no estimates of visitor numbers are included in this release. Likewise, estimates of average visitor expenditure are also not included in this release. This has resulted in two less tables in this release and a re-ordering of the existing tables when compared to a previous TSA "update" year, e.g. the 2016-17 release.

As well as the changes noted above, new estimates of direct tourism employment by gender by status in employment (ie. full time and part time workers) are included from this release.

A number of revisions were also made to the TSA estimates with respect to 2017-18 in this release due to revisions to a range of TSA source data. Please see the Revisions in this Issue section for more details.

Inquiries

For further information about these and related statistics, please contact the National Information and Referral Service on 1300 135 070. The ABS Privacy Policy outlines how the ABS will handle any personal information that you provide to us.

Previous catalogue number

This release previously used catalogue number 5249.0.
 

Back to top of the page