Australian National Accounts: Tourism Satellite Account

This is not the latest release View the latest release

Estimates of tourism’s direct contribution to the economy including GDP, value added, employment and consumption by product and industry

Reference period
2017-18 financial year
Released
1/05/2019

Main features

Key figures

2016-17 to 2017-18 % change
TourismTotal Economy
Gross Domestic Product (GDP)
Current prices7.14.7
Chain volume measure5.02.8
Gross Value Added at basic prices
Current prices7.14.8
Chain volume measure5.02.8
Employed persons4.63.0
Hours worked index2.72.6
Gross value added per hour worked1.90.2


2017-18 key points

Chain volume measures

  • Direct tourism Gross Domestic Product (GDP), in volume terms, increased by 5.0%, compared with real GDP growth of 2.8%.
  • Direct tourism gross value added at basic prices, in volume terms increased by 5.0%, compared to gross value added for all industries which increased by 2.8%.
  • Internal tourism consumption (total domestic and international consumption in Australia) in volume terms, increased by 4.3%. Of this figure, domestic tourism consumption increased by 3.9% while international tourism consumption grew by 5.3%.
  • Direct tourism gross value added per hour worked (a measure of tourism labour productivity) increased by 1.9% compared to growth for the whole economy of 0.2%.

Current price measures

GDP

  • Direct tourism GDP increased by 7.1% to $57,254m, compared with GDP growth of 4.7%.
  • Tourism share of GDP increased from 3.0% to 3.1%.

Industry gross value added

  • Direct tourism gross value added increased by 7.1% to $52,607m.

Tourism consumption

  • Internal tourism consumption increased by 6.8% to $143,372m.
  • Domestic tourism consumption increased by 6.7% to $105,982m.
  • Tourism exports (international tourism consumption in Australia) increased by 7.3% to $37,391m.
  • Tourism imports (outbound tourism consumption by Australian residents on outbound trips) increased by 10.5% to $53,956m.

Tourism employment

  • Tourism employed persons increased by approximately 28,400 employees to 646,000 employed persons.
  • Tourism share of total employment increased from 5.1% to 5.2%.
  • Hours worked in tourism increased by 2.7%, compared with an increase of 2.6% for the overall economy.

Analysis of results

In the Australian Tourism Satellite Account (TSA) the direct contribution of tourism to the Australian economy has been measured using the demand generated by visitors and the supply of tourism products by domestic producers.

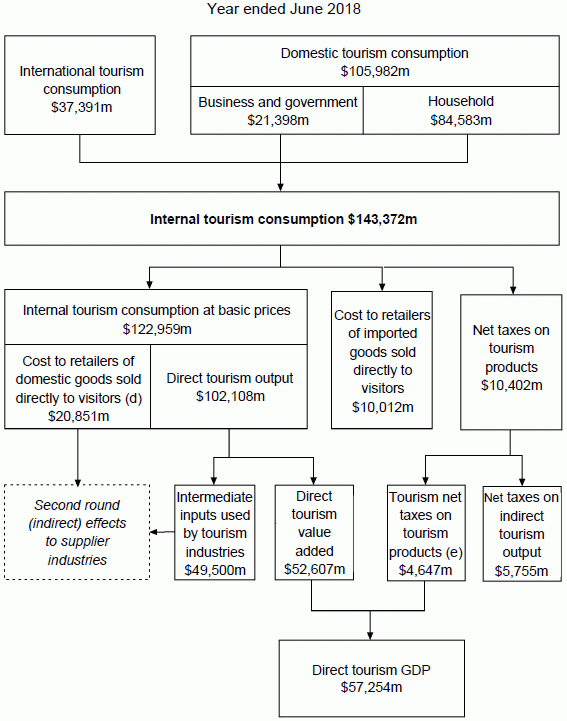
The diagram below provides a graphical depiction of the flow of tourism consumption through the Australian economy in 2017-18. What the diagram highlights is that unlike traditional ANZSIC industries in the Australian National Accounts, tourism is not measured by the output of a single industry, but rather from the demand side i.e. the activities of visitors. It is the products that visitors consume that define what it is that the tourism economy produces. That is, the diagram shows how the value of internal tourism consumption (as measured by the sum of international and domestic tourism consumption in purchasers prices, i.e. the price the visitor pays) is disaggregated to either form part of tourism gross value added and tourism Gross Domestic Product (GDP) or it is excluded as it either forms part of the "second round" indirect effects of tourism or the output was not domestically produced.

Flow of tourism consumption through the Australian economy (a)(b)(c)

Image: shows the flow of tourism consumption through the Australian economy in 2017-18.
A flow chart representing the flow of tourism consumption through the Australian economy, year ended June 2018. Note, totals may not add due to rounding; tourism consumption is measured in purchasers’ prices unless otherwise specified. Other monetary aggregates are measured in basic prices; all figures in this diagram are in current price terms unless otherwise specified. Domestic tourist consumption to the value of $105,982 million is comprised of business and government, to the value of $21,398 million, and household, to the value of $84,583 million. International tourism consumption, to the value of $37,391 million, combines with domestic tourist consumption to create internal tourism consumption, to the value of $143,372 million. Internal tourism consumption splits into three values; internal tourism consumption at basic prices, to the value of $122,959; cost to retailers of imported goods sold directly to visitors, to the value of $10,012 million, and net taxes on tourism products to the value of $10,402 million. Internal tourism consumption at basic prices is comprised of cost to retailers of domestic goods sold directly to visitors, including wholesale and transport margins supplied domestically, to the value of $20,851 million; and direct tourism output, to the value of $102,108 million. Direct tourism output comprised of two values; intermediate inputs used by tourism industries, to the value of $49,500 million; and direct tourism value added, to the value of $52,607 million. Cost to retailers of domestic goods sold directly to visitors and intermediate inputs used by tourism industries connect to second round (indirect) effects to supplier industries. Net taxes on tourism products comprised of two values; tourism net taxes on tourism products (in the case of goods this will only include the net taxes attributable to retail trade activities), to the value of $4,647 million; and net taxes on indirect tourism output to the value of $5,755 million. Direct tourism value added and tourism net taxes on tourism products combine to create direct tourism GDP, to the value of $57,254 million.

a. Totals may not add due to rounding
b. Tourism consumption is measured in purchasers' prices unless otherwise specified.
    Other monetary aggregates are measured in basic prices.
c. All figures in this diagram are in current price terms unless otherwise specified.
d. Includes wholesale and transport margins supplied domestically.
e. In the case of goods, this will only include the net taxes attributable to retail trade activities.

Revisions in this issue

Revisions are a necessary and expected part of accounts compilation as data sources are updated and improved over time. It is standard practice in National Accounts benchmarking to review all source data and incorporate revisions.

The TSA methodology usually involves estimating a full benchmark every third year. When a new benchmark reference year is added, it normally has a two year lag in relation to the latest reference year for the TSA (in this case 2017-18). In this release, the new benchmark reference year has been moved forward to 2016-17 (rather than 2015-16) so that the benchmark is one year closer to the most recent reference year period. See the Explanatory Notes for a description of the benchmark methodology.

As part of the 2016-17 benchmark process, the relationships (coefficients) established in 2012-13 have been reviewed and adjusted. In addition, coefficients from the 2009-10 and 2006-07 benchmarks have also been updated and revised as required to ensure consistent time series.

Latest industry data, Supply and Use tables and other input data series have been incorporated into this release and have resulted in a range of revisions across the time series. This release also incorporates revised data on international visitors, nights and spend estimates between 2005 to 2018 from Tourism Research Australia published in International Visitor Survey (IVS) for Year Ending December 2018. Furthermore, improvements to estimation methods listed in the Changes in this issue section have also resulted in revisions. These revisions include the following:

  • Estimates of tourism consumption and output have been revised following confrontation between demand and supply side data in the 2016-17, 2012-13, 2009-10 and 2006-07 benchmark reference years with targeted adjustments. These include Accommodation services, Airfares, Takeaway and restaurant meals and Travel agency and information centre services.
  • Estimates of outbound tourism consumption have been revised as a consequence of revisions to 5368.0 - International Trade in Goods and Services, Australia, Sep 2018, and through further revisions noted below for international and domestic consumption.
  • Estimates of international tourism consumption have been revised as a consequence of improvements made to estimation methods for particular products and incorporation of updated data sources. This has resulted in major revisions for:
     
    • Travel agency and information centre services product - including upward revisions to the level of the series which involved a reallocation of expenditure from some other tourism products as well as new estimates on services provided by tourist information centres to international visitors.
    • International airfares - with improvements to current estimation methods (re-allocation of package tour, organised tour and conference fee) and incorporating revisions to Other personal travel as published in 5368.0 - International Trade in Goods and Services, Australia, Aug 2016 from 2012-13 onward.
    • Education services - including improved modelled estimates for short-term student visitors (stay less than 12 out of 16 months) between 2005-06 to 2016-17.
    • Motor vehicle, caravan and boats etc - through updated methodology to better estimate removal of second-hand purchases based on more detailed data captured by TRA in their International Visitor Survey.
       
  • Estimates of domestic tourism consumption have also been revised as a consequence of improvements made to estimation methods for particular products and the incorporation of updated data sources. This has resulted in major revisions for:

    • Domestic airfares - through improved estimates (across the time series) on domestic airfares undertaken by travellers prior to an international trip.
    • Travel agency and information centre services - including upward revisions to the level of the series which involved a reallocation of expenditure from some other tourism products as well as new estimates on services provided by tourist information centres to national visitors..
    • Recreational, cultural and gambling services - mainly driven by updated methodology to account for imputed values of non-market services provided directly to visitors such as public museums (refer to Explanatory Notes, para 25), and improved methodology for estimating gambling expenditure by domestic visitors.
    • Outbound expenditure, that is expenditure by Australians travelling abroad on goods or services provided on Australian domestic territory (either before or after the trip), has been revised following improvements made to estimation methods for particular products. Refer to Explanatory Notes, para 24 for more information on outbound expenditure.
       
  • Estimates of Imputed and actual rent on holiday homes used by international and domestic visitors have been revised due to revisions to the dwelling stock number published in 5204.0 - Australian System of National Accounts, 2017-18.
  • Estimates of tourism employment and hours worked have been revised throughout the whole time series due to multiple factors. These include:
     
    • Revisions to Labour Force Survey (LFS) data due to major re-benchmarking to align with the latest population numbers. Further information can be found at 6202.0.55.003 - Labour Force, Australia - Rebenchmarked Estimates, October 2017
    • Updated seasonal analysis factors have been incorporated in all periods to reduce the variability in the tourism industry estimates. For more information, refer to Explanatory Notes section, para 79.
    • Revisions to tourism industry value-added for all industries due to re-benchmarking (for 2012-13, 2009-10 and 2006-07), which have resulted in changes to the value added ratios applied to the LFS data across the whole time series.


As usual economy wide national accounting aggregates have been revised across the entire series to ensure consistency with published estimates in the 2017-18 issue of Australian System of National Accounts (cat. no. 5204.0) published on 26 October 2018. These revisions affect tourism shares of GDP and GVA presented in Tables 1, 2, 5, 6 and 10 of the TSA.

Note also that revisions to the level of the entire series for the tourism chain volume estimates are an expected part of re-referencing the indexes to equal 100 in the latest reference year (2016-17).
Data downloads

Australian National Accounts: Tourism satellite account

Changes in this issue

In this release, the new benchmark reference year of 2016-17 is one year later than the usual 3 yearly benchmark update (which would have been 2015-16) to ensure closer aligned representation of the tourism economy to the most recent reference year. In addition to introducing a new benchmark for the reference year 2016-17, the 2012-13 benchmark has also been updated and revised to incorporate revisions to source data. Previous benchmark relationships in 2009-10 and 2006-07 have also been re-opened and adjusted where required due to revised source data.

Being a benchmark release, additional tables are included which incorporate tourism industry ratios in tables 5, 7 and 8, while additional product detail and ratios have been provided in tables 9 and 10.

From this release, data prior to 2004-05 will no longer be published due to series breaks in the source data. Historical values will however still be available online from earlier releases although the levels will not be directly comparable to the current series.

Some changes to data sources and estimation methods for a selection of tourism products and industries have also been incorporated in this release. These changes were incorporated to improve estimates of tourism consumption, output and value added. These changes include:

  • updated ratios used for the allocation of domestic visitors' packaged and organised tour expenditure across tourism products. Adopting the approach used for International visitors, domestic packaged and organised tour expenditure are now redistributed to a number of tourism products using the average expenditure of non-packaged tour travellers for each package tour component;
  • the 'Travel agency and tour operator services' product and industry titles have been changed to 'Travel agency and information centre services'. This is to account for the inclusion of services provided by Tourist Information Centres to visitors (please refer to Explanatory Notes, para 69); and
  • improvements to the methodology to estimate domestic airfares undertaken by domestic travellers prior to an international trip.


In addition, revisions across the time series for most tourism aggregates have been incorporated in this release due to historical revisions to a range of TSA source data. Please see the Revisions in this Issue section for more details.

Inquiries

For further information about these and related statistics, please contact the National Information and Referral Service on 1300 135 070. The ABS Privacy Policy outlines how the ABS will handle any personal information that you provide to us.

Previous catalogue number

This release previously used catalogue number 5249.0.
 

Back to top of the page