The ABS will be closed from 12.00pm, 24 December 2024 and will reopen at 9.00am, 2 January 2025. During this time there will be no statistical releases and our support functions will be unavailable. The ABS wishes you a safe and happy Christmas.

Business Indicators, Business Impacts of COVID-19

This is not the latest release View the latest release

Insights into the prevalence and nature of impacts from COVID-19 on businesses operating in Australia

Reference period
July 2020
Released
30/07/2020

Key statistics

  • Two in five businesses are currently accessing support measures.
  • If support measures were no longer available, one in ten businesses expect to close.
  • 54% received government support via the Boosting Cash Flow for Employers measure.
  • 47% reported that revenue decreased over the past month.

Business impacts of COVID-19 survey

This publication provides information on the incidence and nature of impacts due to COVID-19, as experienced by businesses operating in Australia.

Topics covered in this release include:

  • Business revenue, operating expenses and employment, past month and next month;
  • Support measures used by businesses and expected actions when they are no longer available;
  • Workforce difficulties experienced by employing businesses.
     

The collection was conducted through a telephone survey between 15 July and 23 July 2020. The sample size was 2,000 businesses and the final response rate was 50% (997 responding businesses).

This release forms part of the suite of additional products that the ABS is producing to measure the impact of COVID-19. Future information collected in this survey will evolve to maintain relevance in a changing environment.

Business revenue, operating expenses and employment, last month and next month

Businesses reported on changes in business revenue, operating expenses and number of employees over the last month and sentiments around expected changes over the next month. Businesses were asked to provide a best estimate only, without accessing business records or reports.

Business revenue, operating expenses and employment, last month and next month, July 2020(a)

a. Proportions are of all businesses

Almost half of all businesses (47%) reported that revenue had decreased in the previous month. For the next month, 27% expected revenue to decrease and 49% expected revenue to stay the same.

Four in five businesses (80%) reported no change in the number of employees over the previous month and five in six (85%) expected no change next month. Fewer businesses expected a decrease in the number of employees next month (3%), compared to those that reported a decrease over the previous month (13%).

Expected change in business revenue next month, by operating status, July 2020(a)

  1. Proportions are of all businesses
  2. Modified conditions could include, but are not limited to: changes to products and services and how they are provided to customers, workforce changes, new hygiene protocols, changes to suppliers and limiting occupancy. 

Businesses operating under modified conditions were almost three times as likely to expect a decrease in revenue next month compared to businesses operating as normal (32% compared to 11%).

Number of employees, last month and next month, by employment size, July 2020(a)

  1. Proportions are of all businesses
  2. 0-19 persons employed
  3. 20-199 person employed
  4. 200 or more persons employed

Large businesses (i.e. 200 or more persons employed) were twice as likely to report a decrease in the number of employees over the last month compared to small businesses (i.e. 0-19 persons employed) (26% compared to 13%). Large and medium (i.e. 20-199 persons employed) businesses were more likely to report an expected decrease in the number of employees next month compared to small businesses (10% and 13% compared to 2%).

Comments provided by businesses

Data was collected via a telephone interview. Additional insights into drivers for changes within businesses were provided as comments by respondents.

A number of businesses reporting a change in revenue commented that there were minor differences between the reporting period and the previous month, but significant differences compared to the same time last year. Some businesses noted that the seasonal nature of their business impacted on monthly variations in revenue.

Multiple businesses commented that their operating expenses had increased due to requirements around cleaning and hygiene, namely obtaining cleaning products and personal protective equipment (PPE). In contrast, some businesses indicated that increased working from home arrangements had decreased their operating costs.

Many businesses commented that their expected revenue and operating expenses were heavily dependent on whether government regulations would be changing again or staying the same, specifically those regarding social distancing and travel.

Support measures used by businesses

Boosting cash flow for employers measure

Commencing from 28 April 2020, the Australian Government provided temporary cash flow support to businesses and not-for-profit organisations that employ staff. More information on the measure, including eligibility, can be found in the Australian Government’s fact sheet and on the Australian Tax Office website.

Businesses were asked whether they were aware of the Boosting Cash Flow for Employers measure, whether they had received support from the measure and if so, what the funds had been used for. Businesses that had not received support reported reasons why this was the case.
 

Boosting cash flow for employers measure, summary information

Flow chart of Boosting Cash Flow for Employers measure, proportions receiving, how it was used or reasons for not receiving
This is a flowchart that shows the responses of businesses when asked about the temporary cash flow support for employers the Australian Government provided. The first question asks whether businesses received support from the Boosting Cash Flow for Employers measure. The answers were Yes (54%), No (20%) or Not sure or not aware (25%). If a business answered Yes, this flows to the next question of What the support was used for(d)(e). 61% To support employees (i.e. pay wages/salaries) 56% Pay fixed costs (e.g. rent) 33% To service loans or debt 29% Put into savings or cash reserves 15% Capital investment If a business answered No, this flows to the next question of the Reasons for not receiving support(d)(f). 69% Business does not meet eligibility criteria 16% Business has not yet lodged its BAS 14% Further eligibility checks are being undertaken If a business answered Not sure or not aware(c), then there we no further questions.
  1. Proportions are of all businesses; including businesses that may not be eligible for support
  2. The sum of the component items do not equal 100% due to rounding
  3. Survey respondents indicated they were not aware of the Boosting Cash Flow for Employers measure or were not sure if the businesses had received it
  4. Survey respondents could provide more than one response to the question
  5. Proportions are of businesses that received support from the Boosting Cash Flow for Employers measure
  6. Proportions are of businesses that did not receive support from the Boosting Cash Flow for Employers measure
     

More than half of all businesses (54%) reported that they have received support from the Boosting Cash Flow for Employers measure. Businesses that received a cash flow boost most commonly used it to support employees (i.e. pay wages/salaries) (61%) and to pay fixed costs (56%).

For the 20% of businesses that reported they had not received support from the Boosting Cash Flow for Employers measure, the most common reason given was that the business was not eligible (69%).

By employment size, the proportion of businesses that reported they had received support from the Boosting Cash Flow for Employers measure were:

  • 54% of small businesses (i.e. 0-19 persons employed)
  • 63% of medium sized businesses (i.e. 20-199 persons employed)
  • 21% of large businesses (i.e. 200 or more persons employed)
     

Use of boosting cash flow for employers support, by top reporting industries(a)(b)

Use of boosting cash flow for employers support, by top reporting industries
This image shows the top reporting industries for different uses of the temporary cash flow support for employers. To support employees(a) was reported most by Mining (85%), Electricity, Gas, Water and Waste Services (85%), and Manufacturing (78%). Pay fixes costs was reported most by Other Services (81%), Accommodation and Food Services (79%), and Administrative and Support Services (74%). To service loans or debt was reported most by Accommodation and Food Services (52%), Retail Trade (47%), and Transport, Postal and Warehousing (45%). Capital investment was reported most by Mining (42%), Financial and Insurance Services (31%), and Professional, Scientific and Technical Services (27%). Put into savings or cash reserves was reported most by Rental, Hiring and Real Estate Services (45%), Retail Trade (41%), and Information, Media and Telecommunications (38%).
  1. Proportions are of businesses that received support from the Boosting Cash Flow for Employers measure
  2. Businesses could provide more than one response to the question
  3. For example, paying wages or salaries
     

Current use of available support measures and expected business actions when they are no longer available

Two in five (42%) businesses reported they were currently accessing available business support measures such as wage subsidies, deferring loan repayments or renegotiating rent or lease arrangements.

By employment size, the proportion of all businesses that reported they were currently accessing available business support measures were:

  • 42% of small businesses
  • 53% of medium businesses
  • 38% of large businesses
     

Businesses operating under modified conditions (e.g. changes to products and services and how they are provided to customers, workforce changes, new hygiene protocols, changes to suppliers and limiting occupancy) were more than twice as likely to report they were accessing business support measures compared to those operating as normal (51% compared to 20%).

Expected actions when the support measures are no longer available

Businesses also provided information on actions they expect to take when the support measures are no longer available.

Expected business actions when support measures are no longer available, by employment size(a)(b)

 Small (0-19 persons)Medium (20-199 persons)Large (200 or more persons)All businesses
 %%%%
Reduce the workforce13181113
Change product or service options129712
Change quantity of orders of inputs (e.g. stock, raw materials)14161014
Change payment terms with customers or suppliers1013810
Increase prices71038
Defer or cancel investment plans16201116
Seek additional funds10171011
Close the business106210

a. Proportions are of all businesses including those not currently accessing support measures
b. Businesses could provide more than one response to the question


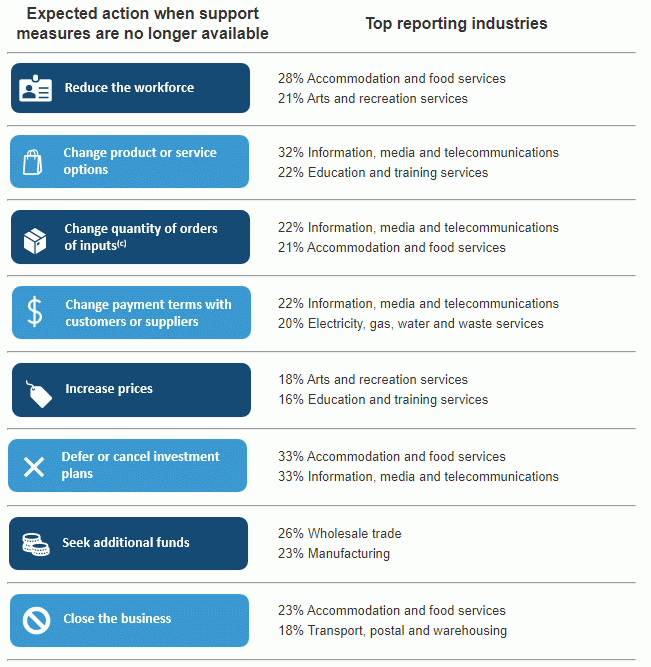
Expected business actions when support measures are no longer available, by top reporting industries(a)(b)

Expected business actions when support measures are no longer available, by top reporting industries
This image shows the top reporting industries for the expected actions a business would take when support measures are no longer available to them. Reduce the workforce was reported most by Accommodation and Food Services (28%) and Arts and Recreation Services (21%). Change product or service options was reported most by Information, Media and Telecommunications (32%) and Education and Training Services (22%). Change quantity of orders of inputs(c) was reported most by Information, Media and Telecommunications (22%) and Accommodation and Food Services (21%). Change payment terms with customers or suppliers was reported most by Information, Media and Telecommunications (22%) and Electricity, Gas, Water and Waste Services (20%). Increase prices was reported most by Arts and Recreation Services (18%) and Education and Training Services (16%). Defer or cancel investment plans was reported most by Accommodation and Food Services (33%) and Information, Media and Telecommunications (33%). Seek additional funds was reported most by Wholesale Trade (26%) and Manufacturing (23%). Close the business was reported most by Accommodation and Food Services (23%) and Transport, Postal and Warehousing (18%).
  1. Proportions are of all businesses
  2. Businesses could provide more than one response to the question
  3. For example, stock or raw materials

Workforce difficulties experienced by businesses

Employing businesses provided information on workforce difficulties they were experiencing in relation to:

  • Filling job vacancies;
  • Meeting sufficient staffing levels with existing employees (including those on leave) and the main barriers in doing so; and
  • Negotiating work arrangements with existing employees, such as hours of work, additional/less shifts, working from home.
     

Filling job vacancies and meeting sufficient staffing levels

  1. Proportions are of all employing businesses
  2. 1% of businesses reported 'Don't know'
  3. Businesses may respond 'Not applicable' if they did not have any job vacancies
  4. 2% of businesses reported 'Don't know'
  5. The sum of the component items do not equal 100% due to rounding
     
  1. Proportions are of all employing businesses
     

Medium businesses (i.e. 20-199 persons employed) were almost twice as likely to experience difficulties in finding staff to fill job vacancies compared to small (i.e. 0-19 persons employed); 19% compared to 11% of small businesses. Medium businesses were also the most likely to experience difficulties in meeting staffing levels with existing employees.

Barriers to meeting sufficient staffing levels

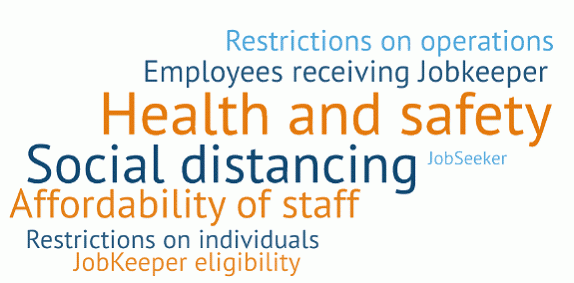
The 9% of employing businesses that reported experiencing difficulties in meeting sufficient staffing levels were asked to provide additional information on the barriers that contributed to these difficulties. The following is an image of the key themes reported by these businesses. More common responses are bigger, bolder and repeated in the image.

Word cloud on perceived barriers to meeting staffing levels with existing employees
Presented in the word cloud are the key themes reported by businesses. More common responses are bigger, bolder and repeated in the image. The approximate order from biggest to smallest: Health and safety Social distancing Affordability of staff Employees receiving Jobkeeper Restrictions on operations Restrictions on individuals JobKeeper eligibility JobSeeker

Difficulties experienced by businesses in negotiating work arrangements with employees

All employing businesses were asked if they had experienced difficulties negotiating work arrangements with employees in relation to hours, rates of pay, changes in duties and work location.

Approximately three in ten employing businesses (31%) reported they had experienced one or more issues in negotiating work arrangements with employees.

Difficulties experienced in negotiating work arrangements with employees, by employment size(a)(b)

 Small (0-19 persons)Medium (20-199 persons)Large (200 or more persons)All employing businesses
 %%%%
Increasing employee hours61176
Reducing employee hours12121712
Changes to rates of pay52115
Change of employee duties10121310
Change of work location (e.g. staff working from home)16173016
Other5795
One or more of the listed work arrangements30384731

a. Proportions are of all employing businesses
b. Businesses could provide more than one response to the question


Difficulties experienced in negotiating work arrangements with employees, by top reporting industries(a)(b)

Difficulties experienced in negotiating work arrangements with employees, by top reporting industries
This image shows the top reporting industries for the difficulties experienced in negotiating work arrangements with employees. Increasing employee hours was reported most by Administrative and Support Services (21%) and Arts and Recreation Services (17%). Reducing employee hours was reported most by Accommodation and Food Services (28%) and Education and Training (21%). Changes to rates of pay was reported most by Arts and Recreation Services (11%) and Construction (9%). Change of employee duties was reported most by Education and Training (27%) and Professional, Scientific and Technical Services (19%). Change of work location was reported most by Professional, Scientific and Technical Services (32%) and Administrative and Support Services (30%).
  1. Proportions are of all employing businesses
  2. Businesses could provide more than one response to the question

Business impacts of COVID-19 visual summary

Show all

Technical note - questionnaire

Show all

Data downloads

Business impacts of COVID-19, July 2020

History of changes

Show all

Back to top of the page