|
|
Unpaid Child Care
On this page:
Description
Image of Question
Classification
Quality Statement
Description
This variable records people, who in the two weeks prior to Census Night, spent time caring for a child/children (under 15 years) without pay. More Detailed Description
Image of Question

Classification
Applicable to: Persons aged 15 years and over
1. Did not provide child care
2. Cared for own child/children
3. Cared for other child/children
4. Cared for own child/children and other child/children
& Not stated
@ Not applicable
V Overseas visitor
Total number of categories: 7
More Detailed Description
Quality Statement - Unpaid Child Care (CHCAREP)
There are many aspects which can affect the quality of Census data; the following information should be considered when viewing data on Unpaid Child Care (CHCAREP).
This question was new for 2006: the data was captured automatically from check box responses on the form so the risk of processing error is minimal. Sample checks of the data are undertaken to ensure an acceptable level of quality.
The non-response rate was 9.2%. Part of this non-response is attributable to the 4.2% of persons (aged 15 years and over) in dwellings which were occupied on Census Night but did not return a completed form. In these cases persons are imputed into these dwellings together with some demographic characteristics, however the values for Unpaid Child Care (CHCAREP) remain "not stated". These are some characteristics of the remaining 5.0% (802,833 people aged 15 years and over) who did not answer the Unpaid Childcare question:
- 50.1% were female;
- 36.8% were married; 35.2% were never married; and 16.9% were widowed;
- of those in occupied private dwellings, 35.5% were husbands or wives in a registered marriage; 20.3% were living alone; and 14.1% were dependent students;
- 47.1% were aged 60 or over;
- 43.5% did not state their income; a further 40.2% reported gross incomes of less than $400 per week;
- 48.4% were not in the labour force (and a further 35.8% did not answer the labour force questions);
- 14.1% were full-time students, and 1.4% were part-time students. A further 35.3% did not answer the student status question.
In a small proportion of cases (testing has indicated that this is less than 2%), respondents provided an incorrect combination of responses. This occurred when a "No" response was marked together with one or both of the "Yes" responses. In these cases the "Yes" responses are retained and the "No" response is rejected.
The 2006 Census shows a small proportion (0.4%) of persons aged 80 years and over indicating that they were caring for their own child aged under 15 years. Further study has found:
- nearly 6% of this subset had their ages imputed due to the lack of respondent information, or to conform with family processing rules. Imputation rules did not reference CHCAREP as a factor, so there is no statistical correlation between the output field AGEP and CHCAREP for this group.
- The remainder reported their Date of Birth, and/or Age last birthday, and the output (AGEP) remains 'as reported'. The following scenarios are possible for this data:
- both variables are correct (for example an aged step-parent looking after his/her adopted child); or
- AGEP is correct and the CHCAREP response is wrong (respondents may have misunderstood the childcare question eg. considered grandchildren or other children in the extended family to be their "own" children or did not realise that the question referred only to children "under 15 years of age"). The likelihood of this is heightened for the 34.1% who were not born in Australia, and particularly for the 64.8% of these who indicated that they spoke a language other than English at home); or
- AGEP is incorrect and CHCAREP is correct (refer to the Data Quality Statement for AGEP (Age) for further information about the quality of age data). The likelihood of this scenario is increased for the 44.6% who indicated that they were currently in the labour force; or
- neither variable is correct.
Users are advised to use this subset of information with caution.
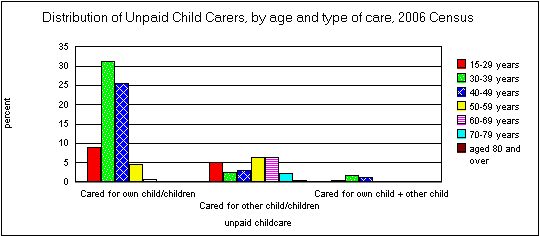
The distribution of unpaid child care providers by age group is shown in the following graph:

Census data can be used for the analysis of population characteristics at finer geographic levels and for smaller sub-groups than would be reliably available from household surveys. However, at small area data levels, outliers (unusual results) may become more apparent to users. This becomes more probable as other data items are incorporated in the analysis, and users are reminded that almost all census data is as originally reported by the respondents. For some variable combinations, the use of interview-based, correlated survey results at a broader geographic level may therefore be more appropriate.
Additional sources of information regarding unpaid child care can be found in other ABS publications and associated collections, including:
- Child Care, Australia, June 2005 (cat. no. 4402.0), which refers to formal and informal arrangements (other than care by resident parents) made for the care of children aged 0-12 years;
- How Australians Use Their Time, Australia, 2006 (cat. no. 4153.0) which measures unpaid work in the home and the community, including care for children;
- Australian Social Trends (cat. no. 4102.0, various years) containing a variety of articles pertaining to child care.
Selected ABS Theme Pages on the ABS Website (addressing 'Children and Youth Statistics'; 'Family and Community Statistics'; and 'Labour') also contain links to alternative data sources that may be of relevance to users.
The ABS aims to produce high quality data from the Census. To achieve this, extensive effort is put into Census form design, collection procedures, and processing procedures. More details regarding these efforts can be found in:
All are available from the ABS Website.
|
|
|
 Print Page