|
|

DISABILITY PREVALENCE
Just under one in five Australians (18.5% or 4.0 million persons) reported having a disability in 2009. A further 21% had a long-term health condition that did not restrict their everyday activities. The remaining 60% of the Australian population had neither a disability nor a long term health condition. Of those with a disability, 87% had a specific limitation or restriction; that is, an impairment restricting their ability to perform communication, mobility or self-care activities, or a restriction associated with schooling or employment.
The prevalence of disability in Australia has fallen 1.5 percentage points from 20.0% in 2003 to 18.5% in 2009. After removing the effects of different age structures the age standardised rate fell by 2.1 percentage points, from 19.8% in 2003 to 17.7% in 2009.
As people grow older, there is an increased tendency to develop conditions that cause disability. This strong relationship between age and disability is evident in that younger people are less likely to report disability than older people. Of those aged 4 years and under, 3.4% were affected by disability, compared with 40% of those aged 65-69 years and 88% of those aged 90 years and over. While the prevalence of disability amongst the Australian population declined 1.5 percentage points, the decrease is particularly noticeable in the younger age groups. Between 2003 and 2009, the disability rate for 15-24 year olds fell from 9.0% to 6.6%. Over the same period the rate of disability also decreased for those aged 25-34 from 11% to 8.6%. Similarly, 22% of 45-54 year olds reported a disability in 2003, compared with 18% in 2009 (Graph 1). |

While the rate of profound or severe limitation in the core activities of communication, mobility and self-care declined from 6.3% in 2003 to 5.8% in 2009, significant differences were found across age/sex groups in the type of restriction (Graph 2).
For example, the rate of profound or severe core-activity limitation for 5-14 year old males (6.6% ) was close to double that of females of the same age (3.0%).
In contrast, women aged 90 years and over had a higher rate of profound or severe core-activity limitations (75%) than men of the same age (58%).
Similar patterns are observed in the moderately and mildly disabled population until late in life when the prevalence plateaus and then decreases.

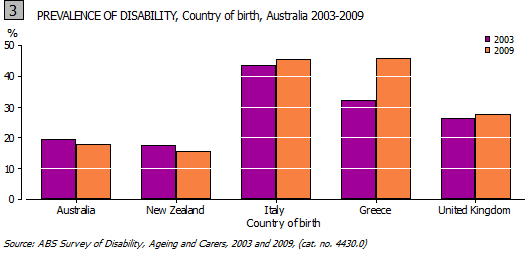
Disability varies by birthplace or immigrant group. There was a decline in the proportion of people with disability in the population who were born in Australia or New Zealand, while disability rates for those born in South Eastern Europe have increased since 2003. This reflects the older age profile of the immigrant population from South Eastern Europe. Since age and disability are correlates, sub-populations in Australia with older median ages (such as those born in South Eastern Europe) can be expected to show higher rates of disability (Graph 3).

There is some variability in the distribution of disability reported across States and Territories. The disability prevalence rate is highest in Tasmania (Graph 4) and lowest in the Northern Territory and Australian Capital Territory. This pattern relates to the differing age structures of the populations of the states and territories. The Northern Territory (31.2 years) and Australian Capital Territory (34.7 years) have the lowest median ages in the country, while Tasmania has the highest (39.6 years).

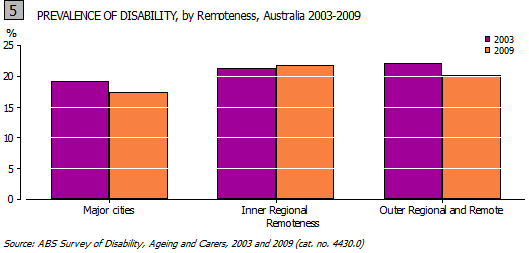
The prevalence of disability according to remoteness has changed between 2003 and 2009 (Graph 5). The prevalence of disability in the Major cities and Outer Regional and Remote areas of Australia has decreased by 2 percentage points in the 6 years between surveys, while the prevalence in Inner Regional Australia has increased marginally (by 0.6 percentage points). Of the people living in Inner Regional Australia, 22% reported having a disability, compared to 17% of those living in Major Cities and 20% of those living in Outer Regional and Remote Australia.
 |
|
|
 Print Page
 Print All
 Print Page
 Print All