Contents >>
Prices >>
Pensioner and Beneficiary Living Cost Index (Article)
FEATURE ARTICLE 1: PENSIONER AND BENEFICIARY LIVING COST INDEX
The government's Pension Review Report completed by Dr Jeff Harmer in February 2009 followed a comprehensive review of Australia's pension system. In response to the review, the government funded the ABS to produce a new price index that reflects the changes in the living costs of pensioners and other households receiving income support from the government more explicitly than does the Consumer Price Index (CPI).
In the 2009 Federal Budget, the government indicated that it will use the new index, known as the Pensioner and Beneficiary Living Cost Index (PBLCI), to index base pension rates where it is higher than the CPI. The PBLCI was first published on 24 August 2009 with quarterly data dating back to June quarter 2007. This index is published by the ABS on a quarterly basis.
Description of the PBLCI
The PBLCI is a measure of the effect of changes in prices on the living expenses of a subgroup of the Australian population: age pensioner households and other government transfer recipient households. The PBLCI is based on the Analytical Living Cost Indexes (ALCIs), which have been compiled and published by the ABS since June 2000. These living cost indexes are produced as a by-product of the CPI. They are the conceptually preferred measures for assessing the effect of changes in prices on the out-of-pocket living expenses of subgroups of the Australian population.
Conceptually, the biggest difference between the PBLCI and the CPI is that the PBLCI includes interest charges but does not include house purchases, while the CPI includes new house purchases but does not include interest charges. Additionally, insurance services are treated differently, where the PBLCI uses gross premiums, while net premiums are used in the CPI.
Initially, the PBLCI has been derived by combining the existing ALCIs for age pensioner households and other government transfer recipient households. The PBLCI is calculated by summing the expenditure aggregates for these two population subgroups at the expenditure class level.
PBLCI Publication
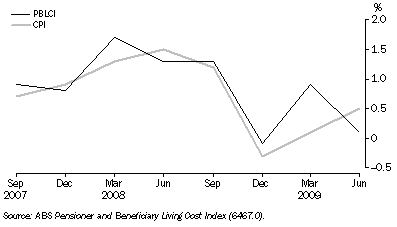
The first publication of the PBLCI included a time series of movements, points change and index numbers dating back to the June quarter 2007. Positive quarterly movements have been recorded every quarter with the exception of December 2008 (-0.1%). In the same quarter the CPI recorded a negative movement of -0.3%. Positive through the year movements have been recorded each quarter, however the magnitude of these rises has been steadily falling since the September 2008 quarter (table 29.8).
29.8 Pensioner and Beneficiary Living Cost Index, All Groups, Weighted average of eight capital cities(a) |
|
 |  | PERCENTAGE CHANGE
|  | CHANGE IN POINTS CONTRIBUTION
|
| Quarters | Index Numbers | From previous quarter | From corresponding quarter of previous year |  | From previous quarter | From corresponding quarter of previous year |
|
| September | 100.9 | 0.9 | . . |  | 0.9 |  |
| December | 101.7 | 0.8 | . . |  | 0.8 | . . |
| March | 103.4 | 1.6 | . . |  | 1.7 | . . |
| June | 104.7 | 1.3 | 4.7 |  | 1.3 | 4.7 |
| September | 106.1 | 1.3 | 5.2 |  | 1.4 | 5.2 |
| December | 106.0 | -0.1 | 4.2 |  | -0.1 | 4.3 |
| March | 107.0 | 0.9 | 3.5 |  | 1.0 | 3.6 |
| June | 107.1 | 0.1 | 2.3 |  | 0.1 | 2.4 |
|
| . . not applicable |
| (a) Reference base of index: June quarter 2007 = 100.0 |
| Source: ABS Pensioner and Beneficiary Living Cost Index (6467.0). |
The PBLCI publication also compares the percentage movements of the PBLCI with the movements of the CPI. Graph 29.9 shows that initially the quarterly movements were quite similar for the PBLCI and CPI, however the movements have differed more so over the past 12 months.
29.9 Pensioner and Beneficiary Living Cost Index and CPI, All groups, ^Change from previous quarter (%)

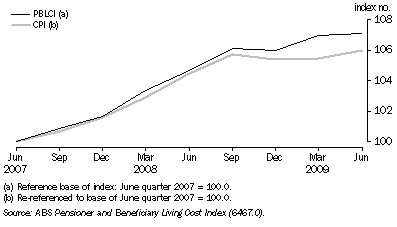
The recent divergence in the quarterly movements of the PBLCI from the movements of the CPI is demonstrated in Graph 29.10. The PBLCI and the re-referenced CPI track each other quite closely up until the September quarter 2008, after which the PBLCI has remained above the CPI.
29.10 Pensioner and Beneficiary Living Cost Index and CPI (re-referenced), ^index numbers

Plans to improve the PBLCI
The ABS is working to improve the PBLCI. The sample size for the 2009-10 Household Expenditure Survey (HES) has been expanded to include more households in the reference population i.e. age pensioner households and other government transfer recipient households. The sample increase primarily addresses the need to have significantly improved expenditure weights for the PBLCI. Increasing the number of households in the reference population in the HES sample should enable the ABS to provide accurate estimates of expenditure for each of the capital cities.The new HES data will be used to improve the weights for the PBLCI reference population from the September quarter 2011 onwards.
The ABS plans to capture detailed information during processing from the expanded HES sample, analyse it to determine whether any additional price collections are needed to make the PBLCI more robust and, if so, undertake those collections. For example, a detailed analysis may show that the types of items purchased by the PBLCI reference population move at a different rate than those purchased by the CPI population in general. If the differences are significant, then a more detailed approach to those items in the price collection may be warranted.
 Print Page