VALUE OF GOODS AND SERVICES PRODUCED BY AUSTRALIAN INDUSTRY
One measure of the importance of an industry is its contribution to the Australian economy. The size of the Australian economy is typically described in terms of GDP, and the structure and performance of the economy in terms of industry gross value added (GVA).
GDP is an estimate of the total market value of goods and services produced in Australia in a given period after deducting the cost of goods and services used up in the process of production (intermediate consumption), but before deducting consumption of fixed capital. This is also described as the unduplicated value of economic production. This measure avoids double counting the goods and services produced at successive stages of production. Accordingly, it is a measure of the value added in production.
Industry GVA is the term used to describe the unduplicated value of goods and services produced by individual industries. This measure removes the distortion caused by variations in the incidence of commodity taxes and subsidies across the output of individual industries. Movements in the volume measures of GDP and industry GVA (from which the direct effects of price changes have been removed) are key indicators of economic growth. More information is provided in the National accounts chapter of this edition of Year Book Australia.
Table 15.1 provides details of industry GVA and GDP for 2007-08. Data are presented at a broad industry level, generally equating to the Division level of the Australian and New Zealand Standard Industrial Classification (ANZSIC), 1993 (1292.0). In the ANZSIC, individual businesses are assigned an appropriate industry category on the basis of their predominant activities. The table provides estimates of the unduplicated production of goods and services (industry GVA) from 2003-04 to 2007-08.
In 2007-08, the value of Australian production (GDP) was $1,084 billion (b) (in volume terms), an increase of 4% from 2006-07. In 2007-08, the ratio of GDP to the estimated resident population (GDP per person) was $51,253.
15.1 INDUSTRY GROSS VALUE ADDED AND GROSS DOMESTIC PRODUCT, Volume measures(a)(b) |
|
 | 2003 - 04 | 2004 - 05 | 2005-06 | 2006-07 | 2007-08 |
| ANZSIC Division | $m | $m | $m | $m | $m |
|
| Agriculture, forestry and fishing | 26 279 | 27 361 | 28 145 | 23 152 | 25 085 |
| Mining | 71 521 | 74 793 | 75 613 | 81 415 | 82 650 |
| Manufacturing | 103 093 | 101 846 | 101 320 | 103 292 | 106 776 |
| Electricity, gas and water supply | 21 655 | 21 827 | 22 117 | 21 854 | 21 904 |
| Construction | 60 603 | 63 490 | 68 746 | 72 408 | 77 101 |
| Wholesale trade | 43 861 | 45 370 | 46 693 | 47 626 | 49 013 |
| Retail trade | 51 506 | 53 743 | 54 281 | 56 342 | 58 932 |
| Accommodation, cafes and restaurants | 18 568 | 19 480 | 20 050 | 20 461 | 20 529 |
| Transport and storage | 42 221 | 44 518 | 45 725 | 48 409 | 51 294 |
| Communication services | 20 336 | 21 018 | 22 555 | 24 616 | 26 377 |
| Finance and insurance | 64 377 | 66 960 | 70 426 | 76 576 | 80 270 |
| Property and business services(c) | 117 175 | 118 386 | 121 911 | 124 830 | 131 907 |
| Government administration and defence | 36 607 | 37 894 | 38 683 | 40 667 | 40 708 |
| Education | 41 380 | 41 880 | 42 400 | 43 036 | 43 681 |
| Health and community services | 55 193 | 57 341 | 60 218 | 61 650 | 64 758 |
| Cultural and recreational services | 13 475 | 14 251 | 14 651 | 15 571 | 16 120 |
| Personal and other services | 17 441 | 17 665 | 18 371 | 19 183 | 19 848 |
| Ownership of dwellings | 72 916 | 75 937 | 78 813 | 81 410 | 83 423 |
| Gross value added at basic prices | 878 403 | 903 586 | 931 040 | 962 500 | 1 000 377 |
| Gross Domestic Product | 956 017 | 982 786 | 1 012 269 | 1 045 674 | 1 084 156 |
|
| (a) Reference year is 2006-07. |
| (b) Volume measures for years other than 2006-07 and 2007-08 are not additive. |
| (c) Excludes ownership of dwellings. |
| Source: ABS Australian System of National Accounts, 2007–08 (5204.0). |
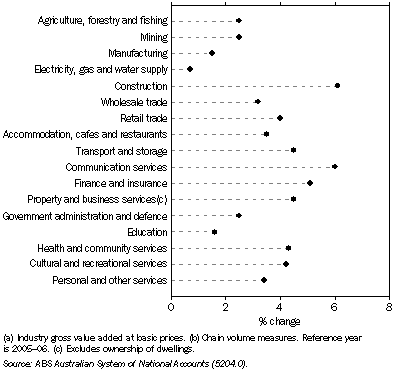
Graph 15.2 shows the average annual rate of growth in GVA (in volume terms) for individual industries between 1997-98 and 2007-08. The Construction industry had the highest average annual rate of growth (just over 6%), followed by the Communication services (6%) and Finance and Insurance (5%).
While average annual growth rates provide an indicator of the broad underlying behaviour of the annual series over several years, these averages smooth the annual movements in the series and mask the highest and lowest movements. In terms of year-on-year changes, the fastest growing industry in this period, the Construction industry, showed mainly fluctuating increases in GVA throughout the decade, but with a 14% decline between 1999-2000 and 2000-2001. In 2005-06, GVA of the Construction industry rose by 8%.The following year, in 2006-07, GVA of the Communication services industry rose by 9%.
The year-on-year changes for the Agriculture, forestry and fishing industry also varied significantly over time. While the value of production (GVA) of this industry grew by 3% on average each year between 1997-98 and 2007-08, it fell by 24% in 2002-03, due largely to the effects of drought on agricultural production. This was followed by strong growth in 2003-04, immediately following the 2002-03 drought.
15.2 Average annual rate of growth in the production of goods^and services(a)(b) - 1997-98 to 2007-08

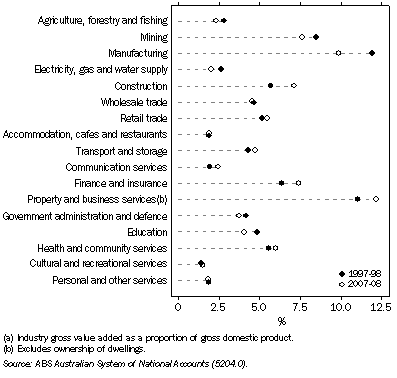
Graph 15.3 shows industry GVA shares of GDP for 1997-08 and 2007-08. Property and business services contributed the largest share to GDP (12%) in 2007-08, followed by Manufacturing (10%) and Mining (8%).
Between 1997-98 and 2007-08, the largest increase in industry GVA share of GDP was for Construction (up 1.4%), followed by Property and business services (1.2%).
In the ten-year period, the largest fall in industry share of GDP was for Manufacturing (down 2.1%), followed by Mining (down 0.8%).
15.3 Contribution to Gross Domestic Product(a)

 Print Page