CONSUMPTION
Rising household incomes in Australia have been reflected in higher levels of consumption of goods and services.
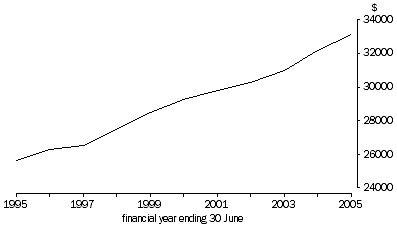
Real per capita household consumption expenditure grew by 2.8% per year on average between 1994–95 and 2004–05.
Higher levels of consumption have implications for waste generation and energy consumption among other environmental concerns. For example, increased levels of consumption of goods generate increased waste which has environmental implications for its disposal.
REAL FINAL CONSUMPTION EXPENDITURE PER CAPITA
 Note: Volume measure; reference year 2003–04.
Source: ABS, Australian System of National Accounts, 2004–05 (cat. no. 5204.0)
REAL HOUSEHOLD FINAL CONSUMPTION PER CAPITA
|
 | 1994–95 | 2004–05 | Avg. annual growth rate |
 | $ | $ | % |
|
| Food | 2 549 | 2 784 | 0.9 |
| Alcoholic beverages and tobacco | 975 | 1 007 | 0.3 |
| Clothing and footwear | 786 | 995 | 2.4 |
| Rent and other dwelling services | 3 532 | 4 388 | 2.2 |
| Electricity, gas and other fuel | 404 | 514 | 2.4 |
| Furnishings and household equipment | 1 009 | 1 470 | 3.8 |
| Health | 1 082 | 1 289 | 1.8 |
| Transport | 2 198 | 2 989 | 3.1 |
| Communication | 319 | 734 | 8.7 |
| Recreation and culture | 1 919 | 3 079 | 4.8 |
| Education services | 682 | 847 | 2.2 |
| Hotels, cafes and restaurants | 1 554 | 1 900 | 2.0 |
| Miscellaneous goods and services | 2 531 | 3 449 | 3.1 |
| Total | 19 376 | 25 447 | 2.8 |
|
Note: Volume measures; reference year 2003-04. Components may not sum to totals.
Source: ABS, Australian System of National Accounts, 2004-05 (cat. no. 5204.0) |
 |  |  |  |
 |
 Print Page
 Print All