PUBLIC ATTITUDES
PUBLIC CONCERN ABOUT ENVIRONMENTAL ISSUES
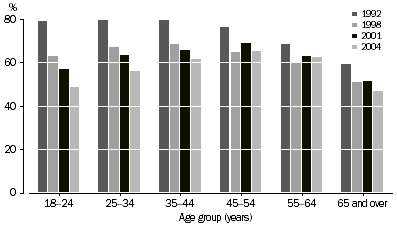
Data on concern about environmental issues have been collected by the ABS since 1992. Over this period, Australian's level of concern has a shown a continual decline. In March 2004, 57% of Australians aged 18 years and over reported concern about environmental issues, down from a high of 75% in May 1992.
In recent times, issues such as drought, bushfires, water reform and climate change have featured prominently in the media in various regions of Australia. Overall concern about environmental issues, however, has shown a decline between 2001 and 2004 (from 62% down to 57%). All states and territories showed a decline in concern about environmental issues in the period 2001 to 2004. In 2004, people in the Australian Capital Territory reported the highest level of concern (69%), followed by South Australia and Western Australia (both 63%). Those in the Northern Territory had the lowest level of concern (46%).
People aged between 45-54 years expressed the most concern (65%) about environmental issues and those aged 65 years and over, expressed the least (47%).
PUBLIC CONCERN ABOUT ENVIRONMENTAL ISSUES, by age
 Source: Environmental Issues: People's Views and Practices, 2004 (cat. no. 4602.0).
PUBLIC CONCERN ABOUT ENVIRONMENTAL ISSUES, by state |
|
 | 1992 | 1994 | 1996 | 1998 | 2001 | 2004 |
 | % | % | % | % | % | % |
|
| NSW | 73.6 | 69.2 | 66.5 | 63.0 | 59.0 | 54.9 |
| Vic. | 75.2 | 67.2 | 70.5 | 61.8 | 61.2 | 59.0 |
| Qld | 74.0 | 68.5 | 66.8 | 62.2 | 62.5 | 53.7 |
| SA | 77.0 | 73.0 | 72.6 | 65.0 | 69.7 | 62.8 |
| WA | 76.0 | 70.1 | 70.8 | 67.4 | 68.5 | 62.5 |
| Tas. | 70.7 | 61.3 | 58.1 | 55.3 | 59.9 | 51.5 |
| NT | 79.6 | 72.2 | 66.1 | 67.9 | 61.8 | 46.0 |
| ACT | 83.5 | 74.2 | 75.1 | 68.7 | 70.7 | 69.0 |
 |  |  |  |  |  |  |
| Australia | 74.8 | 68.9 | 68.4 | 63.1 | 62.2 | 57.1 |
|
| Source: ABS Environmental Issues: People's Views and Practices, 2004 (cat. no. 4602.0). |
HOUSEHOLD PURCHASE OF ENVIRONMENTALLY FRIENDLY PRODUCTS
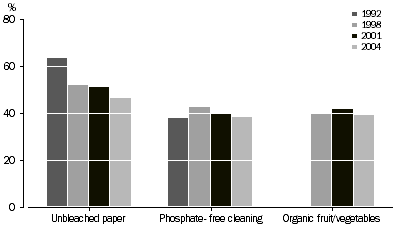
Environmentally friendly products (EFPs) are products that have less impact on the environmental and human health compared with other products that serve the same purpose. Nine in ten Australian households use at least one type of EFP. Recycled paper products (67%) and products with refillable containers (65%) were the EFPs purchased most often by Australian households. These were followed by unbleached paper products and organically grown fruit and vegetables.
The purchase of unbleached paper products continued to decline, down to 46% from 51% in 2001. Households with dependent children were most likely to use EFPs.
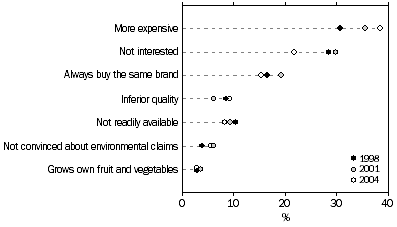
Ten per cent of Australian households did not use any EFPs at all. Cost was the single most important reason why households did not purchase any of the EFPs identified, and this reason has increased over time from 31% in 1998 to 39% in 2004.
HOUSEHOLD PURCHASE OF ENVIRONMENTALLY FRIENDLY PRODUCTS
 Note: No data for organic fruit/vegetables in 1992.
Source: Environmental Issues: People's Views and Practices, 2004 (cat. no. 4602.0).
REASONS WHY PEOPLE DO NOT USE ENVIRONMENTALLY FRIENDLY PRODUCTS
 Source: Environmental Issues: People's Views and Practices, 2004 (cat. no. 4602.0).
 Print Page
 Print All