NOTES
FINAL ISSUE
This is the final issue of this publication.
Country statistics on an international merchandise trade basis and country statistics covering international trade in services will continue to be available as AusStats tables on the ABS web site <https://www.abs.gov.au>. These tables are released with International Trade in Goods and Services, Australia (cat. no. 5368.0).
The country breakdown of data on income credits and debits will continue to be available from the publication International Investment Position: Supplementary Country Statistics (cat. no. 5352.0).
CHANGES IN THIS ISSUE
Revisions
Revisions have been made as a result of incorporating the latest available data.
European Union (EU) Membership
The addition of ten countries in May 2004 expanded the EU membership to 25 countries. While the addition of these countries to the EU occurred in May 2004, in ABS statistics the addition has been applied to EU estimates from 1 July 2004 to coincide with financial year reporting.
ABOUT THE PUBLICATION
This publication presents statistics on Australia’s balance of payments by selected countries, supplementing the quarterly publication Balance of Payments and International Investment Position, Australia (cat. no. 5302.0). This issue contains partner country estimates of Australia’s current and capital accounts.
All statistics in this issue except income are consistent with those published in the March quarter 2005 issue of Balance of Payments and International Investment Position, Australia (cat. no. 5302.0). The income data includes revisions made since the release of that publication.
The estimates in this publication are presented on a calendar year basis. This allows for better analysis in terms of international comparisons as data for most other countries are available on a calendar year basis.
This publication contains balance of payments components by country for the countries and country groups listed in the Appendix. The alternative presentation of country by balance of payments components is available as Data Cubes on the ABS web site <https://www.abs.gov.au>. For other related ABS products and services, see paragraphs 6-8 of the Explanatory Notes.
ROUNDING
Discrepancies may occur between totals in this publication and the same aggregates from other sources, and between sums of component items and totals due to rounding.
INQUIRIES
For further information about these and related statistics, contact the National Information and Referral Service on 1300 135 070 or Tom Jebbink on Canberra (02) 6252 5540.
ANALYSIS OF RESULTS
CURRENT ACCOUNT
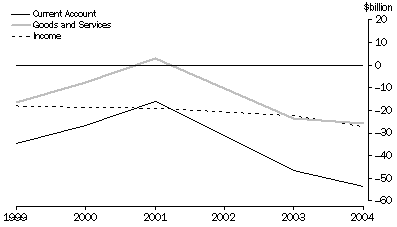
The current account deficit for 2004, was $54.0 billion, an increase of $7.2 billion on the deficit of $46.9 billion in 2003. The current account deficit as a percentage of Australia’s gross domestic product (GDP) increased from 6.0% in 2003 to 6.4% in 2004.
The increase in the current account deficit was the net effect of the following:
- an increase of $1.4 billion in the net goods deficit to $24.7 billion
- an increase of $4.9 billion in the net income deficit to $27.9 billion
- an increase of $0.7 billion in net services to a deficit of $1.1 billion.
The following graph shows major aggregates of the current account
Current Account, MAJOR AGGREGATES

When analysed by country, Australia’s largest current account surpluses in 2004 were with:
- New Zealand, the surplus increased by $1.4b (24%) to $7.0b
- India, the surplus increased by $2.0b (73%) to $4.7b
- Republic of Korea, the surplus increased by $1.1b (31%) to $4.7b
- Japan, the surplus increased by $2.2b (114%) to $4.2b
- Asia n.e.s., (see the Appendix for countries included in this group), the surplus increased by $0.6b (29%) to $2.7b.
The largest current account deficits in 2004 were with:
- United States of America, the deficit increased by $1.8b (12%) to $16.5b
- Germany, the deficit increased by $0.1b (1%) to $7.7b
- People’s Republic of China, the deficit increased by $1.6b (31%) to $6.9b
- United Kingdom, the deficit increased by $3.7b (147%) to $6.2b
- International Capital Markets (see the Appendix for securities and loans included in this group), the deficit decreased by $1.3b (41%) to $4.6b.
GOODS
Australia’s largest net goods surpluses in 2004 were with:
- Japan, the surplus increased by $2.1b (62%) to $5.4b
- India, the surplus increased by $2.0b (83%) to $4.3b
- Republic of Korea, the surplus increased by $0.9b (29%) to $4.2b
- Asia n.e.s., the surplus increased by $1.0b (37%) to $3.7b
- New Zealand, the surplus increased by $0.4b (14%) to $3.6b.
The largest net goods deficits in 2004 were with:
- United States of America, the deficit increased marginally to $11.1b
- People’s Republic of China, the deficit increased by $1.8b (34%) to $7.0b
- Germany, the deficit increased by $0.1b (2%) to $6.9b
- France, the deficit increased by $0.8b (27%) to $3.7b
- Malaysia, the deficit increased by $0.9b (38%) to $3.2b.
GOODS CREDITS (EXPORTS)
The main countries of destination for exports of goods in 2004 were:
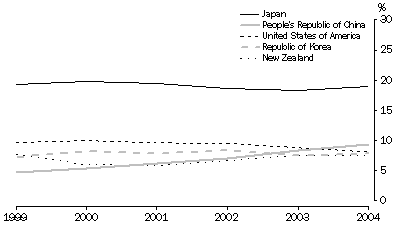
- Japan, an increase of $2.6b (13%) to $22.4b or 19% of total goods credits
- People’s Republic of China, an increase of $1.9b (21%) to $11.1b or 9% of total goods credits
- United States of America, an increase of $0.1b (1%) to $9.6b or 8% of total goods credits
- Republic of Korea, an increase of $1.1b (14%) to $9.2b or 8% of total goods credits
- New Zealand, an increase of $0.6b (8%) to $8.8b or 7% of total goods credits.
The following graph shows the percentage contribution to total goods credits by the main destination countries.
GOODS CREDITS, MAIN DESTINATION COUNTRIES

GOODS DEBITS (IMPORTS)
The main sources for imports of goods in 2004 were:
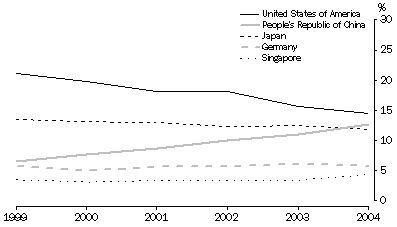
- United States of America, an increase of $0.1 billion (1%) to $20.8 billion or 15% of total goods debits
- People’s Republic of China, an increase of $3.7 billion (26%) to $18.1 billion or 13% of total goods debits
- Japan, an increase of $0.5 billion (3%) to $17.0 billion or 12% of total goods debits
- Germany, an increase of $0.2 billion (2%) to $8.3 billion or 6% of total goods debits
- Singapore, an increase of $1.8 billion (39%) to $6.3 billion or 4% of total goods debits.
The following graph shows the percentage contribution to total goods debits by the main source countries.
GOODS DEBITS, MAIN SOURCE COUNTRIES

SERVICES CREDITS (EXPORTS)
The main countries to which Australia provided services in 2004 were:
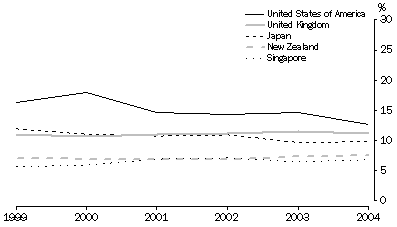
- United States of America, a decrease of $0.3b (7%) to $4.4 billion or 13% of total services credits
- United Kingdom, an increase of $0.1 billion (3%) to $3.8 billion or 11% of total services credits
- Japan, an increase of $0.2 billion (7%) to $3.4 billion or 10% of total services credits
- New Zealand, an increase of $0.2 billion (8%) to $2.6 billion or 8% of total services credits
- Singapore, an increase of $0.2 billion (11%) to $2.3 billion or 7% of total services credits.
The following graph shows the percentage contribution to total services credits by the main destination countries.
SERVICES CREDITS, MAIN DESTINATION COUNTRIES

SERVICES DEBITS (IMPORTS)
The main countries which provided services to Australia in 2004 were:
- United States of America, a marginal decrease to $6.1 billion or 17% of total services debits
- United Kingdom, an increase of $0.1 billion (3%) to $3.9 billion or 11% of total services debits
- Singapore, an increase of $0.2 billion (9%) to $2.6 billion or 7% of total services debits
- Japan, an increase of $0.1 billion (7%) to $2.0 billion or 6% of total services debits
- Asia n.e.s., an increase of $0.2 billion (10%) to $2.0 billion or 6% of total services debits.
The following graph shows the percentage contribution to total services debits by the main source countries.
 Print Page
 Print All