NOM BY AGE AND SEX
The net of overseas migration by age and sex is the difference between each arrival added to the population by age and sex (NOM arrivals) and each departure subtracted from the population by age and sex (NOM departures). For those travellers contributing to NOM in 2009-10, the sex ratio (the number of males per 100 females) was 102. For those contributing to NOM arrivals it was 100, whereas for those contributing to NOM departures it was 106 males per 100 females.
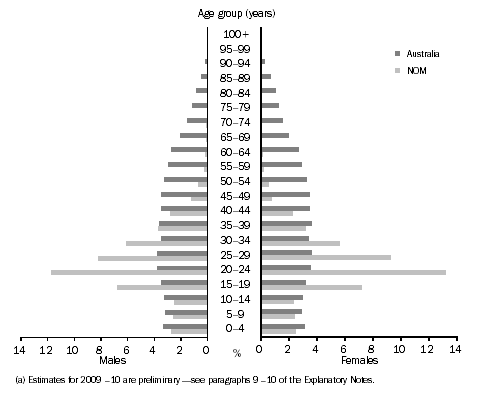
The main effect of NOM on the age structure of Australia's population is that it results in a larger proportion of persons of early working age (15-34 years) as shown in figure 3.5. Each year, however, NOM has little effect on the overall age structure of Australia's total population when compared to the far stronger impact that an increase in the birth rate can provide, in particular to that of an ageing population. In addition, the impact temporary migration has on the NOM population age structure is substantial for persons aged 15-34 years (see figure 3.17). However, once temporary migrants are removed from the age structure, those migrants left in Australia have very little impact on Australia's age structure.
In 2009-10, persons aged 15-34 years comprised 68% of the net contribution to NOM compared to 28% of Australia's total population. Persons aged 0-14 years comprised 15% of the net contribution to NOM and 19% of Australia's population, and persons aged 65 years and over comprised just 0.4% of the net contribution to NOM but 13% of Australia's population (see figure 3.5).
Just four years earlier in 2005-06, prior to the large increase in temporary arrivals (with data also based on the 12/16 month rule - see Glossary), persons aged 15-34 years comprised 58% of the net contribution to NOM, 10 percentage points lower than in 2009-10. The majority of this recent growth is mainly from international students aged in their early 20s.
3.5 Australian and NOM Population Structures, Age and sex
- 2009-10(a)

1 DIAC 2010, Population Flows: Immigration aspects 2008–09 edition, Ch 3.
<back
2 DIAC 2005, Population Flows: Immigration aspects 2003–04 edition, Ch 5 p 62.
<back
3 DIAC 2009, Population Flows: Immigration aspects 2007–08 edition, Ch 3 p 55.
<back
4 DIAC 2010, Population Flows: Immigration aspects 2008–09 edition, Ch 2 p 45.
<back
5 DIAC 2009, Population Flows: Immigration aspects 2007–08 edition, Ch 3 p 59.
<back
6 DIAC 2009, Population Flows: Immigration aspects 2007–08 edition, Ch 3 p 53.
<back
7 DIAC 2009, Population Flows: Immigration aspects 2007–08 edition, Ch 2 p 24.
<back
8 DIAC 2010, Population Flows: Immigration aspects 2008–09 edition, Ch 4 p 80.
<back
 Print Page
 Print All