HOUSEHOLD WASTE MANAGEMENT
HOUSEHOLD WASTE MANAGEMENT(a), Western Australia
|
 | 2009 | 2009 |  | 2006 | 2003 |
 |  |  |  |  |  |
 | '000 | % |  | % | % |
|
| Recycled waste(b) | 808.3 | 95.9 |  | 96.2 | 91.7 |
| Re-used waste(c) | 736.3 | 87.3 |  | 87.3 | 83.3 |
| Neither recycled or re-used waste | 16.0 | 1.9 |  | *0.9 | 3.4 |
|
| *Estimate has a standard error of 25% to 50% and should be used with caution. |
| (a) Refers to number of households that have recycled or re-used household waste in the 12 months prior to the survey. |
| (b) Households that recycled at least one surveyed waste item. |
| (c) Households that re-used at least one surveyed waste item. |
| Source: Environmental Issues: Household Waste Management and Transport Use (cat no. 4602.0.55.002) |
 |
 |  |  |  |  |  |
- Of the estimated 843,000 Western Australian households in 2009, almost 96% had participated in some form of recycling in the previous 12 months, similar to the proportion in 2006. Likewise, the proportion of households re-using waste remained at just over 87% between 2006 and 2009. Less than 2% of households in WA did not re-use or recycle any household waste items in 2009.
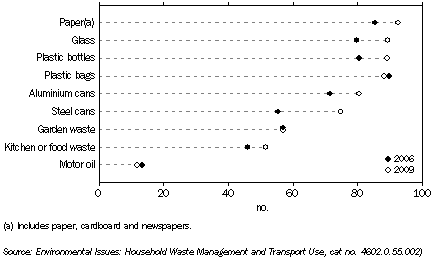
Type of Household Waste Recycled or Re-used, Selected Items

- In 2009, the most recycled and/or reused items among households in WA were Paper, cardboard and newspapers (92%), followed by Glass (89%), Plastic bottles (89%), and Plastic bags (83%). Western Australian households were recycling most surveyed items at a greater rate than in previous years. Steel cans showed the greatest increase, with 74% of households recycling or re-using these items compared with 56% in 2006.
- The most common reason given for not recycling a waste item was not using any or enough materials to warrant recycling or not appropriate (96%). Almost one in five (17%) Western Australian households reported they had not recycled an item because they were not interested or it was too much effort.
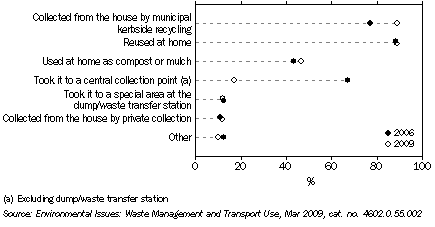
Ways in which Households Recycle Waste

- Western Australians were less likely to take their household waste to a central collection point, other than a dump or waste transfer station, in 2009 (17%) than they were in 2006 (67%). This can be partly attributed to the increased use of municipal kerbside recycling, which rose from 77% to 89% between 2006 and 2009.
This link take you to the Downloads page for
Environmental Issues: Waste Management and Transport Use, Mar 2009 (cat. no. 4602.0.55.002) where you can access additional statistics on this topic, including individual state/territory and national data.
 Print Page
 Print All